GETTING TO $72 BILLION: BIA/Kelsey's Mobile Ad Revenue Forecast A BIA/Kelsey Industry Watch Report
←
→
Page content transcription
If your browser does not render page correctly, please read the page content below

GETTING TO $72 BILLION:
BIA/Kelsey’s Mobile Ad Revenue Forecast

A BIA/Kelsey Industry Watch Report
Free download, courtesy of Marchex

© Copyright 2017. All Rights Reserved. BIA/Kelsey
CONTENTS
         Executive Summary................................................................................................................................... 1

         Mobile: The View From Space ................................................................................................................. 3

            Location, Location, Location ................................................................................................................ 4

            Why Local? .............................................................................................................................................. 5

            Local = Offline ........................................................................................................................................ 6

            Audience Targeting ............................................................................................................................... 7

                The ‘10% Problem’ ............................................................................................................................. 8

                National-to-Local................................................................................................................................ 9

         Formats ..................................................................................................................................................... 10

            Search.................................................................................................................................................... 11

            Traditional Display............................................................................................................................... 13

            Traditional Video.................................................................................................................................. 14

            Native-Social ......................................................................................................................................... 16

            Messaging ............................................................................................................................................. 18

         Orbiting Factors ....................................................................................................................................... 20

            Google: At a Crossroads ..................................................................................................................... 20

            Call Commerce ..................................................................................................................................... 22

            Ad Blocking: A Blessing in Disguise ................................................................................................... 23

         Conclusion: Follow the Eyeballs… and Footsteps ............................................................................... 24

         About the Author..................................................................................................................................... 25

         About BIA/Kelsey ..................................................................................................................................... 25

         About Industry Watch Reports .............................................................................................................. 26

         Disclosure ............................................................................................................................................ - 26 -

         About Marchex ................................................................................................................................... - 26 -

         Appendix I: Definitions ........................................................................................................................... 27

Copyright © BIA/Kelsey 2017                                                             i
What Is ‘Local’? ..................................................................................................................................... 27

            Are Tablets ‘Mobile’?............................................................................................................................ 27

         Appendix II: Methodology ...................................................................................................................... 28

            Methodology Explained (Video)......................................................................................................... 28

         Appendix III: Additional Multimedia ..................................................................................................... 29

            Mobile Ad Forecast Breakdown ........................................................................................................ 29

            The Future of Search ........................................................................................................................... 29

            BIA/Kelsey Podcast: Google Enters the Home ................................................................................ 29

          FIGURES

         Figure 1 - Location-Targeted Mobile Ad Spend...................................................................................... 2

         Figure 2 - U.S. Smartphone Penetration ................................................................................................. 3

         Figure 3 - Location-Targeted vs. Non-location-Targeted ...................................................................... 4

         Figure 4 - Location-Targeted Ad Spend By Advertiser Type ................................................................. 9

         Figure 5 - U.S. Mobile Ad Spend by Format .......................................................................................... 10

         Figure 6 - U.S. Mobile Ad Spend: Search ............................................................................................... 12

         Figure 7 - U.S. Mobile Ad Spend: Traditional Display .......................................................................... 13

         Figure 8 - U.S. Mobile Ad Spend: Traditional Video ............................................................................. 15

         Figure 9 - U.S. Mobile Ad Spend: Native Social .................................................................................... 17

         Figure 9 - U.S. Mobile Ad Spend: Messaging ........................................................................................ 19

Copyright © BIA/Kelsey 2017                                                           ii
EXECUTIVE SUMMARY
         Twice per year BIA/Kelsey devises a forecast       mobile’s overall U.S. ad spend (local and
         that projects ad spending for location-            non-local), it’s estimated at $33 billion in
         targeted advertising. The five-year outlook        2016, growing to $72 billion by 2020, a 17
         comprises media such as television, radio,         percent compound annual growth rate.
         Yellow Pages, online/interactive and mobile
         — all covered in an extensive slide-based          Zeroing in on the location-targeted portion

         deliverable.                                       of that overall mobile ad spend, it will grow
                                                            from $12 billion in 2016 to $32 billion in
         For the first time in report form, we’re now       2021, a 21 percent CAGR. That translates to
         drilling down on one of those areas: mobile.       38 percent of overall mobile ad revenues
         In addition to inclusion in the cross-media        today, growing to 45 percent by 2020.
         forecast, its growth and complexity compel
         standalone treatment. This report                  Drivers include mobile users’ commercial

         accomplishes that through data and                 intent and advertisers’ evolution to align

         narrative on mobile advertising’s many             with that behavior. There are also

         layers.                                            premiums associated with location-targeted
                                                            ads — a function of their performance and
         The findings: Mobile is the fastest growing        growing demand. And Madison Avenue is
         among all location-targeted media that             latching on to these realities.
         BIA/Kelsey tracks. When panning back to

Copyright © BIA/Kelsey 2017                             1
In addition to segmenting mobile ad spend                       Twitter, Instagram). Their growth follows
         by its locality, BIA/Kelsey breaks it down by                   millennial usage behavior and advertiser
         format. There we see notable trending in                        demand for content marketing.
         revenue share between search, display,
                                                                         These and other findings emerged through
         messaging, video and native-social. Search
                                                                         BIA/Kelsey’s all-year process of collecting,
         has long ruled but is slowly losing share to
                                                                         analyzing and synthesizing forecast inputs.
         emerging formats.
                                                                         The result is a data set that carries an eight-
         Native-social ads are a notable component                       year legacy of time-tested accuracy and
         of this year’s forecast. They’re defined as in-                 commentary on where things are moving
         feed socially targeted advertising in                           next.
         vertically scrolling interfaces (e.g., Facebook,

                                    Figure 1 - Location-Targeted Mobile Ad Spend
                                                            Five-Year Forecast

                         $35                                                                                   $32.4
                                      CAGR 21.1%                                                $28.9
                         $30
                                                                                 $24.8
                         $25
                                                                  $20.7
          US$ Billions

                         $20                        $16.0
                         $15       $12.4
                         $10
                         $5
                         $0
                                    2016             2017         2018           2019           2020           2021
                               Note: Numbers are rounded.

                                                                                                Source: BIA/Kelsey, 2017

Copyright © BIA/Kelsey 2017                                         2
MOBILE: THE VIEW FROM SPACE
         Before this report splinters into many                 mobile culture that spends a growing share
         directions that represent all sides of mobile          of time looking down at the glow of mobile
         advertising, what does the whole pie look              games, messaging and social media.
         like? In the U.S. mobile advertising revenues
         total $33 billion in 2016, growing to $72              Google likewise reports that more than half

         billion by 2020, a 17 percent compound                 of search queries now happen on mobile

         annual growth rate.                                    devices. This is notable as search is usually a
                                                                good indicator of consumer behavior and
         There are several factors driving this                 intent. And Kleiner Perkins reports that
         growth, but it mostly starts with usage.               mobile now makes up 25 percent of users’
         Smartphones represent 79 percent of                    time with media.
         mobile phones in the U.S. This has bred a

                                    Figure 2 - U.S. Smartphone Penetration
                                                  Five-year forecast

                                     Smartphones                     Non-smartphones
                     300
                                                                       25            15             8
                                           46            36
                              56
                     200
          Millions

                                                                       254          267           275
                                          223            239
                     100      207

                      0
                              2016        2017           2018         2019          2020          2021

                                                                                      Source: BIA/Kelsey, 2017

Copyright © BIA/Kelsey 2017                                3
Location, Location, Location

         Within U.S. mobile ad revenues, BIA/Kelsey                  content to trigger local offline conversions.
         segments location-targeted ad spending as                   More details are in the appendix.
         a centerpiece of its forecast. Today that
                                                                     It’s also important to note that location-
         segment represents $12 billion, growing to
                                                                     targeted ads include advertisers of all sizes.
         $32 billion by 2021. That translates to 38
                                                                     Often terms like local imply in-market small
         percent of mobile ad revenues today,
                                                                     businesses. BIA/Kelsey’s forecast conversely
         growing to 45 percent by 2021.
                                                                     includes large and small businesses: The
         A few important questions arise from these                  defining factor is localization of the
         figures, most of all, what do we mean by                    campaign, not of the advertiser.
         location-targeted ads? They’re defined as
                                                                     Beyond the what, another important
         ads that are targeted based on a user’s
                                                                     question that arises from these figures is the
         location or include proximity-relevant
                                                                     why.

                               Figure 3 - Location-Targeted vs. Non-location-Targeted
                                               Smartphones versus non-smartphones

                                            Non-location Targeted               Location Targeted
                         $80                                                                            $72.1
                                                                                         $65.2
                                                                            $57.3                       $32.4
                         $60              38%                $48.7                       $28.9                       45%
          US$ Billions

                                                   $40.2                    $24.8
                         $40      $32.6                      $20.7
                                                   $16.0
                                  $12.4
                         $20                                                             $36.3          $39.6
                                                             $28.0          $32.4
                                  $20.2            $24.2
                          $0
                                  2016             2017      2018           2019         2020           2021
                                Note: Numbers are rounded.

                                                                                            Source: BIA/Kelsey, 2017

Copyright © BIA/Kelsey 2017                                     4
Why Local?

         One of the biggest mobile success factors           ads that drive localized conversions. These
         BIA/Kelsey observes is native thinking:             can include call or map buttons.
         building content, apps and ads that fit the
         device’s unique form factor, rather than            That higher performance creates

         porting formats from legacy media.                  premiums for location-relevant ads.

         Nowhere does this principle apply more              Premium ad rates in turn boost the value

         than location targeting.                            (and cost) of location-targeted ads and thus
                                                             advertiser spend levels. That spending is
         The smartphone’s location-tracking abilities        reinforced over time through a feedback
         and portability, combined with users’               loop of advertisers’ return on investment.
         transitory behavior, make location-targeted
         content a natural fit. Google in fact reports       ROI reporting meanwhile continues to

         that 30 percent of searches have explicit           receive attention in the mobile ad world.

         local intent, while 76 percent of those             It’s a direct function of ad attribution,

         result in a store visit within a day.               measured through things like clicks, calls
                                                             and store visits. And here the magic is in
         This local intent drives mobile ad                  connecting the dots between mobile and
         performance when campaigns effectively              offline conversions — the essence of local.
         cater to it. For example, successful mobile
         search ads often utilize local extensions —
         imbedded call-to-action buttons in search

Copyright © BIA/Kelsey 2017                              5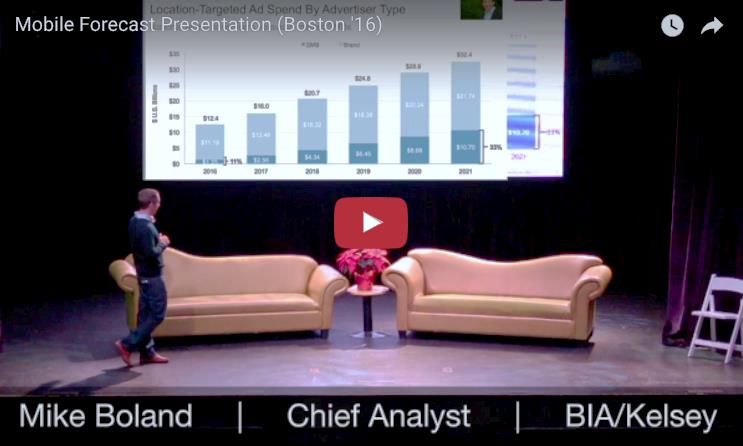
Local = Offline

         Despite ample coverage in mainstream and               This happens through localized ad
         tech press, e-commerce only totals seven               components offered by innovators like xAd
         percent of U.S. retail spending. The rest —            and networks such as Google and
         about $3.7 trillion per year — happens                 Facebook. It includes call-to-action buttons
         offline in physical stores. If you add local           that let consumers book, reserve, buy, map
         services, total offline consumer spending is           or call2, right from within an ad unit. And it
         about $7 trillion per year.1                           involves tracking resulting conversions.

         This isn’t meant to diminish the impact of             For example, Google enhanced its mobile
         online and mobile consumer engagement.                 ad choices this year with a set of features
         Although all these transactions are                    for advertisers to more effectively measure
         consummated in bricks-and-mortar venues,               offline conversions. Its Promoted Pins
         they are increasingly influenced through               meanwhile offer a form of search
         digital means, such as search or local                 advertising that graphically places local
         discovery apps like YP and Yelp.                       brands within the Google Maps app.

         The path to purchase — where attention,                Facebook has also grown quickly as a local
         presence and marketing strategies should               advertising channel, using action buttons
         focus — resides in this progression from               that let advertisers plant transactional
         online engagement to offline conversion                capability in front of users. This includes
         (O2O). BIA/Kelsey pegs O2O spending at                 buttons that enable users to easily call,
         roughly $4 trillion, while the mobile                  navigate, book or buy from nearby
         segment of that spend is just over $2                  businesses (explored further below).
         trillion.
                                                                BIA/Kelsey believes these offerings from
         That $2 trillion isn’t ad spend but rather the         Google, Facebook and others will drive
         value of consumer transactions that are                localized ad spend. Immediate and tangible
         influenced through mobile. Given that                  conversions will combine with well-
         figure’s size relative to the $300 billion in e-       performing ads to reinforce Madison
         commerce spending, advertisers have more               Avenue’s mobile local ad spending and
         to gain by optimizing ad campaigns to drive            adoption.
         offline conversions.

         1                                                      2
             See BIA/Kelsey’s breakdown of U.S. consumer            See BIA/Kelsey report: Call Commerce: A $1 Trillion
         spending here.                                         Economic Engine

Copyright © BIA/Kelsey 2017                                 6
Audience Targeting

         When examining the different flavors of             places I visited. That data can then be
         mobile ad targeting driving the sector’s            triangulated to predict where I might go
         growth, an emerging tactic involves what is         next and thus what ads or messaging I
         known as audience targeting. This is the art        might be most receptive to.
         of using location data to build consumer
                                                             A recent ThinkNear and IPG Media Lab
         profiles, which are then used as ongoing ad
                                                             report showed audience targeting boosted
         targeting triggers.
                                                             local foot traffic by 29 percent over non-
         This shifts the rhetoric and traditional            audience targeted benchmarks. The cost
         thinking around location. Rather than use a         per incremental store visit was also cheaper
         mobile location signal to deliver a                 at $1.06, compared with $6.39 for non-
         geographically relevant ad (e.g., nearby            audience targeted ads.
         restaurant), location is beginning to be seen
                                                             Audience targeting’s benefits also include
         as a longer-term tool to measure and create
                                                             receptiveness among brand advertisers.
         a multidimensional mosaic of consumer
                                                             Audience targeting speaks their language:
         intent.
                                                             They’ve done demographic targeting for
         More specifically, audience targeting               years. Mobile location-based audience
         profiles users based on patterns of where           targeting is just a more evolved form of that
         they go (think: soccer mom, business                longstanding practice.
         traveler, student, etc.). The data are then
                                                             Several technology companies develop
         used for predictive modeling for future
                                                             versions of audience targeting, including
         behavior, and thus what contextual ad
                                                             Foursquare, xAd, Placed and PlaceIQ. It not
         targeting and messaging will resonate most.
                                                             only creates a more multidimensional set of
         In other words, rather than send me an ad           targeting parameters, but it can alleviate
         based on where I’m standing now, location           location targeting’s biggest challenge:
         tracking can be used to see the last 50             accuracy.

Copyright © BIA/Kelsey 2017                              7
The ‘10% Problem’
Location tracking is challenged by an BIA/Kelsey has meanwhile estimated that
accuracy problem. Users’ GPS data aren’t less than 10 percent of location readings
always accessible, unless they’ve opted in to are accurate down to the meter level
share it at the app level. So when that (involving GPS). This gets back to audience
location precision isn’t available, some ad targeting: Its benefit involves having
networks will revert to more blunt tactics additional relevance triggers for the
such as reverse IP lookup. majority of time when location data are
unreliable.
This has created an industry outcry for
more responsible ad targeting practices. Put another way: If you only have 10
Among the most vocal in this reformist percent of the time to accurately track
activity are xAd, Foursquare and ThinkNear. location, utilize that limited time to develop
Responsible practices they espouse include location-driven audience profiles. Then you
vetting location signals more carefully and can use that profiling data during the other
discarding unreliable readings. 90 percent of the time, regardless of where
someone is.
Copyright © BIA/Kelsey 2017 8National-to-Local
As mentioned, localized mobile ad spending In fact SMBs’ share of the localized mobile
includes national brand advertisers as well ad spend will grow to match its share of the
as in-market small businesses. The former overall local media ad pie. Specifically, SMB
currently account for the majority of spending now accounts for about 36
localized mobile ad spending. This is due to percent of local advertising. But in mobile —
the segment’s tendency to adopt newer due to its younger status — SMB spending
technologies faster than SMBs. is only 10 percent.
However, BIA/Kelsey believes SMBs’ share Over the next five years, as mobile
of mobile local ad spending will grow in the advertising itself matures, SMBs’ mobile
coming years. This will happen through local ad spending share will approach that
continued innovation around self-serve 36 percent to match its overall local ad
offerings like Facebook, as well as direct spending share. But in the meantime, the
selling and bundling from local media majority of localized mobile ad spending is
companies like YP. still coming from national brands.
Figure 4 - Location-Targeted Ad Spend By Advertiser Type
National brand advertisers versus in-market SMBs
SMB Brand
$40
$30
$ U.S. Billions
$20 $21.74
$20.24
$18.38
$16.32
$10 $13.46
$11.19 $10.70
$6.45 $8.68
$0 $1.25 $2.56 $4.34
2016 2017 2018 2019 2020 2021
Source: BIA/Kelsey, 2017
Copyright © BIA/Kelsey 2017 9FORMATS
There are several breakdowns in Figure 5 - U.S. Mobile Ad Spend
BIA/Kelsey’s mobile advertising forecast. by Format
So far, we’ve covered the overall mobile
ad pie, and also how that breaks down Traditional Display Search
Messaging Traditional Video
between localized and non-localized ad
Native/Social
revenues. But another important
US $Millions
segmentation is to break down ad
$80,000
revenue by format. $72,071
There we see mobile ad formats like $70,000 $65,193
search, display, video, messaging and $57,260
$60,000
native-social advertising – each defined
in the coming sections. Because they $48,677
$50,000
are bought and sold in various ways, $40,175
different formulas and models apply to $40,000
the composition and financial modeling $32,642
of each. $30,000
In short, search advertising currently holds $20,000
the largest share, followed by display and
native social ads. Search will continue to $10,000
eclipse all ad formats and hold the largest
$0
share, but native-social is growing the
2016 2017 2018 2019 2020 2021
fastest. The following sections examine the
Note: Numbers are rounded.
dynamics and outlook for each.3
Source: BIA/Kelsey, 2017
3
BIA/Kelsey’s breakdown of mobile ad formats
happens within overall mobile ad spending, as well as
within the localized portion. This section examines the
former, though the latter is available upon request.
Copyright © BIA/Kelsey 2017 10Search
Search advertising is the leading mobile ad As explored in some of the Google data
format. It derived $14 billion in 2016, cited earlier, mobile search usage carries a
growing to $23 billion in 2021. That high degree of “lean forward” commercial
translates to 44 percent of the total ad pie intent. This has made it an attractive venue
currently, shifting to 32 percent in 2021. The to incorporate advertising, which in turn
share reduction results from the growth of shows strong performance metrics like
native-social advertising, explored below. clicks, calls and transactions.
Search has held the crown for market share For example, mobile search click through
among mobile ad formats throughout the rates (CTR) are 3 percent on average,
smartphone age. And it continues to indicate compared with mobile display ad CTRs that
a strong position in the foreseeable future, average 0.4 percent. These performance
though some factors threaten it. Much of its metrics keep improving as Google offers
strength comes from high-intent usage. advertising tools to capture user intent,
such as Product Listing Ads.
Copyright © BIA/Kelsey 2017 11Google’s data meanwhile continue to boost These influences join mobile search volume,
ad utility such as nearby product inventory. ad coverage and other factors to derive
And voice search is on the rise, opening up search ad revenues. Though most mobile
ad inventory with it. This will progress as search happens on Google, it’s important to
Google improves speech to text processing note that this forecast includes in-app
and releases products like Google Assistant, search such as Yelp and YP, as well as pay-
Home and Allo. per-call advertising (explored below).
Figure 6 - U.S. Mobile Ad Spend: Search
Traditional Display Search Messaging
Traditional Video Native/Social
$80,000
$72,071
$70,000 $65,193
$60,000 $57,260 $24,163
$48,677 $21,975
$50,000 $19,913
US$ Millions
$40,175 $7,168
$16,848
$40,000 $6,576 $4,498
$32,642 $13,370 $5,758 $2,999
$30,000 $10,165 $4,895 $1,874
$3,876 $1,103
$2,816 $630 $21,306 $23,358
$20,000 $350 $19,542
$17,625
$15,798
$14,212
$10,000
$10,173 $12,338 $12,885
$5,099 $6,501 $8,206
$0
2016 2017 2018 2019 2020 2021
Note: Numbers are rounded.
Source: BIA/Kelsey, 2017
Copyright © BIA/Kelsey 2017 12Traditional Display
Traditional display advertising is the third results from habit, as many participants of
largest mobile ad format. It’s currently $5.1 the digital ad ecosystem have gotten
billion, growing to $12.9 billion by 2021. comfortable with it. But it’s mostly left over
That translates to 16 percent of the total ad from the desktop era of online ads.
pie in 2016 shifting to 18 percent in 2021.
As with search, many factors threaten
Flat share growth is due to many factors,
traditional display. These include the rise of
including the format’s maturity.
a better-performing native-social ad format
Traditional display is defined mostly by (explored below), ad blockers (also explored
banner ads that appear in mobile apps and below) and millennial distrust of traditional
web. The format’s spending primarily forms of advertising.
Figure 7 - U.S. Mobile Ad Spend: Traditional Display
Traditional Display Search Messaging
Traditional Video Native/Social
$80,000
$72,071
$70,000 $65,193
$57,260
$60,000 $24,163
$48,677 $21,975
US$ Millions
$50,000 $19,913
$40,175 $7,168
$40,000 $16,848 $6,576
$32,642 $13,370 $4,498
$5,758 $2,999
$30,000 $10,165 $4,895 $1,874
$3,876 $1,103
$2,816 $630 $21,306 $23,358
$20,000 $350 $19,542
$17,625
$14,212 $15,798
$10,000
$8,206 $10,173 $12,338 $12,885
$5,099 $6,501
$0
2016 2017 2018 2019 2020 2021
Note: Numbers are rounded.
Source: BIA/Kelsey, 2017
Copyright © BIA/Kelsey 2017 13Traditional Video
Video ads possess many of the same Mobile traditional video ads currently
dynamics and drivers as display ads. In fact generate $2.8 billion, which we project to
many digital ad market forecasts lump them grow to $7.2 billion by 2021. That translates
together. BIA/Kelsey separates video and to 8.6 percent of mobile advertising in 2016
further delineates traditional video as shifting to 5.7 percent. Most of these
separate from video that appears in native- revenues go to YouTube, as it has taken a
social formats (explored below). leading position in mobile video
consumption.
Traditional video includes in-stream pre-roll
ads on video apps and sites like YouTube. It BIA/Kelsey estimates YouTube’s video ad
does not include natively produced and revenues at almost $13 billion. About half
placed in-feed video in social media, such as that is mobile and 30 percent is U.S., making
Facebook and Snapchat. Videos in the latter mobile U.S. revenues about $2 billion. With
category are measured separately under a 75 percent market share, that supports
native-social. BIA/Kelsey’s $2.8 billion projection for
traditional video advertising.
Copyright © BIA/Kelsey 2017 14But the question often arises: Why doesn’t And as with display and search, this
video have a larger share? Reasons include category’s growth will be mitigated by shifts
viewing time on small screens, as well as the to native-social advertising. The latter is
medium’s propensity toward short-form becoming popular for video consumption,
content, which limits ad inventory. Pre-roll such as Snapchat Stories. The bottom line is
ads are also seen as obtrusive within such that video will grow in mobile but mostly
short mobile video clips. outside the traditional (pre-roll) format.
Figure 8 - U.S. Mobile Ad Spend: Traditional Video
Traditional Display Search Messaging
Traditional Video Native/Social
$80,000
$72,071
$70,000 $65,193
$60,000 $57,260
$24,163
US$ Millions
$48,677 $21,975
$50,000 $19,913
$40,175 $7,168
$16,848 $6,576
$40,000 $4,498
$32,642 $13,370 $5,758 $2,999
$30,000 $10,165 $4,895 $1,874
$3,876 $1,103
$2,816 $630 $21,306 $23,358
$20,000 $350 $19,542
$17,625
$15,798
$10,000 $14,212
$10,173 $12,338 $12,885
$5,099 $6,501 $8,206
$0
2016 2017 2018 2019 2020 2021
Note: Numbers are rounded.
Source: BIA/Kelsey, 2017
Copyright © BIA/Kelsey 2017 15Native-Social
Native-social advertising has been within the few apps built on that
referenced throughout this report, so what framework. These include Facebook,
is it exactly? It is defined as graphical, Twitter, Instagram, LinkedIn and a few
multimedia and textual content that is others.
merged into the organic feed-based
Now that we’ve covered the what, the
interfaces of mobile social apps. The most
question is, how much? Native-social is the
prevalent example is Facebook News Feed
fastest growing mobile ad format, deriving
Ads.
$10.2 billion in 2016 and growing to $24.2
In addition to their format and orientation, billion in 2021. That translates to 31 percent
native-social ads are defined by how they’re of the total ad pie currently, shifting to 34
targeted. They’re placed based on targeting percent in 2021.
parameters such as granular signals within
This growth stems from the format’s
the social graph. That includes past
advantages, high performance and resulting
behavior (e.g., Facebook likes) and social
demand. These advantages come from a
connections to people and groups.
principle introduced earlier (and baked right
In that sense, native-social should not be into the format’s name): native. The format
confused with traditional display ads that aligns with mobile device realities and the
happen to be placed near social content. way content is consumed today.
For example, a banner ad that is seen within
For example, sub-six-inch screens favor in-
a dating app, event calendar app or
feed units over banners. In other words,
anything else construed to be “social” is
mobile screens lack screen real estate for
counted under “traditional display.”
traditional top and side banner ads that
Native-social ads are conversely defined by ruled the desktop web. A vertically scrolling
their format. And native is the operative feed (a la news feed) conversely holds
word. They merge with the vertical feed of greater capacity for ad inventory.
time-based and social-oriented content
Copyright © BIA/Kelsey 2017 16Beyond quantity, there’s quality: Native- million SMB pages, 4 million of which pay
social ads resonate with millennials, who for news feed ads — more paying SMBs
are famously averse to traditional than any other platform.
advertising and didactic ad messaging.
Native-social’s subtlety appeals to the This is driven by the ease of campaign
generation, whose buying empowerment management and growing suite of action
makes its tastes a critical factor. buttons on Facebook pages and ads (e.g.,
buy, book, call). Multimedia is also a draw,
On the buy side, native-social advertising including increasingly popular and well-
has likewise resonated. This is seen in the performing auto-start/stop video in
brand world’s Snapchat obsession and Facebook and Instagram vertical feeds.
SMBs’ Facebook adoption. Facebook has 50
Figure 9 - U.S. Mobile Ad Spend: Native Social
Traditional Display Search Messaging
Traditional Video Native/Social
$80,000 $72,071
$70,000 $65,193
$57,260
US$ Millions
$60,000 $24,163
$48,677 $21,975
$50,000 $19,913
$40,175 $7,168
$40,000 $16,848 $6,576
$32,642 $13,370 $5,758 $4,498
$4,895 $2,999
$30,000 $10,165 $3,876 $1,874
$2,816 $630 $1,103 $21,306 $23,358
$20,000 $350 $19,542
$15,798 $17,625
$10,000 $14,212
$8,206 $10,173 $12,338 $12,885
$0 $5,099 $6,501
2016 2017 2018 2019 2020 2021
Note: Numbers are rounded.
Source: BIA/Kelsey, 2017
Copyright © BIA/Kelsey 2017 17Messaging
Another notable trend in this round of This brings us to the emerging area of
mobile forecasting is the inflection point for conversational commerce: transactional
messaging. activity that happens within messaging
interfaces, such as customers messaging
Previously designated as SMS, the category businesses to ask simple questions. This will
was in decline due to the smartphone era’s also spawn a fair amount of advertising to
tendency toward apps. This caused clear lead consumers to transact.
drops in advertiser interest in SMS as a
channel. Messaging not only replaces the previous
SMS category, but it has new growth
However, a new classification — known in calculations due to its now-broader reach.
this forecast as messaging — includes Specifically it will derive $350 million in
rapidly growing messaging apps such as 2016, growing to $4.5 billion in 2021. That
Facebook Messenger, which has more than translates to 1.1 percent of the total ad pie
1 billion global users. Beyond raw usage, currently, shifting to 6.2 percent in 2021.
there is native transactional functionality
developing within these apps.
Copyright © BIA/Kelsey 2017 18Much of this will be driven by Facebook Other leading indicators for conversational
Messenger. As mentioned, it has a billion commerce’s growth include its use
users and has already begun to integrate overseas. WeChat in China and WhatsApp in
transactional tools. Payments within Europe are both already used heavily as
Messenger are also a big initiative for ways for consumers to converse and
Facebook, which will lay an important transact with local businesses. The trend
foundation for conversational commerce. could spread west.
Figure 10 - U.S. Mobile Ad Spend: Messaging
Traditional Display Search Messaging
Traditional Video Native/Social
$80,000
$72,071
$70,000 $65,193
$60,000 $57,260
$24,163
$48,677 $21,975
US$ Millions
$50,000 $19,913
$40,175 $7,168
$16,848 $6,576
$40,000 $4,498
$32,642 $13,370 $5,758 $2,999
$30,000 $10,165 $4,895 $1,874
$3,876 $1,103
$2,816 $630 $21,306 $23,358
$20,000 $350 $19,542
$17,625
$15,798
$10,000 $14,212
$10,173 $12,338 $12,885
$5,099 $6,501 $8,206
$0
2016 2017 2018 2019 2020 2021
Note: Numbers are rounded.
Source: BIA/Kelsey, 2017
Copyright © BIA/Kelsey 2017 19ORBITING FACTORS
Google: At a Crossroads
As explored earlier, search is the leading With so much to lose, Google is most
mobile ad format in revenues. However, it affected by continued migration to
will lose share to emerging formats like smartphones. In fact, one of the biggest
native-social. This is due to a key usage challenges facing Google today is carrying
trend: In an app-based world — versus a its dominance into a new environment with
browser-centric one, a la desktop — search different entry points to digital content. It’s
is no longer the primary front door. a classic innovator’s dilemma.
This trend’s significance is highlighted by Google is avoiding this common trap,
search’s longstanding dominance. It has however. In many ways it’s embracing the
been the gatekeeper to the web for the past formats that threaten search most. This can
decade. And that dominance has been be seen in several app-centric
lucrative, especially for market share leader announcements over the past year,
Google, which derives roughly $50 billion including Google Assistant, Home, Allo and
annually from search advertising. Keyboard.
Copyright © BIA/Kelsey 2017 20These additions all have a common theme Google is well positioned for this battle
in Google’s construct of “micro-moments,” because it will be won on data. Google has
the hundreds of daily moments when users the most robust data from its search index
look at their phones for information. Google and knowledge graph. This will provide a
believes that if it can capture users during key advantage against Apple and Amazon
these moments, it will counterbalance its whose strengths lie in places other than “all
search volume declines. the world’s information.”
This translates to predictively sending users The theme that underlies all of the above is
information (push) rather than waiting for reducing friction between you and Google-
them to search (pull). To do that, Google delivered information. This includes the iOS
must become a more robust artificial keyboard that literally places Google at your
intelligence tool. This is what Siri and fingertips. Google is also planting itself
Amazon Alexa are trying to do and will be a within the home in a first-ever hardware
key battleground in the coming years. product, Google Home.
Copyright © BIA/Kelsey 2017 21Call Commerce
One of the most important and under- This relates to the broader topic of
recognized areas of the media and attribution, the holy grail of local commerce.
advertising worlds is what BIA/Kelsey refers Call commerce leaders are designing ways
to as call commerce. Formerly known as call to use a phone number or mobile device as
monetization, it involves driving, tracking an identifier — much like Facebook uses
and optimizing inbound phone calls as a social identity — linked to offline conversion
form of business leads. data such as credit card information.
Call commerce is mentioned here because These analytics have in fact uncovered
it’s a component of the ad revenues phone calls’ impact on consumer spending.
examined above. In fact it represents a BIA/Kelsey estimates that phone calls
growing part of the ad revenues within each influence $1 trillion in U.S. spending at
of the formats and delivery channels some stage of the path to purchase. This
explored in the above sections. It’s most value partly derives from calls’ prevalence in
prevalent in search but growing elsewhere. high-value product categories.
BIA/Kelsey pegs global click-to-call spending Call commerce will continue to grow with
at $5.9 billion last year, growing to $13.7 the trend towards actionable content and
billion by 2020. This is from click-to-call measurable results. This includes social
buttons in mobile advertising and doesn’t media where Facebook, Instagram, and
include revenues from call analytics others increasingly include buttons to call
platforms from companies like Marchex, local businesses – an unwavering human
which analyzes calls and their contents. urge, even in a digital era. 4
Google has sunk its teeth into this
opportunity by making click-to-call buttons
a primary component of search results,
both organic and paid. The latter happens
via AdWords extensions, and Google
continues to develop ways to drive, track
and optimize phone calls.
4
See BIA/Kelsey report: Call Commerce: A $1 Trillion
Economic Engine
Copyright © BIA/Kelsey 2017 22Ad Blocking: A Blessing in Disguise
Ad blocking threatens to undermine mobile But one positive effect of ad blockers will be
advertising, but BIA/Kelsey believes this a wake-up call for a lumbering advertising
topic will have less impact than reported in industry to create something better. This is
industry news. It is only applicable to a an area where the tech world has innovated
narrow portion of mobile advertising, such circles around Madison Avenue, including
as in-browser banner ads for users who many of the native-social formats discussed
download and activate ad blockers. in this report.
With iPhones, for example, ads are only In fact most forms of native-social
blocked on the Safari browser (as opposed advertising and content marketing are
to in apps) when the user has downloaded immune to ad blocking, which has
and activated an ad blocker. Due to these motivated many ad networks, agencies and
specific requirements, Swiss investment ad tech players to begin to adopt the
bank UBS reports ad blockers only affect 0.5 format. This is yet another reason
percent of mobile ad revenues. BIA/Kelsey is bullish on native-social
advertising in mobile.
Copyright © BIA/Kelsey 2017 23CONCLUSION: FOLLOW THE EYEBALLS… AND FOOTSTEPS
Smartphone usage patterns have driven Examples include brand experiences created
Madison Avenue’s slow but sure migration in artful photographic styles then strategically
to mobile advertising. Advertiser adoption merged into target users’ Instagram feeds.
has come in many forms, but most
newcomers to mobile advertising have Beyond style and formatting, targeting ads
made the mistake of porting traditional using factors like location, social activity and
media formats to a smaller screen. audience profile are showing strong
performance metrics. And new
This practice parallels the early days of transactional metrics better capture ROI
television, when announcers read compared with traditional ones like clicks
advertising from a sheet of paper while and impressions.
standing in front of the camera. The reason:
This was the way advertising was done in “Click through rate is a bulls--t metric,” said
the previous medium, radio. We see the xAd head of platform Dan Hight at the
same awkward transition to mobile. BIA/Kelsey BRANDS conference in March.
“Traditionally, that’s what agencies look at.
This is why we see tiny banner ads that But now it’s about a place in the real world:
clutter our mobile apps or 30-second spots How do you get people to my store, and
built for television ham-handedly slapped in how to measure that?”
front of a 90-second mobile video. But as
we approach 2017, the smartphone era’s The answer is to go “beyond the click.” As
10th year, there’s a palpable movement BIA/Kelsey has argued since 20095, the true
toward native formats. mobile play is to drive measurable results to
local businesses. That means content that
By native we mean formats that are built captures their interest; and ad features –
“mobile first” or “mobile only” instead of navigation, voice calls and bookings – that
being ported from other formats as capture their actions.
characterized throughout this report.
5
See article: “Not to dismiss clicks and impressions, but …”
Copyright © BIA/Kelsey 2017 24ABOUT THE AUTHOR ABOUT BIA/KELSEY
BIA/Kelsey is a market research and analyst
firm that focuses on all things local. Local
Mike Boland
media is an increasingly dynamic area of ad
Chief Analyst, VP of Content
spending and is quickly evolving with
BIA/Kelsey
emerging digital platforms like mobile,
social and search.
Mike was one of Silicon Valley’s first tech
writers of the Internet age as a staff
Over the past three decades, BIA/Kelsey has
reporter for Forbes, starting in 2000. Now a
been an authority on these developing
leading industry analyst, he is a frequent
technologies as well as their forbearers in
speaker at top industry conferences such as
traditional media, which continue to
BIA/Kelsey events, ad:tech and LeadsCon.
transform as they likewise compete for local
ad dollars and consumer affinity.
He authors defining reports and revenue
forecasts on the changing tech and media
Through a suite of products that include
landscape; he contributes to highly read
research reports, data, conferences and
news sources such as Business Insider and
client consulting, BIA/Kelsey analyzes the
The Huffington Post; and his quotes and
financial, social and technology trends
comments appear in The Wall Street
affecting local media.
Journal, Fortune and The New York Times.
Readers, event attendees and clients
After 15 years in professional writing and
receive the inside track on data, analysis
content production, Mike runs BIA/Kelsey’s
and tactics needed to grow and transform
publishing strategy, including reports,
in rapidly evolving tech and media
multimedia, blog and newsletter.
landscapes.
If you’re interested in learning more, please
contact mgiannini@biakelsey.com.
Copyright © BIA/Kelsey 2017 25ABOUT INDUSTRY WATCH REPORTS
BIA/Kelsey’s Industry Watch series for companies to underwrite distribution.
examines key trends and opportunities in This includes industry players that wish to
tech and media sectors. Applying its bring reports out from the paywall,
analytical and editorial eye, BIA/Kelsey thereby amplifying the marketplace’s
selects topics based on the criteria of access to, and awareness of, a given topic.
industry growth, disruption, opportunity or
Underwriters get brand benefit in being
notable lessons.
associated with the free and open
These reports join BIA/Kelsey’s editorial distribution of an industry report.
calendar, with the additional opportunity
DISCLOSURE
Marchex has underwritten the distribution of this report. BIA/Kelsey maintains editorial
independence throughout all stages of production. Report contents are not co-produced or
influenced by underwriters, though they can provide source material and data on which
analysts build narrative at their full discretion.
ABOUT MARCHEX
Seattle-based Marchex is a mobile advertising analytics company that connects online behavior
to real-world, offline actions. It works with brands and agencies worldwide in communications,
auto, financial services, home services, travel, education, health and local/professional services.
Some of its clients include Time Warner Cable, ADT, CDK Global, T-Mobile, WPP and
Bridgestone.
Copyright © BIA/Kelsey 2017 26APPENDIX I: DEFINITIONS
What Is ‘Local’? Are Tablets ‘Mobile’?
The term local often has many For the past few years, a debate has raged
connotations, which has bred confusion in throughout tech and media circles: Are
the field of location-based advertising. For tablets mobile devices?
example, it is often synonymous with mom-
and-pop small businesses, even though the This depends on whom you ask; you’ll get
category truly expands far beyond that different answers from a CMO and a CTO.
relatively narrow scope. For BIA/Kelsey analysis — covering content
delivery and advertising media — we’ve
BIA/Kelsey’s mobile forecast is grounded in taken a stance that tablets should not be
a methodology that includes many different lumped in with mobile. Google and many
modes of local. At its core, location-targeted others share the sentiment.
mobile advertising is based on a user’s
location (i.e., geotargeting) or includes All of the reasons and supporting evidence
proximity-relevant content to trigger local can be found in a published article by this
offline conversions. report’s author, which can be read here.
Location-targeted mobile advertising also
notably includes large national advertisers,
SMBs and mid-range businesses that are in-
market (e.g., regional car dealership group).
Location-specific ad copy or calls to action
(e.g., call local store) will also classify a given
ad as location targeted.
As explained above, audience targeting is an
emerging form of location data, which uses
historical (not current) location as a
targeting trigger. This is included in
BIA/Kelsey’s location-targeted ad figures.
Further explanation can be found in the
video presentation below.
Copyright © BIA/Kelsey 2017 27APPENDIX II: METHODOLOGY
BIA/Kelsey refreshes its forecast twice per
year. Because the mobile ad market is
evolving so quickly, it requires constant
upkeep and awareness of market events. So
in addition to a rigorous formulation
process before a forecast release, data are
collected perpetually throughout the year.
This process of collecting and indexing key
forecast inputs merges with BIA/Kelsey
analyst day-to-day market coverage and
executive interviews. Analysts have made a
science of tagging and indexing key market
events throughout the year, to be used in
the biannual forecast process.
This culminates in a workbook that has
thousands of active cells. It is a “top-down”
forecasting methodology that quantifies
usage metrics, ad coverage, ad rates and
other such figures. That is then vetted
against a “bottom-up” approach that
aggregates individual company revenues.
Further explanation can be seen in the
video below. Methodology Explained (Video)
Click to play
Copyright © BIA/Kelsey 2017 28APPENDIX III: ADDITIONAL MULTIMEDIA
Mobile Ad Forecast Breakdown
The Future of Search
BIA/Kelsey Podcast: Google Enters the Home
Copyright © BIA/Kelsey 2017 29You can also read