Getting to Know Science Tweeters: A Pilot Analysis of South African Twitter Users Tweeting about Research Articles - Journal of Altmetrics
←
→
Page content transcription
If your browser does not render page correctly, please read the page content below
Joubert, M., & Costas, R. (2019). Getting to Know Science Tweeters: A Pilot
                                                       Analysis of South African Twitter Users Tweeting about Research Articles.
                                                       Journal of Altmetrics, 2(1): 2. DOI: https://doi.org/10.29024/joa.8

ORIGINAL RESEARCH

Getting to Know Science Tweeters: A Pilot Analysis of
South African Twitter Users Tweeting about Research
Articles
Marina Joubert1 and Rodrigo Costas1, 2
1
    Stellenbosch University, ZA
2
    Leiden University, NL
Corresponding author: Marina Joubert (marinajoubert@sun.ac.za)

Against the backdrop of the increasing relevance of social media in public science communication and
engagement, this study aimed to expand our understanding of the relationships and interactions between
social media users and scientific outputs. In order to do so, we explored the identities, characteristics
and activities of South African science tweeters (or ZA science tweeters)—i.e. Twitter users in South
Africa who tweet about research articles. The growing number of ZA science tweeters, both overall and
in relative terms, suggests that Twitter users are increasingly using this social media platform as a tool
to share and discuss scientific outputs. ZA science tweeters are actively contributing to the sharing
of information about new research articles, but, in line with global trends, the bulk of science tweets
amongst South African Twitter users comes from a small number of active tweeters, and only 1% of
ZA science tweeters had more than 20,000 followers. About 6.6% of ZA science tweeters are scholars
(or researchers) themselves. Compared to science tweeters who are not scholars, the scholar-tweeters
sent out tweets about research articles more frequently, are active on Twitter over longer periods of
time, publish more original tweets and use hashtags more frequently to increase their engagement on
Twitter. In their Twitter bios, these scholars typically use academic terms to describe themselves, thereby
presenting themselves as experts on this social media platform. Astronomy, astrophysics, ecology and the
environment emerge as the research topics that are most popular amongst ZA science tweeters.

Keywords: Twitter; science communication; science tweeters; science and society; social media metrics
of science; altmetrics; social media studies of science

Introduction
In today’s dynamic science communication landscape, social media tools are proliferating and escalating in popularity,
and are increasingly interwoven with traditional communication platforms, both inside and outside of science (Allgaier
et al. 2013; Su et al. 2017). These global trends in the science communication ecosystem are equally evident in South
Africa (Van Rooyen 2017). As a result, the barriers between scholars, professional communicators and audiences
are disappearing (Peters et al. 2014). Thereby, the way that scholars communicate within and outside the scientific
community is transforming rapidly (Birch 2011; Bik & Goldstein 2013). Scholars expect that, over time, digital media
and social media networks will fundamentally transform the relationships between science and society, and ultimately
transform even science itself (Fausto et al. 2012; Peters et al. 2014).
   Given the evidence that people are increasingly going online to find and share information about science, there
is reason for scholars and research organisations to rethink how they interact with the public (Anderson, Brossard &
Scheufele 2010; Brossard 2013; Brossard & Scheufele 2013). In particular, scholars have been urged to consider how
they could use social media tools more effectively to engage with each other, as well as with external communities (Su
et al. 2017; Van Eperen & Marincola 2011).
   At the same time, social media metrics of scientific publications (or more popularly, ‘altmetrics’) offer innovative tools
for scholars to explore public engagement with science in the online sphere. As a result, new possibilities for analysing
the interactions between scholarly entities (e.g. scholars, universities and other research organisations), their scholarly
products (e.g. research articles, datasets, etc.) and a large diversity of social media users are emerging (Costas 2017;
Robinson-Garcia et al. 2014).
   Using data from Altmetric.com and the Web of Science® (WoS), this paper explores how Twitter users in South Africa
interact with research outputs (mainly research articles). We create a picture of the size, identities and activities of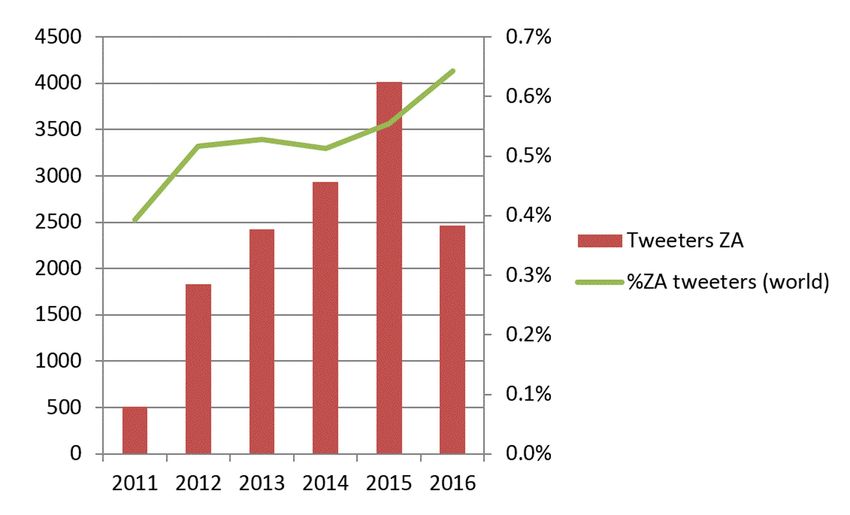
Art. 2, page 2 of 14                                                      Joubert and Costas: Getting to Know Science Tweeters

Twitter users in the country who are tweeting about research articles. We also identify the most popular research topics
that these people are tweeting about.
   In the light of recent scholarly interest in how individual researchers, research institutions and large science projects
in South Africa use social media for public science communication and engagement (Gastrow 2015; Joubert 2018; Van
Rooyen 2017; Onyancha 2015), it becomes relevant to study the engagement of local scholars via social media more
quantitatively. As such, this pilot study presents the first description, analysis and characterisation of South African
Twitter users that tweet about scholarly outputs, thereby providing a new perspective on the relationship between
science and social media use in the country. Our results offer a fresh analytical perspective on the use of Twitter as a
platform for promoting and discussing new research. It also provides the first indication of the nature and activities of
Twitter users in South Africa in terms of tweeting about research outputs, along with providing an international com-
parison with other countries worldwide. This study confirms the potential of altmetric data as a tool to explore interac-
tions between social media users and scholarly outputs.

The Pros and Cons of Social Media Tools in Science Communication
While social media tools offer a range of communication opportunities and benefits, these new media platforms also
raise concerns. In the absence of journalistic gatekeepers, information and opinions (including trivialities, false infor-
mation and reputation-damaging statements) can spread rapidly (Dudo 2015; German National Academy of Sciences
2017; Mandavilli 2011) with the potential to harm the credibility and image of science and scholars. Researchers high-
light several apprehensions about how social media, and in particular Twitter, may be dominated by spam bots, paid
content promoters, and almost-mechanical re-tweeting when it comes to the sharing of research articles (Haustein et
al. 2016; Robinson-Garcia et al. 2017).
   On the plus side, social media tools offer possibilities of unprecedented reach that can make new research widely
visible and accessible, and help to engage previously inaccessible audiences (Anderson 2017; Casini & Neresini 2012;
German National Academy of Sciences 2017; Montgomery 2009). Its interactive nature enables dialogue and allows
non-experts to join public conversations about science (Bucchi & Trench 2014; Peters et al. 2014). Importantly, social
media tools allow researchers to become pro-active about sharing their science, since they no longer have to rely on
journalists to take an interest in their work (Bucchi & Trench 2014; Dudo 2015). This is an attractive option for research-
ers who prefer direct interaction with the public, as well as those who consider themselves better able to communicate
the social and ethical implications of their research, compared with communicating via mediators such as journalists
(Casini & Neresini 2012). Furthermore, the use of multimedia tools such as video clips, animations, infographics, games
and interactive maps, presents novel ways to make science more engaging and entertaining than ever before (Bucchi
& Trench 2014).

How Researchers Respond to Social Media
Taking note of the benefits that could result from the strategic use of social media, researchers increasingly realise that
social media networks are about more than sharing holiday photos with friends or liking cat videos. Increasingly, social
media platforms are recognised as effective means to promote research and keep up with new advances in science,
while evidence is emerging that researchers are employing social media tools in ever more sophisticated ways (Bombaci
et al. 2016; Montgomery 2009; Priem & Costello 2010).
   However, not all researchers are embracing social media tools (Scanlon 2012), and the proportion of scholars who
frequently use social media remains relatively low (Collins, Shiffman & Rock 2016). Time pressures, unfamiliarity with
novel communication tools and a lack of support to develop new skills are common deterrents which limit research-
ers’ adoption of social media tools (Bik & Goldstein 2013; Regenberg 2010). Many researchers continue to view social
media use as a potentially perilous activity associated with a high risk of reputational damage, while others consider it a
silly and frivolous waste of time that is unsuitable for communicating science (Collins, Shiffman & Rock 2016; Esposito
2013; Joubert 2018).
   South African researchers generally have strong opinions in favour of, or against, social media as a science communi-
cation platform. Based on interviews conducted in 2017 with 30 highly visible scientists in the country, Joubert (2018)
classifies them as ‘avoiders’, ‘experimenters’ or ‘enthusiasts’ according to their social media adoption and use. Avoiders
(those who dislike social media intensely) and experimenters (those who are uncertain, but would like to use these tools
in future) made up the bulk of researchers. Enthusiasts, i.e. researchers who already use social media extensively, were
exceptions. The two researchers who were found to be the most visible in the South African public sphere (Joubert &
Guenther 2017) — Lee Berger (@LeeRberger) and Tim Noakes (@ProfTimNoakes) — are both enthusiastic Twitter users.
With more than 12,400 and 122,000 followers respectively (as on 28 January 2019), these two researchers use Twitter
not only to share their own opinions and research, but also to discover and discuss research done by their peers.

Twitter as a Special Case
Twitter, a microblogging platform and social networking tool, has emerged as a particularly popular and powerful sci-
ence communication platform that researchers (or scholars) embrace more readily than other social media platforms,
possibly because it is viewed as more professional and more suitable for science communication than other tools such
Joubert and Costas: Getting to Know Science Tweeters                                                       Art. 2, page 3 of 14

as Facebook (Yeo et al. 2014). Researchers use Twitter to share and discuss their own research, to discover new research
and to monitor developments in their fields, as well as to engage policymakers and public audiences (Allgaier et al.
2013; Collins, Shiffman & Rock 2016; Darling et al. 2013; Yeo et al. 2014). It is also the social media platform that is the
most popular among the data sources (Haustein 2018). There is no doubt that the presence of scholars and research
articles on Twitter can be seen as a novel form of dissemination of scientific knowledge beyond the academic walls,
thus making the presence and engagement of scholarly entities on Twitter a good proxy for the ‘scholarlisation’ of social
media, an aspect with an arguably strong relevance in research policy. As such, studies of the interactions between
scholars and social media, in what can be seen as the emergence of the social media studies of science (Costas 2017),
can provide new perspectives on how scholars are engaging with public and broader audiences, thereby contributing to
public engagement with research. Despite some exceptions (e.g. China and Russia), Twitter is a social media tool with a
global uptake. Therefore, it is possible to compare the Twitter behaviour of users from different countries, an interna-
tional comparative perspective that has been incorporated into this paper.

Research Questions
This study explored how Twitter users in South Africa (referred to as ‘ZA science tweeters’ in this article) are using this
social media network to tweet about research outputs (mostly research articles, including review articles). The study
focused on understanding the activity of ZA science tweeters and how they compare to other science tweeters around
the world. Also, for South African science tweeters we distinguish between ZA science scholar-tweeters (i.e. those ZA
science tweeters that have been matched with a WoS author) and ZA science non-scholar-tweeters (i.e. those ZA science
tweeters that are not matched with a WoS author).
  The study was guided by the following research questions:

    RQ1: How does the number of ZA science tweeters compare to science tweeters in Africa and the world?
    RQ2: How does the distribution of ZA science tweeters within/outside the academic community compare with
    Africa and the world?
    RQ3: What trends can be observed in terms of the numbers of ZA science tweeters?
    RQ4: How do ZA science tweeters describe themselves in their Twitter bios?
    RQ5: How do ZA science tweeters tweet about research articles? (Are they sending original tweets or are they
    mostly re-tweeting? How are they using hashtags and mentions to other users?)
    RQ6: Who are the most influential ZA science tweeters?
    RQ7: Which topics do ZA science tweeters tweet about?

Method
For this study we used the altmetric database produced by Altmetric.com. This database has been described as one of
the most prominent data sources collecting altmetric data (Robinson-Garcia et al. 2014), containing altmetric indica-
tors for more than five million publications worldwide. The limitations of this source have been discussed in previous
studies (Ortega 2018; Zahedi & Costas 2018). Particularly relevant for this study is the dependency on specific document
identifiers, which are further discussed below. Specifically, Altmetric.com has collected more than 24.5 million tweets
mentioning a total of almost 4 million research outputs (e.g. research articles, review articles, datasets, etc.) in the
period from 23 December 2010 to 5 June 2016.
   As stated above, it is important to note that Altmetric.com can only identify a specific research output if a social
media user mentions one of the links associated with the most common publication identifiers currently in place
(e.g. DOI, PubMed identifiers, arXiv.org ids, etc.) or if the social media user links to the URLs of publishers tracked
by Almetric.com. The limitations of relying on direct links and the dependence on publication identifiers have been
discussed in the literature (Haustein 2016; Haustein, Costas & Larivière 2015) since mentions of research outputs that
do not contain any of these links may be overlooked with this strategy. However, other approaches based on textual
analysis of tweets referring to research outputs would suffer from a lower reliability compared to approaches that rely
on these identifiers. We therefore argue that the Altmetric.com approach is more reliable, despite the fact that it may
be incomplete.
   From the dataset of scholarly oriented tweets (i.e. tweets linked to research articles) we have identified a total of
2,622,116 unique tweeters (according to their unique Twitter handles) who have tweeted at least once about a research
article. It is possible, based on the data provided by Altmetric.com, to attribute a country geolocation for about 57% of all
the Twitter users recorded in this database (Zahedi & Costas 2017), which is still considered to be a good proxy (Haustein
2018) for the country of origin of the majority of tweeters. A total of 1,489,154 science tweeters with geolocations have
been considered for this study.
   Similarly, for each of these 2.6 million tweeters a series of Twitter-based indicators were calculated (see Table 1).
These indicators were used to characterise the behaviour and activity of these Twitter users in their interactions with
research outputs (mainly research articles).
   In addition to the indicators listed above, the identified Twitter accounts have also been matched with the database
set of disambiguated authors from the WoS developed by Caron and Van Eck (2014). This disambiguation of authors is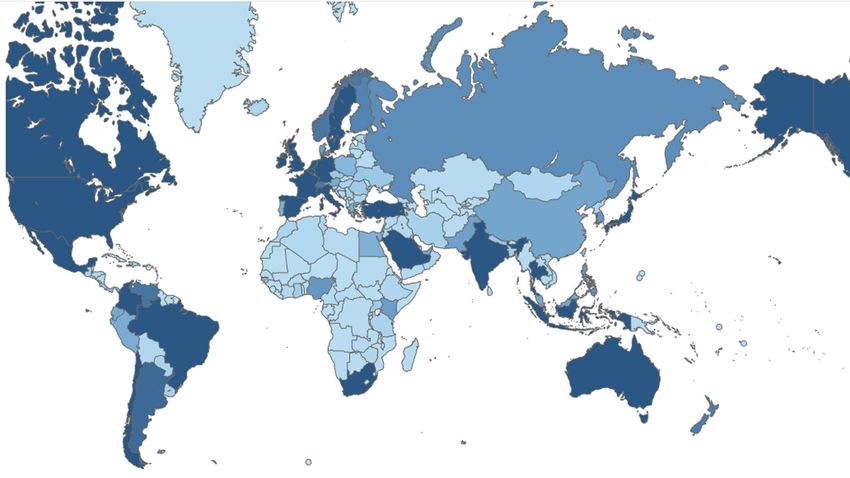
Art. 2, page 4 of 14                                                           Joubert and Costas: Getting to Know Science Tweeters

Table 1: Twitter-based indicators for scholarly oriented tweeters.

        Indicators           Description
        TWS                  Number of tweets mentioning research articles
        re-TWS               Number of tweets that are retweets
        PTWS (original)      Proportion of tweets that are not retweets
        Altmetric activity   Number of days between the first and the last tweet about a research article, as recorded by
        (days)               Altmetric.com
        PTWS (mentions)      Proportion of all tweets that contain mentions of other users (excluding mentions on retweets)
        PTWS (hashtags)      Proportion of all tweets that contain hashtags
        Followers            Number of followers of the tweeter in its last recorded tweet in Altmetric.com

a rule-based algorithm that weights the similarities of papers from authors with the same name, thus the higher the
similarity of the publications (e.g. in the number of co-authors, cited references, etc.) the higher the probability that
they belong to the same person. The algorithm tries to be precise (i.e. that all the publications assigned to an author
are correct) although this is at the cost of a lower recall (i.e. sometimes some of the publications of an author are not
attached to the author). By matching Twitter users with authors in the WoS, we were able to distinguish ‘science scholar-
tweeter’ from ‘science non-scholar-tweeters’, as has been described above. The Costas, Van Honk and Franssen (2017)
matching algorithm basically considers similarities between the names of the authors and the tweeters to perform the
match, considering also the similarity of their papers as the criteria to establish a score of similarity between the author
and the tweeter. More specifically, in this paper, only those tweeters matched to scholars with a score higher or equal
to five have been taken into account. This means that, in this paper, we take an even more restrictive criteria (in terms
of strength and validity of the match) than in the original Costas, Van Honk and Franssen (2017) algorithm (who set
their threshold at four). With this, we intend to increase the precision of the scholars matched in our study, although
potentially at the cost of some recall in terms of scholar science tweeters identified.
  Additional information about the individual tweeters were also obtained from the Altmetric.com database, specifically:

  – T he self-description (or Twitter bio) of the Twitter user (as presented in the last tweet recorded for each individual
    Twitter user).
  – The last country reported by the Twitter user as recorded by Altmetric.com. [Note, as reported before (Zahedi &
    Costas, 2018), about 42% of all Twitter users recorded by Altmetric.com do not provide country identification.]

All the collected data (listed above) were studied using several approaches:

  –    escriptive statistics, using IBM SPSS Statistics 23 for all the indicators.
      D
  –   Tableu Software (https://www.tableau.com) has been used for the analysis of tweeters per country.
  –    Textual analysis of the self-descriptions of the tweeters, using VOSviewer software (Van Eck & Waltman 2010).
  –     Thematic attention analysis of the Twitter users’ interests by WoS subject categories. This analysis is limited to
      tweets related to publications covered in the WoS during the time period under investigation (23 December 2010
      to 5 June 2016), including all fields of science covered in the WoS.

Results
Number of Science Tweeters in South Africa Compared to Africa and the World (RQ1)
In Figure 1, we present a global picture of the number of Twitter users that tweet about research articles. Countries
coloured in light blue have fewer than 10,000 science tweeters, while countries with darker shades of blue having pro-
gressively more than 10,000 tweeters who tweeted at least once about a research article.
  It is evident from Figure 1 that countries with the highest numbers of science tweeters include the United States, the
United Kingdom, Canada and Japan. This is not unexpected (Caron & Van Eck 2014) since these are some of the most
prolific countries in terms of scientific outputs. Other countries that have relatively high numbers of science tweeters
include Australia and Spain. In Latin America, most science tweeters are from Brazil and Mexico, while India is the most
active country in Asia. The African country with the highest number of science tweeters is South Africa (darkest blue on
the African continent), followed by Nigeria, Kenya and Egypt.
  From the perspective of relative population size, South Africa is the 24th country in terms of its population size accord-
ing to 2016 world population data (World Bank 2016), while it occupies the 15th position in terms of science tweeters
in the world. This means that South Africa has a relatively strong position in terms of the number of tweeters active in
discussing scientific publications. This contrasts with the lower positions occupied by other countries such as China (1st
in terms of population size [World Bank Data 2016], but 37th when it comes to the number of science tweeters [Zahedi
& Costas 2017]) or Russia (9th in terms of population [World Bank Data 2016], but 30th according to science tweeters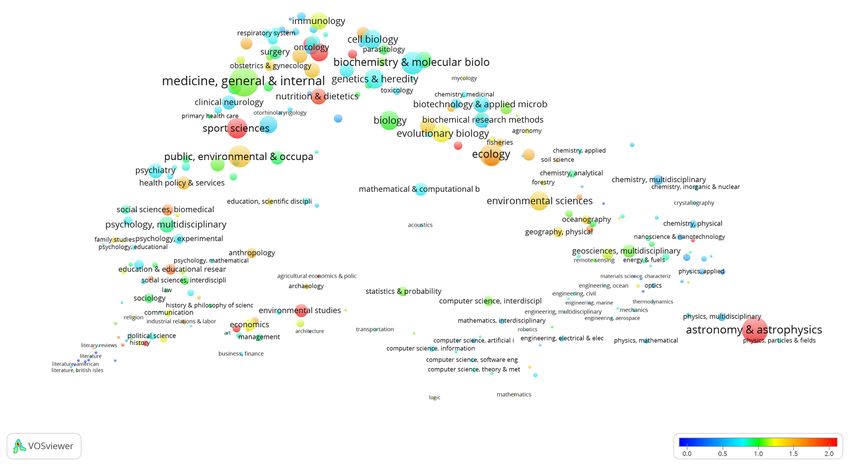
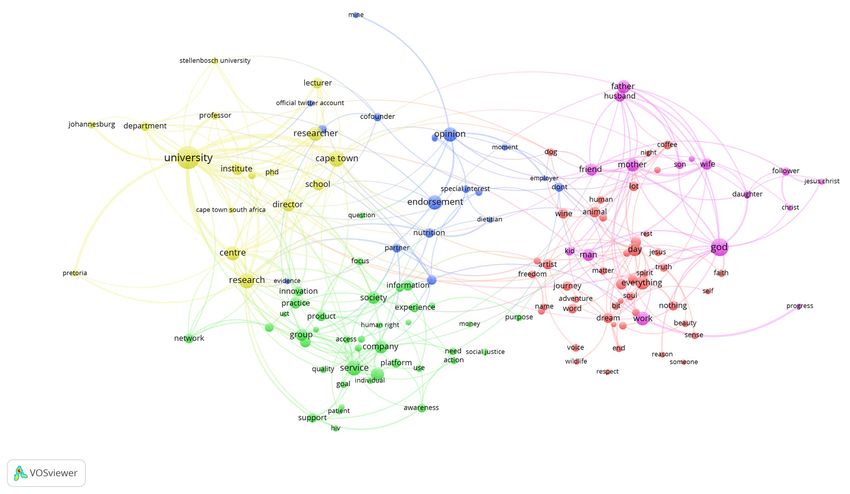
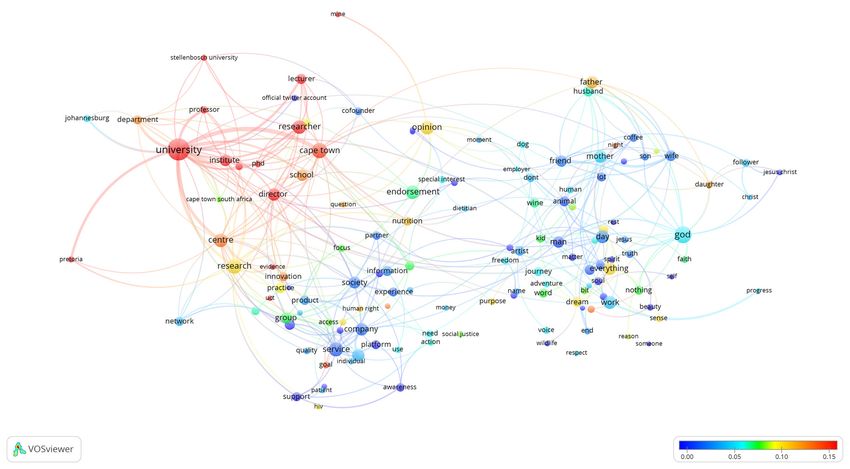
Joubert and Costas: Getting to Know Science Tweeters                                                           Art. 2, page 5 of 14

Figure 1: Global distribution of science tweeters based on data from Altmetric.com.

[Zahedi & Costas 2017]). The relatively lower number of contributions to science tweeting from these countries are
clearly influenced by restrictions related to Twitter access, as well as the presence of other social media tools.
  On the other side of the spectrum, countries from the northern hemisphere, particularly north American and west
European countries have a relatively stronger presence among science tweeters that is in line with their relative share
of the world’s population.

ZA Science Tweeters Compared to Africa and the World in Terms of Distribution within/outside Scholarly
Community (RQ2)
In Table 2, the total numbers of tweeters from the four African countries where most science tweeters are located
(South Africa, Nigeria, Kenya and Egypt), as well three reference countries from different world regions (Brazil, Spain
and the United Kingdom) are presented, together with the number of the science tweeters that have been identified as
scholars. Global values are provided for comparison.
   Science tweeters in South Africa represent 0.5% of all science tweeters in the dataset, while science tweeters in
Nigeria, Kenya and Egypt each contribute less than 0.3% of the total. Amongst the reference countries, The United
Kingdom is the largest country in terms of tweeters mentioning research articles, and also represents the largest per-
centage of the total sample, followed by Spain and then Brazil. These countries represent 8.3%, 2.2% and 0.8% respec-
tively of the global population of Twitter users that are tweeting about research articles.
   The percentage of science tweeters in South Africa that are also scholars (6.6%) is on par with the percentage of
Twitter users globally that have been identified as scholars (6.8%). The African country with the largest share of scholars
who are tweeting about research articles is Egypt (8.6%), although the relatively small numbers involved in the analysis
here need to be taken into consideration. Kenya and Nigeria both have smaller numbers of tweeter-scholars. Overall,
the reference countries have higher shares of tweeter-scholars, with more than 9% of science tweeters in the United
Kingdom also being scholars.

Trends in the Numbers of ZA Science Tweeters (RQ3)
Figure 2 presents an analysis of the number and world share of South African Twitter users that tweet about a research
article for the first time over a number of years, showing that the number of new science tweeters in South Africa has
been increasing annually since 2012. Moreover, relative to the total number of science tweeters around the world, there
has been a noticeable growth in the share of tweeters from South Africa that are discussing research articles on Twitter,
particularly from 2014 onwards.

How Do ZA Science Tweeters Describe Themselves? (RQ4)
In Figure 3, we present a visualisation, created with VOSviewer, of the most frequently used terms that ZA science
tweeters used to describe themselves. This visualisation technique clusters those terms that appear in the same tweeter
description (or bio) more often, thereby creating specific clusters of closely related terms. A cluster of ‘academic’ terms
is visible (left-hand side, yellow), including terms such as ‘university’, ‘institute’, ‘research’, ‘researcher’, etc. The second
cluster (right-hand side, purple) and the third cluster (in red) both contain descriptors that relate to the tweeters on
a personal level. Descriptors in the purple cluster are strongly related to the personal status of the individual tweeter,
such as ‘husband’, ‘mother’, ‘friend’, etc., while the red cluster relates more to the preferences or views of the tweeters,
such as ‘freedom’, ‘animal’, ‘coffee’, etc.
Art. 2, page 6 of 14                                                      Joubert and Costas: Getting to Know Science Tweeters

Table 2: Science Tweeters in Selected African Countries compared to Selected Countries and Global Values.

                       Country            Science     % World        Science         % Science
                                         tweeters                scholar-tweeters scholar-tweeters
                       South Africa          14,174      0.5%                 932               6.6%
                       Nigeria               5,008       0.2%                 265               5.3%
                       Kenya                  4,610      0.2%                 292               6.3%
                       Egypt                  3,274       0.1%                280               8.6%
                       Brazil               21,887       0.8%               1,543               7.0%
                       Spain                58,509       2.2%               4,147               7.1%
                       United Kingdom      217,351       8.3%              20,247               9.3%
                       World             2,622,116       100%             177,695               6.8%

Figure 2: Trend analysis of the number of new ZA science tweeters and share of ZA science tweeters over time
  (Note: Data for 2016 is only from 1 January to 5 June 2016).

  A fourth cluster (bottom-left, in green) is of particular importance to this study, since it relates to the ‘professional
or topic-related’ terms that the science tweeters have used to describe themselves. These terms typically relate to the
professional status of the individual and contains descriptors such as ‘company’, ‘service’ and ‘practice’. Finally, a fifth,
smaller cluster (centre of the graph, in blue) includes terms referring to the views and positioning of the tweeters in
their Twitter activities, such as ‘opinion’, ‘endorsement’ and ‘special interest’.
  These clusters, particularly the ‘academic-related’, ‘personal-related’ and ‘professional or topic-related’ clusters,
strongly resemble earlier results (Haustein & Costas 2015) in which similar clusters were identified based on a global
analysis of tweeters from Altmetric.com.
  In Figure 4, terms that are mostly used by tweeters who were also identified as scholars are coloured in red. Therefore,
red nodes highlight self-describing terms that are prominent among scholars, in this case meaning that at least 15% of
the tweeters who use those terms have been identified as scholars. These results show that South African scholars who
tweet about research articles frequently use academic-related terms to describe themselves on Twitter. This tendency
of academic users to use academic terms to describe themselves can be seen as an indication that they intend to use
Twitter as a platform for scholarly communication, dissemination and discussion, thus linking their role as scholars with
their role as science tweeters. By using academic terms to describe themselves, these scholar science tweeters may also
be trying to establish a higher level of credibility for their science-related tweets.

How Do ZA Science Tweeters Use Twitter? (RQ5)
In Table 3, we present a general analysis of the Twitter activity of ZA science tweeters. Some correlations stand out.
For example, the number of retweets (re-TWS) correlates with the total number of tweets about research articles (TWS),
together with the overall number of days of altmetric activity. Jointly, these indicators can be considered to capture the
overall Twitter activity of ZA science tweeters.
Joubert and Costas: Getting to Know Science Tweeters Art. 2, page 7 of 14 Figure 3: Main self-description terms of ZA science tweeters (main clusters). Figure 4: Main self-description terms of ZA science tweeters (red nodes: terms used by at least 15% of scholars). Regarding more specific types of online activities, the proportion of original tweets [PTWS (original)] correlates nega- tively with the overall number of retweets, while original tweets correlates moderately with the proportion of tweets in which the tweeters have targeted other tweeters in the system [PTW (mentions)]. Thus, these indicators capture the type of behaviour of ZA science tweeters, contrasting ‘original’ behaviour (i.e. those that initiate discussion about a research article) with ‘interactive’ behaviour (those that respond by retweeting). The more weakly correlated indicators are the number of followers and the proportion of original tweets [PTWS (original)], which suggests a certain discon- nect between the creation of audiences on Twitter and the initiation of discussions around research articles on Twitter. Alternatively, the number of followers is slightly better correlated with the number of overall tweets about research articles and the number of days of activity of tweeters captured by Altmetric.com, suggesting that a persistent presence on Twitter may be more important in order to create larger audiences on Twitter. In order to understand the behaviour of ZA science tweeters, we compared the main statistical values between the community of scholar science tweeters identified and the rest of the ZA science tweeters. This analysis provided a picture of specific patterns that can be related to scholarly Twitter users versus those who are not scholars. The overall summary of all the indicators are presented in Table 4, while we present a general comparison between
Art. 2, page 8 of 14                                                                       Joubert and Costas: Getting to Know Science Tweeters

Table 3: Spearman correlations among all Twitter-related indicators for ZA tweeters.

                                   TWS re-TWS              PTWS       Altmetric       PTWS       PTWS     Followers
                                                         (original) activity (days) (mentions) (hashtags)
              TWS                  1.00          0.65            0.17               0.93           0.32             0.22          0.21
              re-TWS                             1.00           –0.52               0.62          –0.02             0.27          0.17
              PTWS
                                                                 1.00               0.15           0.49            –0.11          0.03
              (original)
              Altmetric
                                                                                    1.00           0.29             0.20          0.25
              Activity (days)
              PTWS
                                                                                                   1.00            0.043          0.13
              (mentions)
              PTWS
                                                                                                                    1.00          0.08
              (hashtags)
              Followers                                                                                                           1.00

Table 4: Overall Descriptive Statistics of South African Tweeters.

                                     TWS          re-TWS          PTWS             PTWS       Altmetric       PTWS                Followers
                                                                (hashtags)       (mentions) Activity (days) (original)
       N                   Valid     14,174         14,174              14,174        14,174              14,174       14,174            14,174
                        Missing             0              0                0               0                 0              0               0
       Mean                               7.85           4.12            0.29           0.10              211.25           0.33     1,671.50
       Median                         1.00              1.00                0               0               1.00             0       239.00
       Std. Deviation                81.07          24.00                0.39          0.26               378.30           0.43   14,985.22
       Minimum                              1              0                0               0                 1              0               0
       Maximum                       6,086              1,210            1.00          1.00                1,818           1.00   1,026,294
       Percentiles           25       1.00              1.00                0               0               1.00             0           80.00
                             50       1.00              1.00                0               0               1.00             0       239.00
                             75       3.00              2.00             0.50               0             255.00           0.92      690.00
                             85       6.00              4.00             1.00          0.21               578.00           1.00     1,225.00
                             90      10.00              6.00             1.00          0.50               802.50           1.00     1,839.50
                             95      23.00          14.00                1.00          1.00           1,130.25             1.00    3,825.75
                             99      97.00          56.00                1.00          1.00           1,578.50             1.00   23,796.00

South African scholars and non-scholars who tweet about research articles in Table 5. On average, tweeter-scholars
tweet about research articles more often than non-scholar tweeters (see columns TWS and reTWS). The median
value also showed that more than 50% of all the tweeter-scholars have tweeted about research articles three or
more times.
  Another important insight relates to the skewness of the activity level of the individuals who tweet about research
articles. Overall (see Table 5) only 10% of the ZA science tweeters have tweeted about 10 or more research articles.
This suggests that the bulk of Twitter activity about research articles comes from a minority of active science tweeters.
This skew was observed for both science scholar-tweeters and science non-scholar-tweeters, although scholars are more
active in terms of tweeting about research articles. Also, scholars tend to have a more prolonged involvement in the
discussion of research articles, with more than 50% of the ZA science tweeters active for more than 200 days, while
only 25% of the non-scholars have been active for a similar time period. On average, as far as tweeting about research
articles is concerned, non-scholar science tweeters were active for 196 days, while scholar science tweeters were active
for more than 400 days.

Influential ZA Science Tweeters (RQ6)
While science scholar-tweeters are more actively tweeting about research articles compared to science non-scholar-
tweeters (see above), they do not necessarily reach more followers. In this study, scholar-tweeters had on average 1,600
followers, while non-scholar-tweeters had 1,700 followers. This means that non-scholars are as influential as (or slightly
Joubert and Costas: Getting to Know Science Tweeters Art. 2, page 9 of 14
Table 5: General values of Twitter-activity indicators for ZA science tweeters (scholars versus non-scholars).
TWS re-TWS PTWS PTWS Altmetric PTWS Followers
(hashtag) (mentions) Activity (original)
(days)
Science N 13,242
non-scholar-
tweeters Mean 6.84 3.47 0.30 0.11 195.90 0.33 1,679.65
Median 1.00 1.00 0 0 1.00 0 242.00
Std. Deviation 80.84 18.78 0.40 0.27 362.57 0.43 15,190.53
Minimum 1 0 0 0 1 0 0
Maximum 6,086 1,206 1.00 1.00 1 818 1.00 1,026,294
Percentiles 25 1.00 1.00 0 0 1.00 0 81.00
50 1.00 1.00 0 0 1.00 0 242.00
75 3.00 2.00 0.50 0.00 224.00 0.94 699.25
85 6.00 4.00 1.00 0.20 524.00 1.00 1,241.00
90 9.00 6.00 1.00 0.50 744.00 1.00 1,888,70
95 19.00 11.00 1.00 1.00 1,080.00 1.00 3,888.00
99 76.57 45.00 1.00 1.00 1,536.57 1.00 23,943.20
Science N 932
scholar-
tweeters Mean 22.21 13.41 0.30 0.14 429.39 0.42 1,555.80
Median 3.00 2.00 0.20 0 202.50 0.33 196.00
Std. Deviation 82.98 60.47 0.34 0.25 507.92 0.40 11,690.61
Minimum 1 0 0 0 1 0 0
Maximum 1,386 1,210 1.00 1.00 1,813 1.00 218,451
Percentiles 25 1.00 1.00 0 0 1.00 0 68.00
50 3.00 2.00 0.20 0.00 202.50 0.33 196.00
75 13.00 6.00 0.50 0.19 785.25 0.87 542.00
85 26.00 16.00 0.67 0.33 1,075.00 1.00 893.10
90 44.00 27.70 1.00 0.50 1,270.00 1.00 1,333.40
95 83.00 53.35 1.00 0.79 1,456.90 1.00 2,570.10
99 270.34 195.71 1.00 1.00 1,737.36 1.00 24,108.37
more influential than) scholars when they tweet about research articles, based on the size of their respective following
audiences.
Scholar-tweeters with more than 1,000 followers on Twitter are more able to reach diverse audiences, such as decision
makers beyond the scientific community (Côté & Darling 2018). For ZA science tweeters, the pattern of followers is
highly uneven. From Appendix 1 it can be seen that only 25% of all ZA science tweeters had more than 690 followers,
while only the top 1% of ZA science tweeters had more than 20,000 followers. This means that the bulk of potential
exposure and reach regarding the discussion of research articles on Twitter can be associated with a small number of
highly followed tweeters.
In terms of engagement patterns, science scholar-tweeters send out more original tweets and more often mention
other Twitter users, compared to science non-scholar-tweeters. Also, scholars used hashtags more frequently, another
indicator that they are using Twitter more effectively for engaging with other users compared to science tweeters
outside the academic community.
Overall, this analysis presents a picture of science scholar-tweeters who are more active in using Twitter to communicate
about research, and who are using Twitter more effectively as an engagement tool compared to non-scholar-tweeters,
but also shows that scholars are not necessarily reaching more followers.
One of the advantages of the approach used in this study is that it makes it possible to identify specific tweeters with
particular behaviours or patterns in their interactions with scientific outputs. For example, in terms of the individual
Twitter users in South Africa that are most actively tweeting about research articles and have the most followers, the
following individuals can be highlighted from this study:Art. 2, page 10 of 14 Joubert and Costas: Getting to Know Science Tweeters
The most active ZA science tweeter within the academic community is Professor Tim Noakes (see his Twitter pro-
file at https://twitter.com/ProfTimNoakes).
The most active ZA science tweeter from outside the academic community is ‘The Conversation Africa’ (see
https://twitter.com/TC_Africa), an independent science news and commentary web site designed for academics
to share their work with broader society.
The ZA science tweeter from within the academic community who has the most followers is Ferial Haffajee, a
researcher at the Public Affairs Research Institute (see https://twitter.com/ferialhaffajee).
The science non-scholar-tweeter with the most followers is the media personality Gareth Cliff (see https://twitter.
com/GarethCliff).
The Topics that ZA Science Tweeters Tweet About (RQ7)
In this section, we focus on the thematic orientation of the research articles that ZA science tweeters tweeted about. The
thematic landscape is presented in Figure 5. In this visualisation, the nodes represent different disciplines (WoS subject
categories), while the distances between the nodes are based on citation relationships (Costas, Zahedi & Wouters 2015).
The size of each node indicates the number of tweets coming from ZA science tweeters linked to WoS publications in
that discipline, while the colour represents the share of tweets from ZA science tweeters compared to global science
Twitter activity for each topic. Thus, red nodes signal scientific topics in which the activity of ZA science tweeters is
twice as prominent as what would have been expected based on the average presence of ZA science tweeters in the
global context. [Note: In technical terms, red nodes correspond to disciplines in which there are two times more ZA
science tweeters than the average of ZA science tweeters in all the disciplines. On average 0.32% of the tweets in WoS
disciplines come from ZA science tweeters, thus red disciplines are those in which more than 0.64% of the tweets come
from South Africans.]
Several disciplines can be highlighted as having a special relevance for ZA science tweeters. For example, the number
of tweets about research articles in the field of astronomy and astrophysics stand out, while sports sciences, environ-
mental studies, ecology, nutrition and dietetics, as well as oncology are noticeable as prominent topics.
Discussion and Conclusions
Scholars use many social media platforms to communicate science, but our aim with this study was specifically to
understand the role of Twitter (and tweeters) in South Africa when it comes to the dissemination of research articles.
This question is highly relevant due to the prominence of Twitter in science communication activities and the evidence
of its impact on scientific articles (Côté & Darling 2018).
This study presents a descriptive analysis of the activities of South African Twitter users interacting with scholarly
outputs. We focused on describing and characterising the main social media actors and their relationship with scholarly
outputs, thus moving away from the traditional altmetric approaches that are restricted to less informative accounting
of tweets, retweets and other social media activities around scientific publications (Robinson-García et al. 2014). We
consider a framework more related to the study of scholarly communication, positioning the role of Twitter metrics as
instruments to study the pros and cons of social media in science communication (as described in the Introduction).
Figure 5: Thematic profile (WoS subject categories) of the publications tweeted by ZA science tweeters.Joubert and Costas: Getting to Know Science Tweeters Art. 2, page 11 of 14 As such, our approach was actor-centred and provided a contextual perspective (Waltman & Van Eck 2016), with the broader aim of increasing our knowledge about the relationships between social media and science in South Africa. The approach presented in this paper opens the door for more advanced studies of the advantages and disadvantages of social media for science communication. It is also important to highlight some of the limitations of our current study. In the first place, our study is based on data that has been algorithmically obtained, with the author-name disambiguation algorithm to identify active scholars in WoS (Caron & Van Eck, 2014), and the algorithm to match WoS authors with tweeters from Altmetric.com (Costas, Van Honk & Fransen, 2017). Both algorithms exhibit specific limitations; the author-name disambiguation algorithm is not always effective in collecting all the publications of the same author, occasionally missing some of the publications of a given author. The author-Twitter matching algorithm strongly depends on the fact that authors have tweeted publications and that they identify themselves clearly, those authors that do not identify themselves fully (e.g. by using the same names that they use in their research papers, tweeting papers related to their own research, etc.) may fail to be matched. In the second place, there are limitations related to Twitter. Particularly, the fact that only just over half of all the tweeters in our sample have geolocations, implies that ZA science tweeters may be lost from the analysis simply because they have failed to report South Africa as their country on Twitter. Furthermore, the fact that a Twitter user reports South Africa as their country does not automatically mean that they are South African citizens; it could be related to different reasons than their actual geolocation. These algorithmic and data limitations suggest that the results presented in this study need to be interpreted with some care, and should be seen as rough proxies for the Twitter activity of ZA science tweeters. All in all, our results show that South African tweeters occupy a relatively strong position in disseminating research articles on Twitter in relation to its population. Furthermore, we also show that the share of ZA science tweeters that can be identified as active publishing scholars is about 6.6%. While this figure compares well with the world average and is relatively higher compared to other African countries, it is lower compared to other countries such as the UK, Spain or Brazil. Over time, the number of South African tweeters who tweet about scientific publications has increased both overall and in relative terms. In general, the activity of South African tweeters is highly skewed, with more than half of all ZA science tweeters only publishing one tweet linked to a research article, and only 1% that have tweeted 97 or more times about research articles. This is in line with the skewed distribution of tweets linked to scientific publica- tions globally (Costas et al. 2016), suggesting that the majority of science tweeters are mainly occasional users who just tweet about (and mostly re-tweet) a research article once. The picture is a bit different when the focus is on those ZA science tweeters that have been identified as active publishing scholars. These scholar-tweeters exhibit a more active profile, not only by tweeting more frequently about research articles, but also by exhibiting more extensive engage- ment in the dissemination of these scientific outputs, as demonstrated by their higher rates of original tweets, as well as linking their tweets to hashtags and mentioning other Twitter users in their tweets. In terms of how they describe themselves, ZA science tweeters tend to use words from four main groups of terms: academic terms (e.g. ‘university’ or ‘research’), personal terms (e.g. ‘father’, ‘mother’), professional terms (e.g. ‘company’, ‘practice’) and opinion and views related terms (‘opinion’, ‘freedom’). This organisation of self-description terms aligns with what has been described for larger groups of science tweeters (Haustein & Costas 2015). In addition, ZA science tweeters who are also identified as scholars, tend to present themselves more strongly with terms associated with the academic groups, which supports the idea that scholars interested in disseminating science on Twitter tend to present themselves as scholars and use their original names (Van Eck & Waltman 2010), suggesting that they link their symbolic capital as scholars to their science-tweeting activities. The analysis of scientific disciplines that are attracting the attention of ZA science tweeters presents a diversity of topics that range from health-related topics such as oncology, nutrition and dietetics, which are related to topics with a strong presence on Twitter overall (Costas, Zahedi & Wouters 2015) to other topics that are more specific to South Africa. For example, astronomy and astrophysics, ecology and environmental studies are more prominent amongst ZA science tweeters compared to research topics in the global science Twitter landscape (Costas, Zahedi & Wouters 2015). These results highlight the potential use of altmetrics as a tool to identify and explore disciplinary interests amongst Twitter communities. In conclusion, our study demonstrates an increasing presence of South African tweeters who interact with scholarly outputs, thus suggesting a growing interest in science among Twitter users in South Africa. Future research could include the refinement of the identification of more academic entities among South African tweeters in order to develop a more detailed categorisation of tweeters and their activities around scientific topics, including the tweeting of publications from South African publishers not covered in the WoS. Also, it would be useful to expand the study to other African countries in order to benchmark the activities of ZA science tweeters against those from neigh- bouring countries. Considering the specific features of the African research system, it is important to determine whether African scholars also exhibit distinctive patterns of behaviour when they interact on Twitter with scholarly material, and to analyse whether there may be another potential divide that could hinder the online visibility of African science. From a more conceptual point of view, further research should also focus on how the motivations and interests of scholars play a role in their Twitter communications (e.g. whether they are driven by self-interest, self- promotion, or other reasons), and how the dissemination of knowledge on Twitter complements (or interferes) with
Art. 2, page 12 of 14                                                       Joubert and Costas: Getting to Know Science Tweeters

the communication of ideas through publications. All these approaches, within the framework of the social media
studies of science, should contribute to depict a broader understanding of the interactions between scholarly entities
and social media.

Additional File
The additional file for this article can be found as follows:

  • Appendix 1. Overall descriptive statistics of South African tweeters. DOI: https://doi.org/10.29024/joa.8.s1

Competing Interests
The authors have no competing interests to declare.

References
Allgaier, J., Dunwoody, S., Brossard, D., Lo, Y. Y., & Peters, H. P. (2013). Journalism and social media as means of
   observing the contexts of science. BioScience, 63(4), 284–287. DOI: https://doi.org/10.1525/bio.2013.63.4.8
Anderson, A. A. (2017). The social nature of online media and its effects on behaviors and attitudes. In A. Dudo & L.
   Kahlor (Eds.), Strategic Communication: New Agendas in Communication (pp. 66–83). New York: Taylor & Francis.
   ISBN: 9781138184787.
Anderson, A. A., Brossard, D., & Scheufele, D. A. (2010). The changing information environment for nanotechnology:
   Online audiences and content. Journal of Nanoparticle Research, 12(4), 1083–1094. https://www.ncbi.nlm.nih.gov/
   pmc/articles/PMC2988218/. DOI: https://doi.org/10.1007/s11051-010-9860-2
Bik, H. M., & Goldstein, M. C. (2013). An introduction to social media for scientists. PLoS Biology, 11(4), e1001535. DOI:
   https://doi.org/10.1371/journal.pbio.1001535
Birch, H. (2011). The social web in science communication. In D. J. Bennett & R. C. Jennings (Eds.), Successful science
   communication: Telling it like it is (pp. 280–293). Cambridge, UK: Cambridge University Press. ISBN: 9781107003323.
   DOI: https://doi.org/10.1017/CBO9780511760228.024
Bombaci, S. P., Farr, C. M., Gallo, H. T., Mangan, A. M., Stinson, L. T., Kaushik, M., & Pejchar, L. (2016). Using
   Twitter to communicate conservation science from a professional conference. Conservation Biology, 30(1), 216–225.
   DOI: https://doi.org/10.1111/cobi.12570
Brossard, D. (2013). New media landscapes and the science information consumer. Proceedings of the National
   Academy of Sciences of the United States of America, 110(Suppl. 3), 14096–140101. DOI: https://doi.org/10.1073/
   pnas.1212744110
Brossard, D., & Scheufele, D. A. (2013). Science, new edia, and the public. Science, 339(6115), 40–41. DOI: https://doi.
   org/10.1126/science.1232329
Bucchi, M., & Trench, B. (2014). Routledge handbook of public communication of science and technology. London:
   Routledge. ISBN: 9780415834612. DOI: https://doi.org/10.4324/9780203483794
Caron, E., & Van Eck, N. J. (2014, September). Large scale author name disambiguation using rule-based scoring and
   clustering. In E. Noyons (Ed.). Proceedings of the Science and Technology Indicators Conference 2014: Context
   counts: pathways to master big data and little data (pp. 79–86). Leiden, The Netherlands.
Casini, S., & Neresini, F. (2012). Behind closed doors: Scientists’ and science communicators’ discourses on science
   in society. A study across European research institutions. Technoscienza, Italian Journal of Science and Technology
   Studies, 3(2), 37–62.
Collins, K., Shiffman, D., & Rock, J. (2016). How are scientists using social media in the workplace? PLoS ONE, 11(10),
   1–10. DOI: https://doi.org/10.1371/journal.pone.0162680
Costas, R. (2017). Towards the social media studies of science: social media metrics, present and future. Bibliotecas.
   Anales de Investigación, 13(1), 1–5.
Costas, R., Haustein, S., Zahedi, Z., & Larivière, V. (2016, September). Exploring paths for the normalization of
   altmetrics: applying the Characteristic Scores and Scales. Paper presented at the 2016 Altmetrics Workshop, Bucharest,
   Romania.
Costas, R., Van Honk, J., & Franssen, T. (2017, October). Scholars on Twitter: who and how many are they? Paper
   presented at the 16th International Conference on Scientometrics and Informetrics (ISSI), Wuhan, China.
Costas, R., Zahedi, Z., & Wouters, P. (2015). The thematic orientation of publications mentioned on social media.
   Aslib Journal of Information Management, 67(3), 260–288. DOI: https://doi.org/10.1108/AJIM-12-2014-0173
Côté, I. M., & Darling, E. S. (2018). Scientists on Twitter: Preaching to the choir or singing from the rooftops? Facets,
   3(1), 682–694. DOI: https://doi.org/10.1139/facets-2018-0002
Darling, E., Shiffman, D., Cȏté, I., & Drew, J. (2013). The role of Twitter in the life cycle of a scientific publication. Ideas
   in Ecology and Evolution, 6, 32–43. DOI: https://doi.org/10.4033/iee.2013.6.6.f
Dudo, A. (2015). Scientists, the media, and the public communication of science. Sociology Compass, 9(9), 761–775.
   DOI: https://doi.org/10.1111/soc4.12298
Joubert and Costas: Getting to Know Science Tweeters                                                    Art. 2, page 13 of 14

Esposito, A. (2013). Neither digital or open. Just researchers: Views on digital/open scholarship practices in an Italian
   university. First Monday, 18(1), 1–22. DOI: https://doi.org/10.5210/fm.v18i1.3881
Fausto, S., Machado, F. A., Bento, L. F. J., Iamarino, A., Nahas, T. R., & Munger, D. S. (2012). Research blogging:
   Indexing and registering the change in Science 2.0. PLoS ONE, 7(12), e0124184. DOI: https://doi.org/10.1371/
   journal.pone.0050109
Gastrow, M. (2015). Science and the social media in an African context: The case of the aquare kilometre array telescope.
   Science Communication, 37(6): 703–722. DOI: https://doi.org/10.1177/1075547015608637
German National Academy of Sciences. (2017). Social Media and Digital Science Communication Analysis and
   Recommendations for Dealing with Risks and Opportunities in a Democracy. Position paper.
Haustein, S. (2016). Grand challenges in altmetrics: Heterogeneity, data quality and dependencies. Scientometrics,
   108(1), 413–423. DOI: https://doi.org/10.1007/s11192-016-1910-9
Haustein, S. (2018). Scholarly Twitter metrics. In W. Glänzel, H. Moed, U. Schmoch, & T. M (Eds.), Springer Handbook of
   Quantitative Science and Technology Research (eprint arXiv:1806.02201).
Haustein, S., Bowman, T., Holmberg, K., Tsou, A., Sugimoto, C., & Larivière, V. (2016). Tweets as impact indicators:
   Examining the implications of automated “bot” accounts on Twitter. Journal of the Association for Information
   Science and Technology, 67(1), 232–238. DOI: https://doi.org/10.1002/asi.23456
Haustein, S., & Costas, R. (2015, November). Identifying Twitter audiences: Who is tweeting about scientific papers?
   Paper presented at the 2015 ASIS&T Metrics 2015 Workshop, St. Louis, USA.
Haustein, S., Costas, R., & Larivière, V. (2015). Characterizing social media metrics of scholarly papers: The effect
   of document properties and collaboration patterns. PLoS ONE, 10(3), e0120495. DOI: https://doi.org/10.1371/
   journal.pone.0120495
Joubert, M. (2018). Factors influencing the public communication behaviour of publicly visible scientists in South
   Africa. (Doctoral dissertation, Stellenbosch University, Stellenbosch). Retrieved from http://scholar.sun.ac.za/
   handle/10019.1/103268.
Joubert, M., & Guenther, L. (2017). In the footsteps of Einstein, Sagan and Barnard: Identifying South Africa’s most
   visible scientists. South African Journal of Science, 113(11/12). DOI: https://doi.org/10.17159/sajs.2017/20170033
Mandavilli, A. (2011). Trial by Twitter. Nature, 469, 268–269. DOI: https://doi.org/10.1038/469286a
Montgomery, S. L. (2009). Science and the online world: Realities and issues for discussion. In R. Holliman, J. Thomas,
   S. Smidt, E. Scanlon, & E. Whitelegg (Eds.), Practising Science Communication in the Information Age (pp. 83–97).
   London: Oxford University Press. ISBN: 9780199552672.
Onyancha, O. B. (2015). Social media and research: An assessment of the coverage of South African universities in
   ResearchGate, Web of Science and the Webometrics Ranking of World Universities. South African Journal of Libraries
   and Information Science, 81(1): 8–20. DOI: https://doi.org/10.7553/81-1-1540
Ortega, J. L. (2018). Reliability and accuracy of altmetric providers: A comparison among Altmetric, PlumX and Crossref
   Event Data. Scientometrics, 116(3), 2123–2138. DOI: https://doi.org/10.1007/s11192-018-2838-z
Peters, H. P., Dunwoody, S., Allgaier, J., Lo, Y., & Brossard, D. (2014). Public communication of Science 2.0. EMBO
   reports, 15(7), 749–753. DOI: https://doi.org/10.15252/embr.201438979
Priem, J., & Costello, K. L. (2010). How and why scholars cite on Twitter. Proceedings of the American Society for
   Information Science and Technology, 47(1). DOI: https://doi.org/10.1002/meet.14504701201
Regenberg, A. C. (2010). Tweeting science and ethics: Social media as a tool for constructive public engagement. The
   American Journal of Bioethics, 10(5), 30–31. DOI: https://doi.org/10.1080/15265161003743497
Robinson-Garcia, N., Costas, R., Isett, K., Melkers, J., & Hicks, D. (2017). The unbearable emptiness of tweeting–about
   journal articles. PLoS ONE, 12(8). DOI: https://doi.org/10.1371/journal.pone.0183551
Robinson-García, N., Torres-Salinas, D., Zahedi, Z., & Costas, R. (2014). New data, new possibilities: Exploring the
   insides of Altmetric.com. El Profesional de la Informacion, 23(4), 359–366. DOI: https://doi.org/10.3145/epi.2014.
   jul.03
Scanlon, E. (2012, April). Rethinking the scholar: Openness, digital technology and changing practices. In M. Bucchi &
   B. Trench (Eds.), Proceedings of the 2012 International PCST Conference: Quality, Honesty and Beauty in Science and
   Technology Communication (pp. 307–310). Florence, Italy.
Su, L. Y. -F., Scheufele, D .A., Bell, L., Brossard, D., & Xenos, M. A. (2017). Information-sharing and community-
   building: Exploring the use of Twitter in science public relations. Science Communication, 39(5), 569–597. DOI:
   https://doi.org/10.1177/1075547017734226
Van Eck, N. J., & Waltman, L. (2010). Software survey: VOSviewer, a computer program for bibliometric mapping.
   Scientometrics, 84(2), 523–538. DOI: https://doi.org/10.1007/s11192-009-0146-3
Van Eperen, L., & Marincola, F. M. (2011). How scientists use social media to communicate their research. Journal of
   Translational Medicine, 9(1), 199. DOI: https://doi.org/10.1186/1479-5876-9-199
Van Rooyen, F. (2017). Science communication and the nature of the social media audience : Breaking and spreading of
   science news on Twitter in the South African context (Master’s thesis, Stellenbosch University, Stellenbosch). Retrieved
   from scholar.sun.ac.za/handle/10019.1/100908
You can also read