Gisborne / East Coast District Community Profile - For the Community Response Model Forum 30 June 2011
←
→
Page content transcription
If your browser does not render page correctly, please read the page content below
Gisborne / East Coast District
Community Profile
For the Community Response Model Forum

30 June 2011

n-215256
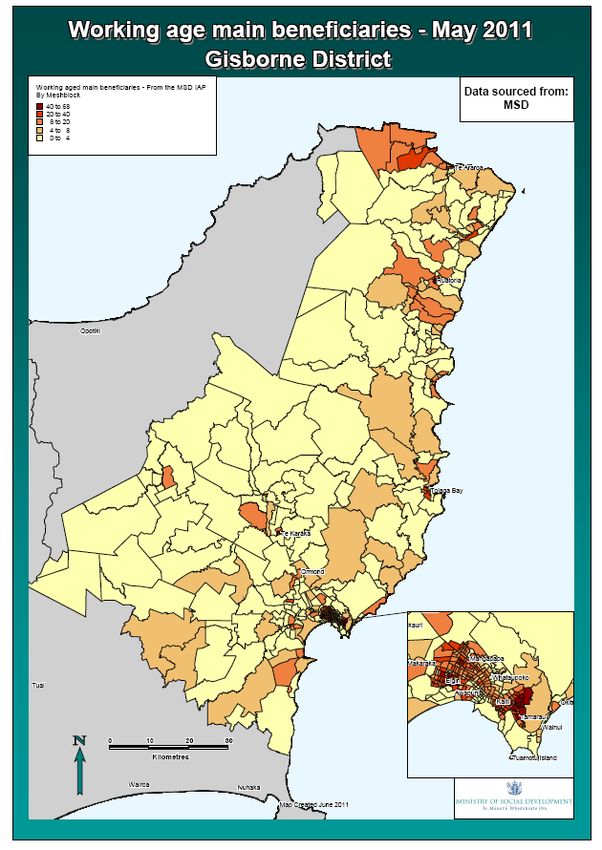
Gisborne / East Coast District at a glance
There are about 46,500 people resident in Gisborne / East Coast with expected slight increase to 2021

In 2006 the age distribution differed from NZ as a whole with more children and fewer young and early middle
aged adults where couples with children are the most common family grouping at 40% (42% nationally)

Couples without children made up 33% compared with 40% nationwide. One parent families made up 27%
compared with 18% nationally

Māori made up 47% of the district’s population in 2006 (compared with NZ’s 15%). On the East Cape 90% of
residents were Māori. The most commonly affiliated iwi is Ngäti Porou by far

Ethnic diversity is low – Pakeha, Pacific and Asian groups are fewer than NZ averages

Gisborne / East Coast District is considerably more socio-economically deprived compared with NZ as a
whole with almost a third of residents assessed as living in decile 10 and a further 15% in decile 9, meaning
that almost one half (46%) are judged to be among the 20% most socio-economically deprived in NZ

The wealthier deciles 1 to 6 were much less represented with 33% of the population living in those deciles

The poorest people are most likely to live in East Cape, Ruatoria, Tokomaru Bay, Tolaga Bay, Te Karaka,
Gisborne Airport, Outer Kaiti, Kaiti South and Tamarau

Personal incomes were 16% lower than NZ averages with Māori earning considerably less than non-Māori

In 2006 62% of the population over 15 years were employed (65% nationally) with just over ¾ working full
time. Primary industries are the biggest employers of young people and adults at much larger rates than
national averages

Around 58% of the district’s 0-4 year olds were on regular early childhood rolls in 2010 (60% nationally)

34% of adults had no formal education qualification in 2006, another 32% had a school qualification

In 2009, 8% of Gisborne / East Coast District school leavers left without formal attainment compared with 5%
nationally. 59% of school leavers enrolled in tertiary education (63% nationally). Between 2001-2009 40%
enrolled in polytechnics, 31% went to universities and 23% went to private training establishments

There is a significantly younger pattern of childbearing with 37% of live births from women under 25 (25%
nationally) between 2001 and 2010. Women in their 30s produced 36% of newborns (47% across NZ)

13% of live births (2001-2010) were by teen mothers versus 7% nationally. The teen birth rate was
consistently around 60% higher across that period

In 2010 35% of new Plunket client babies were born into decile 10 homes, of which 78% were Māori. Another
29% of Plunket client babies are born into decile 8 or 9 homes. Plunket saw around 48% of the districts
newborns.

An estimated 79% of children in Plunket client families were fully immunised in 2010 (85% nationally)

The local crime rate was consistently higher than NZ rates across 2001-2010 by around 25%. Theft and
related offences is the most common offence type followed by property offences and unlawful entry

Recorded family violence offences were consistently higher than national averages between 2006-2010 by
around 50% in 2006 to three times the national rate by 2009

Gisborne / East Coast District Community Profile – for the CRM Forum – 30 June 2011               Page 2 of 71
Contents
Gisborne / East Coast at a glance……….……………………………………………..…………….2

1.0    Introduction to the Gisborne / East Coast Community Profile…………………6

2.0    Gisborne / East Coast District, Council Vision and Community Outcomes....7

       2.1     Tairāwhiti By Choice - Community Outcomes
       2,2     Connected, empowered, prosperous, safe Tairāwhiti
                     -        Heartlands Service Centre
                     -        Know Your Neighbour
                     -        Whānau Ora
       2.3     Developing Māori capacity to contribute to decision-making

3.0    The Community………………………………………………………………………….10

       3.1     Population
       3.2     Ethnic diversity
                       -       Māori population and iwi affiliation
                       -       Te reo Māori
                       -       Overseas born
       3.3     Age distribution
                       -       Age distribution of Māori
       3.4     Families
                       -       Household size and composition
       3.5     Births and teen mothers

4.0    Young People…………………………………………………………………………….25

       4.1     Support to stay on track
                      -       Break Away School Holiday Programmes
                      -       Job Ops
                      -       Limited Service Volunteer
                      -       Youth Transition Services
                      -       Mayors Taskforce for Jobs
       4.2     Employment and occupation
       4.3     The Impact of the Recession on East Coast Youth
       4.4     Income support
       4.5     Cigarette smoking
       4.6     Suicide

5.0    Older People……………………………………………………………………….……..28

       5.1     Gisborne’s Older Person’s Policy
       5.2     New Zealand Positive Ageing Strategy
       5.3     Ministry of Social Development’s East Coast Regional Plan

Gisborne / East Coast District Community Profile – for the CRM Forum – 30 June 2011   Page 3 of 71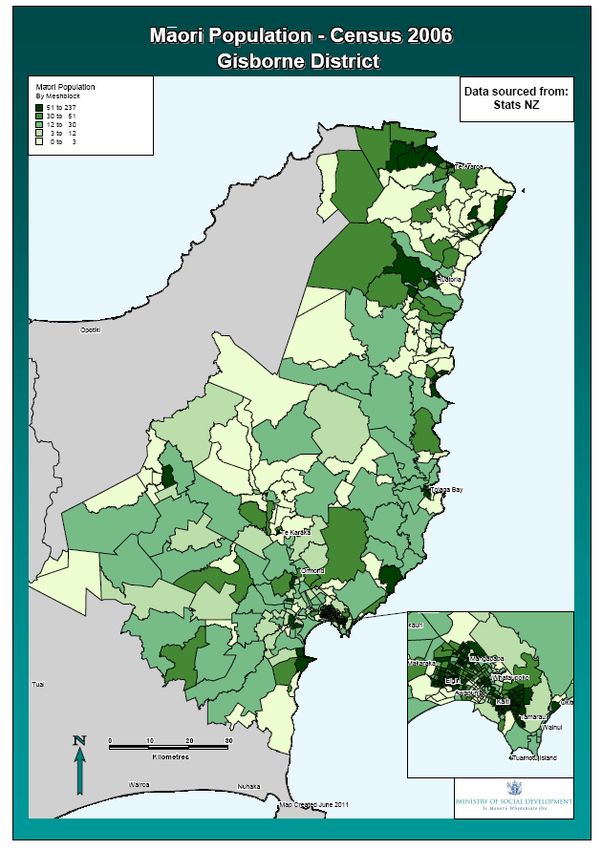
6.0    Health………………………………………………………………………………………29

       6.1     Mental health
       6.2     Plunket WellChild and immunisation
       6.3     Cigarette smoking
       6.4     Life expectancy

7.0    Economic Wellbeing…………………………………………………………………….32

       7.1     Socio-economic deprivation
       7.2     Personal income
                      -        Income levels of Māori
       7.3     Household income
                      -        Household facilities
       7.4     Employment, industry and occupation
                      -        Industry
                      -        Occupation
       7.5     Work for young people
       7.6     Location of work
                      -        Travel to work
       7.7     Unpaid activities
       7.8     Income support
                      -        People aged 65 years and over
                      -        People aged 20-64 years
                      -        Young people
                      -        Accommodation supplement

8.0    Housing……………………………………………………………………………………49

       8.1     Sector of landlord
       8.2     State housing
       8.3     Rents
       8.4     Community housing

9.0    Education………………………………………………………………………………….53

       9.1     Early childhood education
       9.2     Gisborne schools and educational qualifications
                       -      School profiles
                       -      Qualifications
                       -      Leaving school with formal attainment
       9.3     Truancy, stand downs, suspensions, exclusions, expulsions
                       -      Truancy
                       -      Stand downs and suspensions
                       -      Exclusions and expulsions
       9.4     Early leaving exemptions
       9.5     Tertiary education destinations

10.0   Justice…………………………………………………………………………………….61

Gisborne / East Coast District Community Profile – for the CRM Forum – 30 June 2011   Page 4 of 71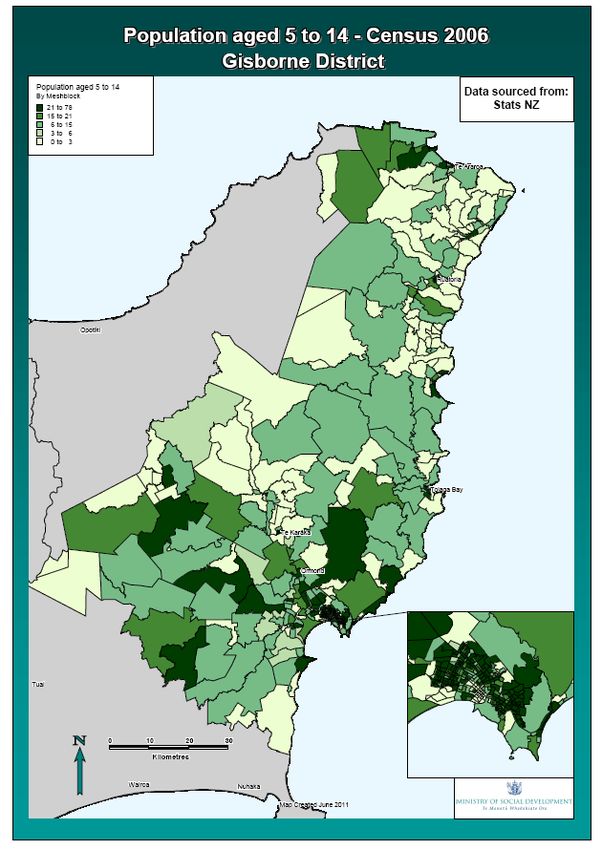
10.1    Recorded criminal offences
                      -      Apprehensions
                      -      Resolution for apprehensions for under 17 years
       10.2    Family violence
                      -      Protection Orders
                      -      Referrals to domestic violence programmes
       10.3    Child Youth and Family

11.0   References………………………………………………………………………………71

Gisborne / East Coast District Community Profile – for the CRM Forum – 30 June 2011   Page 5 of 71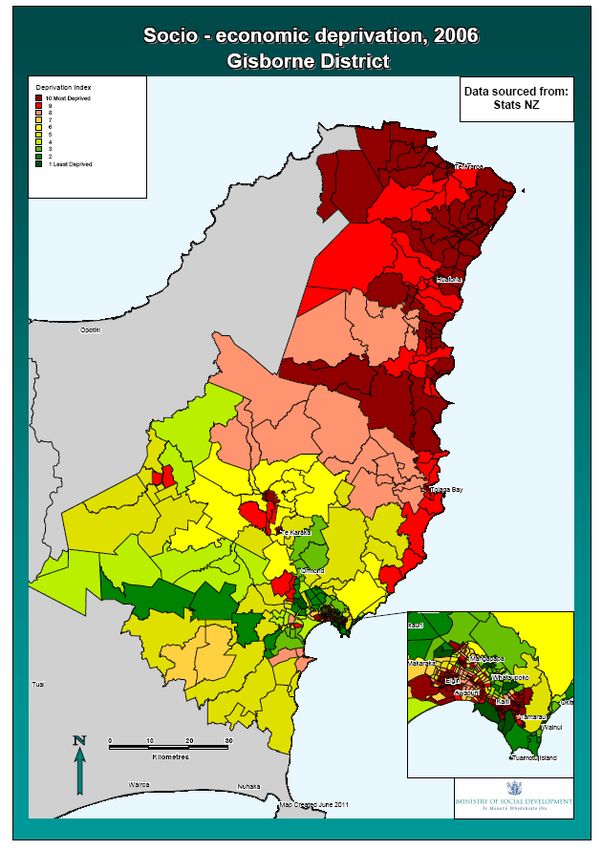
Introduction to the Gisborne / East Coast District Community
Profile
The aim of this document is to provide a “second tier” of information to the CRM Forum with regard
to the Gisborne / East Coast District.

This Gisborne / East Coast Community Profile follows on from the “first tier” of information already
provided to the Forum – the Common Priorities Across Government Agencies summary report.

The profile contains a wide range of official information and statistics to provide an overarching
picture of the communities that comprise the Gisborne District Territorial Authority. A large part of
the information is 2006 Census data and there is also more recent government agency data.
Where there is overlap in subject matter, the relevant Community Outcomes (from the Long Term
Council Community Plan) are woven in, along with other regional strategic plans / outcomes for the
region such as the Ministry of Social Development’s East Coast Regional Plan.

Where possible the data has been split into Gisborne City, Gisborne Rural and East Coast
categories, to reflect how people in the east see their communities structured.

The previous page Gisborne / East Coast - at a glance provides a snapshot of the district and the
people. Each of the themes is expanded upon on in this document – the Contents page will lead
you to more in-depth information. The document is provided to assist your Forum to gain a fairly
solid, statistical overview of the communities that make up Gisborne and the East Coast, while you
simultaneously undertake the task of talking to stakeholders and families, to hear first hand what
their strengths, issues and dream of the future is.

Chriss Bull
CRM Information Manager
04 9177 153
chriss.bull005@msd.govt.nz

Gisborne / East Coast District Community Profile – for the CRM Forum – 30 June 2011       Page 6 of 71
2.0    Gisborne / East Coast District, Regional Vision and Community
       Outcomes
Gisborne District, centred around the city of Gisborne, makes up the eastern half of the North
Island’s East Cape. With Pacific Ocean coastline forming its northern and eastern boundaries,
Gisborne District has three territorial authority neighbours: Opotiki and Whakatane Districts to the
west and Wairoa District to the south.

Gisborne / East Coast District Community Profile – for the CRM Forum – 30 June 2011       Page 7 of 71
2.1 Tairāwhiti By Choice - Community Outcomes
In December 2008, the Gisborne District Council endorsed a document called Tairāwhiti By Choice,
a community outcomes document for the Gisborne District. Tairāwhiti was used to uniquely identify
and affiliate communities within the Gisborne District Council catchment. The eight outcomes are:
Environmentally sustainable Tairāwhiti
Healthy Tairāwhiti
Connected Tairāwhiti
Prosperous Tairāwhiti
Skilled and educated Tairāwhiti
Vibrant Tairāwhiti
Safe Tairāwhiti
Empowered Tairāwhiti
The eight outcome areas are interlinked. Combined they give an overview of all the things that are
important to Tairāwhiti. More detail about some of the Community Outcomes is found in relevant
sections throughout this document.
2.2 Connected, empowered, prosperous and safe Tairāwhiti
A number of the Tairāwhiti Community Outcomes have linkages to the Ministry of Social
Development’s East Coast Regional Plan, “Communities are better able to support themselves”1
outcome:
• “Connected Tairāwhiti” which focuses on the provision of essential services and
infrastructure in a way that makes the most of the region and supports all the outcome areas
• “Empowered Tairāwhiti” through supporting the community to actively participate in
community life and the democratic processes
• “Prosperous Tairāwhiti” through our investments in people and economic development
• “Safe Tairāwhiti” through creating a resilient community where people feel safe and secure.
Heartlands Service Centre
One contribution from government agencies to assist with building stronger communities in the
district includes the establishment of a Heartlands Service Centre based in Ruatoria with outreach
sites at Te Araroa and Tokomaru Bay. Heartlands aims to help people in smaller communities to
access a range of government and other related services from a single point and through outreach
1
To see the East Coast Regional Plan 2010-2012 go to: http://www.msd.govt.nz/about-msd-and-our-work/publications-
resources/corporate/regional-plans/2010-12/east-coast/
Gisborne / East Coast District Community Profile – for the CRM Forum – 30 June 2011 Page 8 of 71services. 2 There is also Heartlands in neighbouring Wairoa as well as a Community Link site.
Community Link involves a range of government and non-government organizations working under
one roof, with common clients.3
Know Your Neighbour
In March 2001 the Gisborne District Council began to develop weekends of activities on the theme
“Know your neighbour”. These aim to break down isolation, particularly for older people, and build a
sense of community.4
Whānau Ora
Whānau Ora provides practical, community-based support to whānau so they can be self-managing
and determine their own economic, cultural and social development. The primary focus is on
achieving best outcomes for whānau through the development of whānau leadership and integrated
whānau-centred service delivery.
To support the implementation of Whānau Ora, a Governance Group provides strategic advice on
policy priorities and ensures co-ordination across government agencies and key stakeholders.
Whānau Ora is led by Te Puni Kōkiri in partnership with Ministry of Social Development (MSD) and
Ministry of Health. MSD is contributing to Whānau Ora in two ways:
• leading the integration of contracts which selected providers or collectives have with other
agencies
• supporting the operation of Regional Leadership Groups to lead strategic change for
Whānau Ora in the ten current Te Puni Kōkiri regions. Representatives from the community
sit alongside local agencies so that Whānau Ora reflects the local priorities and knowledge
of each area.
The implementation of Whānau Ora in the East Coast is being overseen by the Tairāwhiti and
Takitimu Regional Leadership Group. The Ministry is represented on the group by representatives
from Family and Community Services and Work and Income managers.
2.3 Developing Māori capacity to contribute to decision-making
The Giborne District Council’s Ten Year Plan 2009-2019 notes that the Council has a long-standing
history of working closely with Māori of the Tairāwhiti region. A number of mechanisms have been
developed for both consultation purposes and to involve Māori of the district in Council decision-
making processes. These mechanisms will continue to be developed and reviewed to ensure their
2
Heartlands is a community-owned service, administered by Family and Community Services, that improves access to
information and services for families. For more information go to: http://www.heartlandservices.govt.nz/
3
For more information about Community Link go to: http://www.workandincome.govt.nz/about-work-and-
income/community-link/what-is-community-link.html
4
For more information to go media article in the Gisborne Herald:
http://www.gisborneherald.co.nz/article/?type=article&id=21813
Gisborne / East Coast District Community Profile – for the CRM Forum – 30 June 2011 Page 9 of 71effectiveness. They include: the Māori Liaison Officer, Code of Partnership and Participation,
direct information sharing and formal relationship documents.5
3.0 The Community
3.1 Population
The 2006 Population Census said that Gisborne District was home to 44,460 people: 32,530 (73%)
in Gisborne City, 8,030 (18%) in Gisborne’s rural areas, and 3,900 (9%) on the East Cape as noted
in detail in the table below.
Usually-resident population of Gisborne City, Gisborne rural and East Cape area units,
1996, 2001 and 2006
Area Unit 1996 2001 2006
Gisborne City
Te Hapara 4398 4293 4281
Mangapapa 4299 4266 4266
Whataupoko 3645 3654 3696
Gisborne Central 3381 3222 3117
Kaiti South 2997 2733 2841
Gisborne Airport 2853 2763 2742
Outer Kaiti 2688 2427 2610
Tamarau 2430 2337 2298
Kaiti North 2100 2064 2046
Riverdale 1185 1242 1614
Wainui 1377 1410 1515
Makaraka 894 918 1041
Matokitoki 363 390 465
32610 31719 32532
Gisborne rural
Tiniroto 2235 2139 2112
Wharekaka 2028 1950 1914
Tarndale-Rakauroa 1890 1692 1650
Tolaga Bay 897 870 831
Manutuke 738 639 603
Te Karaka 600 552 543
Patutahi 351 360 375
8739 8202 8028
East Cape
East Cape 3099 2751 2703
Ruatoria 855 837 756
Tokomaru Bay 477 462 444
4431 4050 3903
District total 45,780 43,974 44,460
Source: Census of Population and Dwellings, 2006
5
The Developing Māori capacity to contribute to decision-making policy is found in the Council’s Ten Year Plan 2009-
2019.
Gisborne / East Coast District Community Profile – for the CRM Forum – 30 June 2011 Page 10 of 71At that time, it showed that the district’s total population increased by 1.1% on the 2001 usually-
resident total, much smaller growth than the 7.8% national increase, that had followed a 3.9% fall in
population between 1996 and 2001. Between 2001 and 2006:
• Gisborne City recorded an overall population increase of 2.6% (just over 810 people)
• All but one of the rural area units in Gisborne experienced a decline in population (2.1%
overall)
• East Cape experienced a 3.6% decline, with each of its three area units losing residents.
Statistics New Zealand estimated that by June 2010, the population of Gisborne District stood at
46,500:
• Gisborne City’s population was estimated at 34,200 (74% of the district total)
• rural parts of Gisborne were home to an estimated 8,300 (18%), and
• East Cape was estimated to have 4,000 residents (9%).
Statistics NZ projects that Gisborne District’s population will increase slightly between 2011 and
2021 (from 46,900 to 47,000), then fall back to 45,900 by 2031.6
3.2 Ethnic diversity
Gisborne District has a very different ethnic mix from the country as a whole. At the 2006 Census:
• 54% of the district’s residents were ‘European’ / Pakeha – considerably smaller proportion
than the 68% nationwide
• 9% identified as ‘New Zealanders’ (11% nationally)
• Māori made up almost one-half (47%) of the district’s population7, more than three times the
national proportion of 15%
• around 3% identified as Pacific Peoples (7% nationally)
• 2% identified with an Asian ethnic group (9% nationally)
• other ethnic groups were practically non-existent in the district.
6
These population projections assume medium rates of fertility, mortality and migration.
7
Percentages add to more than 100 because individuals could identify with more than one ethnic group and all were
counted.
Gisborne / East Coast District Community Profile – for the CRM Forum – 30 June 2011 Page 11 of 71Ethnic group, 2006:
Percent of
All New Zealand and Gisborne District
resident population
80
All New Zealand
70
Gisborne District
60
50
40
30
20
10
0
European Māori New Zealander Pacific Peoples Asian Other
Ethnic group
Source: Census of Population and Dwellings, 2006
Both Gisborne City and rural parts of the district had similar ethnic compositions to the district as a
whole. However, East Cape presented a totally different picture. Of the 3,460 East Cape residents
who specified their ethnicity:
• the large majority (88%) identified as Māori
• only 23% of the Cape’s population identified as Pakeha / ‘European’.
Māori population and iwi affiliation
As might be expected, the district exhibited a similar pattern of Māori descent in 2006. Across the
district as a whole 51% of residents said they had Māori ancestry, 47% did not, and 2% did not
know.
In Gisborne City the proportion with Māori ancestry was below half (47%), in rural areas of Gisborne
it was slightly higher at 49%, but on the East Cape a very large 90% of residents had Māori
ancestry.
Gisborne / East Coast District Community Profile – for the CRM Forum – 30 June 2011 Page 12 of 71Ethnic group percentages, 2006:
Percent of Gisborne City, Gisborne rural and East Cape
resident population
100
Gisborne City
90
Gisborne rural
80 East Cape
70
60
50
40
30
20
10
0
European Māori Pacific Peoples Asian
Ethnic group
In the 2006 Census, people with Māori ancestry are asked to specify their iwi affiliations8:
• just 7% of those descended from a Māori did not know their iwi, compared with 17%
nationally
• Ngāti Porou is by far the most numerous iwi affiliation among Gisborne Māori, with 12,400
people identifying with that iwi)
• Five other iwi (Te Aitanga-a-Māhaki, Rongowhakaata, Tühoe, Ngāpuhi and Ngāti
Kahungunu ki Te Wairoa) also had more than 1,000 district residents affiliating with them.
The table below lists all iwi identified by 500 or more people of Māori descent living in Gisborne /
East Coast District in 2006.
8
Numbers total more than the population with Māori ancestry because individuals could affiliate with more than one iwi
and all were counted.
Gisborne / East Coast District Community Profile – for the CRM Forum – 30 June 2011 Page 13 of 71Iwi affiliations for people in Gisborne / East Coast District, 2006
Iwi Count
Ngäti Porou 12,402
Te Aitanga-a-Mähaki 2,454
Rongowhakaata 1,803
Tühoe 1,596
Ngäpuhi 1,359
Ngäti Kahungunu ki Te Wairoa 1,221
Te Whänau-a-Apanui 915
Ngäi Tämanuhiri 771
Ngäti Kahungunu, region unspecified 669
Whakatöhea 576
Ngäi Tahu / Käi Tahu 519
Ngäti Tüwharetoa 513
Number of people responding to iwi question
in the 2006 Census 19,839
Source: NZ Census of Population and Dwellings
People were able to identify with more than one iwi affiliation – all answers were counted.
The map on the next page provides a mesh-block illustration of where the Māori population lived in
2006 in Gisborne / East Coast District.
Gisborne / East Coast District Community Profile – for the CRM Forum – 30 June 2011 Page 14 of 71Gisborne / East Coast District Community Profile – for the CRM Forum – 30 June 2011 Page 15 of 71
Te reo Māori

In 2006, Gisborne / East Coast District contained 4% of New Zealand’s Māori language speakers,
with around 6,740 residents saying they were able to hold a conversation in Māori. This was:

     •        16% of the district’s resident population, four times the national proportion
     •        the fifth highest proportion in the country (behind Opotiki, Kawerau, Wairoa and Whakatane
              Districts).

Given the different ethnic composition across various parts of Gisborne / East Coast District, it is
not surprising that widely differing proportions of residents were speakers of te reo:

     •        13% in Gisborne City
     •        16% in rural parts of the district
     •        a high 45% of East Cape residents.

Māori residents of Gisborne / East Coast District are considerably more likely to speak the Māori
language than Māori across the country. In 2006:

     •        almost one-third (32%) of Gisborne Māori could speak te reo compared with 24% of Māori
              nationally
     •        around 2% of the district’s non-Māori residents were Māori speakers – double the national
              proportion.

Because of sheer population numbers, most of the Māori people in Gisborne who can speak Māori
are young - 48% were aged under 30 in 2006. However, the older Māori are, the more likely they
are to be speakers of te reo. For example, in 2006, young Māori aged 10-19 made up 21% of all
Māori speakers in the district. This equated to 31% of Gisborne Māori in that age group. At older
ages, the numbers were smaller but the proportions were larger (38% of Māori people in the district
aged 50-59 years were speakers of te reo, along with 54% of those aged 60-69 and 71% of those in
their 70s). The graph below shows the proportion of Māori people in each age group who spoke
Māori.

                             Proportion of Māori people able to speak Māori by age, 2006:
                                        All New Zealand and Gisborne District
    Percent
         80
                                  All New Zealand
         70
                                  Gisborne District
         60

         50

         40

         30

         20

         10

         0
               Under 10   10-19             20-29     30-39         40-49         50-59   60-69   70-79   80 and over

                                                              Age group (years)

Source: Census of Population and Dwellings, 2006

Gisborne / East Coast District Community Profile – for the CRM Forum – 30 June 2011                                     Page 16 of 71
Overseas born
In 2006, just 9% of Gisborne / East Coast District’s residents were overseas born compared with
the national proportion of 23% with:
• Gisborne City having the highest proportion of overseas-born residents at 10%
• rural areas recorded 6%
• East Cape recorded just 2%.
Across the district as a whole, New Zealand’s most common overseas birthplace, the UK and
Ireland, accounted for 3% of residents (around half the national proportion). As might be expected
from the district’s ethnic composition, Asia and the Pacific Islands were the most under-represented
overseas birthplaces.
3.3 Age distribution
The age distribution of Gisborne / East Coast District’s population is different from the national
picture, with more children in the population than national averages and with fewer young and early-
middle aged adults. At the 2006 Census:
• children under the age of 15 years made up 26% of the district’s residents (almost 5%
higher than nationally)
• young adults aged 15-29 years made up 18% of the population locally (20% nationwide)
• 30-44 year olds accounted for 20% (22% nationally)
• 45-59 year-olds constituted 19% of the population (similar to nationally)
• 60-74 year-olds accounted for 11% (similar to nationally)
• 75 years and over made up a little over 5% of the population (similar to nationally).
Within the district there were quite marked differences in the age distribution of the population.
Children under the age of 15 years made up larger proportions of the rural population:
• 26% in Gisborne City, 27% in rural areas and 30% on the East Cape
Young adults were less well represented rurally:
• 15-29 years accounted for 19% of Gisborne City’s population and 16% in rural parts of the
district and on East Cape.
People aged 30-44 and 45-59 made up larger proportions of the rural population than in Gisborne
City, whereas the reverse was true for older age groups. The difference was most marked among
those aged 60 years or more. They formed 18% of the population in Gisborne City but just 12%
rurally and 14% on East Cape.
Gisborne / East Coast District Community Profile – for the CRM Forum – 30 June 2011 Page 17 of 71Age distribution, 2006:
Percent of Gisborne City, Gisborne rural and East Cape
resident population
35
Gisborne City
Gisborne rural
30
East Cape
25
20
15
10
5
0
0-14 15-29 30-44 45-59 60 and over
Age group (years)
Source: Census of Population and Dwellings, 2006
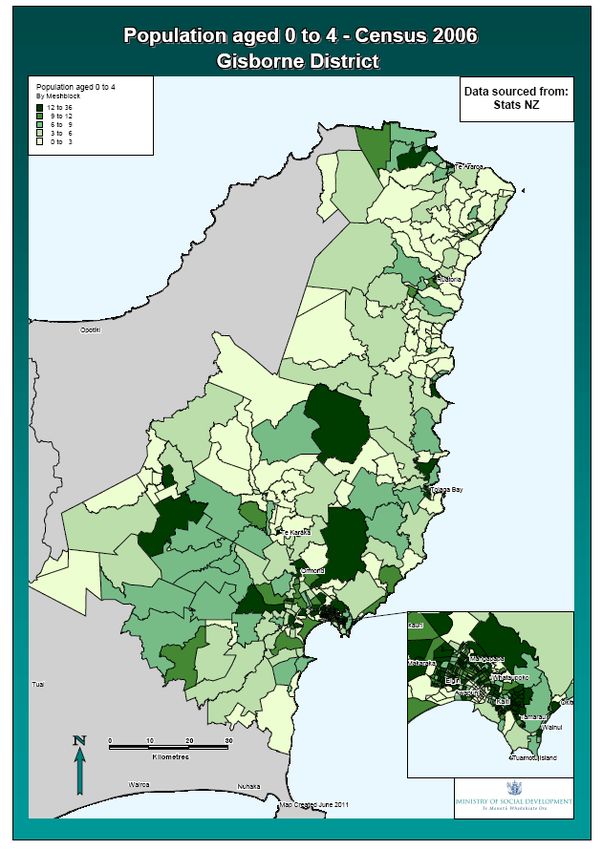
The 2006 Census recorded 11,650 children aged under 15 years living in Gisborne / East Coast
District:
• 3,650 children under 5 years (2,640 in Gisborne City, 680 in rural areas and 340 on East
Cape)
• 3,850 aged 5 - 9 years (2,730 in the city, around 710 rurally and 410 on East Cape), and
• 4,150 aged 10 - 14 years (2,990 in Gisborne City, 750 in rural areas and 410 on East Cape).
Two maps below show the population distribution by mesh-block for 0-4 years and 5-14 years
respectively.
Gisborne / East Coast District Community Profile – for the CRM Forum – 30 June 2011 Page 18 of 71Gisborne / East Coast District Community Profile – for the CRM Forum – 30 June 2011 Page 19 of 71
Gisborne / East Coast District Community Profile – for the CRM Forum – 30 June 2011 Page 20 of 71
Age distribution of Māori

The graph below shows that in 2006 the Māori population has a young age profile, with:

      •       34% under the age of 15 years (compared with 19% of non-Māori population)
      •       another 16% aged 15-24 years (compared with 10% of non-Māori)
      •       6% of Māori were aged 65 years and over (compared with 18% of non-Māori).

                                      Age distribution of Māori and non-Māori populations, 2006:
                                                           Gisborne District
    Percent
       14
                                                                                                                                              Māori
       12                                                                                                                                     Non-Māori

       10

          8

          6

          4

          2

          0
              0-4   5-9   10-14   15-19   20-24   25-29   30-34   35-39   40-44   45-49   50-54   55-59   60-64   65-69   70-74   75-79   80-84   85 and
                                                                                                                                                   over

                                                                      Age group (years)

Source: Census of Population and Dwellings, 2006

Compared with the Māori population across the country as a whole, Gisborne / East Coast District’s
Māori are slightly older than average. Nationally, 60% of Māori were aged under 30 in 2006
compared with 56% in Gisborne.

3.4           Families

In 2006, Gisborne / East Coast District was home to around 11,510 families9 living in private
households. Couples with children were the most numerous family type – at around 4,560, they
made up 40% of the district’s families (42% nationally).

      •       couples with children were most numerous in Gisborne City area units: Whataupoko (450),
              Mangapapa (430), and Te Hapara (360)
      •       couples with children, living outside the city were most numerous in Tiniroto (280) followed
              by the East Cape and Wharekaka area units (260 each).

At 3,810 families, couples without children made up around one-third (33%) of the district’s families
– a considerably smaller proportion than their 40% nationwide:

9
 In the Census, a family is defined by the presence, in one household, of a “family nucleus” (a couple, or parent(s) and
child(ren)). Child dependency is not a component of the definition. This means that a 90 year-old woman living with her
60 year-old daughter, who does not have children of her own in the same household, would be classified as “one parent
with children”.

Gisborne / East Coast District Community Profile – for the CRM Forum – 30 June 2011                                                                        Page 21 of 71
• couples without children were also most numerous in Whataupoko (430), Te Hapara (370)
and Mangapapa (360), followed by Gisborne Central (290), Tiniroto (230) and Kaiti North
(220).
Families consisting of one parent and children numbered around 3,140 in Gisborne / East Coast
District in 2006 making up more than one-quarter (27%) of all families in the district (considerably
more than the national proportion of 18%):
• the largest numbers of one-parent families lived in Gisborne City: 350 in Mangapapa, 320 in
Te Hapara, 280 in each of Kaiti South, Outer Kaiti and the Gisborne Airport area units, 250
in Tamarau and 220 in Gisborne Central.
The relative size of the populations in various parts of the district meant that all types of family were
most numerous in Gisborne City. The distribution of family types in the city was very similar to the
district as a whole (38% couples with children, 34% couples without children and 28% one-parent
families).
The family profile of rural Gisborne was quite different, with higher proportions of couples with
children and fewer one-parent families (47% couples with children, 35% couples without children,
and 19% one-parent families).
On East Cape, couples without children were lower in representation while sole-parent families
were greatly over-represented (40% couples with children, just 24% couples without children, and a
large 36% of families consisting of one parent and children).
Families by type, 2006:
Gisborne City, Gisborne rural and East Cape
Number
3,500
Couple w ith child(ren)
3,000 Couple w ithout children
One parent w ith child(ren)
2,500
2,000
1,500
1,000
500
0
Gisborne City Gisborne rural East Cape
Area
Source: Census of Population and Dwellings, 2006
Statistics New Zealand projects:
• the number of couples without children in Gisborne / East Coast District to have increased to
4,700 by mid-2011 – at that stage equalling the number of two-parent families in the district
• couples without children are expected to keep increasing (5,400 by 2021 and 5,600 by
2031)
Gisborne / East Coast District Community Profile – for the CRM Forum – 30 June 2011 Page 22 of 71• two-parent families are projected to reduce in number, from 4,700 in 2011 to 4,200 by 2021
and 3,700 in 2031
• one-parent families are expected to grow slightly to 3,700 in 2011 and 3,800 in both 2021
and 2031.
Household size and composition
In 2006, the average household size in Gisborne / East Coast District was 2.8 people, slightly
above the 2.7 national average. The district had a very similar distribution of household types to the
country as a whole:
• 69% one-family households
• 24% one-person households
• 4% ‘other multi-person households’ (the majority of which would be flats containing
unrelated people)
• a little under 4% multiple-family households.
While Gisborne City followed this pattern reasonably closely, rural parts of the district had
substantially more one-family households (76%) and fewer individuals living alone (19% of
households).
East Cape had comparatively fewer one-family households (65%) but a considerably larger number
of multiple-family households (6%).
3.5 Births and teen mothers
From 2001 to 2010, around 7,620 live births were registered to women living in Gisborne / East
Coast District – an average of 762 per year. The district exhibits a much younger pattern of
childbearing than the country as a whole, reflecting the fertility patterns of its largely Māori
population:
• women aged under 25 years were responsible for 37% of the live births compared with one-
quarter (25%) of the live births registered between 2001 to 2010 nationally
• women in their 30s produced just 36% of the district’s babies compared with 47% nationally.
Two exceptions to the district’s younger pattern of childbearing occurred among older mothers.
Gisborne women aged 40-44 years matched their national counterparts by producing 3% of the
newborns over the ten-year period, and 45-49 year-olds equaled the 0.2% around the country.
Gisborne / East Coast District Community Profile – for the CRM Forum – 30 June 2011 Page 23 of 71Live births registered by age of mother, 2001-2010:
Percent of live
All New Zealand and Gisborne District
births registered
35
New Zealand
Gisborne District
30
25
20
15
10
5
0
Under 15 15 - 19 20 - 24 25 - 29 30 - 34 35 - 39 40 - 44 45 - 49
Age of mother (years)
Source: Statistics New Zealand
From 2001 to 2010, teenagers accounted for 13% of the live births registered to mothers living in
Gisborne / East Coast District – a considerably larger proportion than the 7% nationwide. While the
proportion of Gisborne births to teenage mothers fluctuated across the ten years, it was consistently
around 60% or higher, than the national proportion.
Proportion of live births registered to teenage mothers, 2001-2010:
Percent of live All New Zealand and Gisborne District
births registered All New Zealand
16 Gisborne District
14
12
10
8
6
4
2
0
2001 2002 2003 2004 2005 2006 2007 2008 2009 2010
Year
Source: Statistics New Zealand
Over the ten years from 2001 to 2010, almost ten births were registered in the district to girls under
the age of 15 years. This equated to 0.1% of all births, the same as nationally.
Gisborne / East Coast District Community Profile – for the CRM Forum – 30 June 2011 Page 24 of 714.0 Young People 4.1 Support to stay on track The Ministry of Social Development’s East Coast Regional Plan 2010-2012 notes that school leavers from both Gisborne and Hawke’s Bay regions have lower than average qualification levels. Nationally, 30 per cent of young people leave school with National Certificates of Educational Achievement (NCEA) level three or above. Only a quarter of young people in the Gisborne region have this qualification. In Gisborne, 55 per cent of school leavers in Gisborne had NCEA level two or above and Hawke’s Bay 64 per cent, compared to New Zealand at 66 per cent. Refer to the Education section later in this report for more detailed information. There are a number of supports in place now to help more young people stay on track, as listed: Break Away School Holiday Programmes There were four providers of summertime Break Away School Holiday programmes for 11-17 year olds in the Gisborne / East Coast District through until April 2011. Three were situated in Gisborne and one in Ruatoria. The programmes provide structured leisure time activities, including physical activity during school holiday periods.10 These programmes are likely to be funded again for 2011/12 but this is yet to be confirmed. Job Ops Job Ops helps employers take on young employees they otherwise may not be able to employ. Work and Income are offering more Job Ops placements in the East Coast and are targeting areas in the region with high numbers of unemployed young people. As at 17 September 2010, 561 young people were placed into Job Ops positions in the East Coast region. Limited Service Volunteer Limited Service Volunteer programme is a six-week motivational training course run by the New Zealand Defence Force. It aims to increase the number of young people entering employment or training by improving their self-discipline, self-confidence, motivation and initiative. In the East Coast region there is additional support to the course participants once they return home. Local providers continue working with clients who were not placed into employment or training during the time of the course. Youth Transition Services Youth Transition Services (YTS) is a free service which assists young people into further education, training, work or other meaningful activities with the goal to improve long-term independence and wellbeing. Career Connexions Tairāwhiti Ltd is the YTS in the Gisborne area.11 10 For more information about Break Away go to: http://www.familyservices.govt.nz/working-with-us/programmes- services/youth-intervention/breakaway-school-holiday-programmes.html 11 For more information about Youth Transition Services go to: http://www.workandincome.govt.nz/community/yts/ Gisborne / East Coast District Community Profile – for the CRM Forum – 30 June 2011 Page 25 of 71
Mayors Taskforce for Jobs

The Mayors Taskforce for Jobs (MTFJ) is a nationwide network of Mayors working on the issues of
work and livelihood in their communities. Begun in 2000 with seven Mayors the Taskforce now has
a membership of 64 Mayors (95% of all Mayors). It focuses on youth employment and engagement
in local communities.12

4.2        Employment and occupation

The 2006 Census showed that 15-19 year-olds in Gisborne / East Coast District were around as
likely to be employed and unemployed as their peers across the country:

       •   around 23% were employed full time and 24% were employed part time,
       •   11% were unemployed and 42% were not in the labour force.

The district’s 20-24 year-olds were less likely to be employed than their age group nationally:

       •   over half (53%) were employed full time (same as nationally) and 11% were working part
           time (16% nationally)
       •   one in every ten (10%) was unemployed (versus 7% nationwide) and 27% were not in the
           labour force (23% nationally).

The calculation of unemployment rates13 for the two age groups in Gisborne / East Coast District
shows that each was higher than their national equivalent:

       •   19.5% of 15-19 year-olds in the local labour force were unemployed at the 2006 Census
           (compared with 17.8% nationally)
       •   13.1% of 20-24 year-olds in the labour force were unemployed (compared with 9.4%
           nationally).

The importance of primary industries as a source of employment for Gisborne / East Coast District
youth is also evident in the statistics. In 2006:

       •   15-19 year-olds in Gisborne were mostly employed in retail (22% of all employed in that age
           group), agriculture, forestry and fishing (19%), accommodation and food services (17%) and
           manufacturing (12%)
       •   20-24 year-olds were mostly employed in agriculture, forestry and fishing (19%) followed by
           manufacturing (14%), the retail trade (13%), construction (12%) and accommodation and
           food services (9%).

Among Gisborne’s employed youth, labouring was a much more common occupation than
nationally in 2006, with:

       •   37% of employed 15-19 year-olds (versus 26% nationally)
       •   Followed by sales worker (25%) and technicians and trade workers (14%) for 15-19 year
           olds
       •   29% of employed 20-24 year-olds worked as labourers (14% nationally).

12
     For more information about the Mayors Youth Taskforce go to: http://www.mayorstaskforceforjobs.co.nz/
13
     Unemployed as a proportion of the labour force (defined as the employed plus the unemployed).

Gisborne / East Coast District Community Profile – for the CRM Forum – 30 June 2011                   Page 26 of 71
• Followed by 20% as technicians and trades workers, 11% in professional occupations and
10% as sales workers for 20-24 year olds.
4.3 Impact of the Recession on East Coast Youth
The analysis in the Youth and Employment Result Card draws on a research report by Work and
Income (April 2009) entitled The Impact of the Recession on East Coast Youth. The Report noted:
• a higher uptake of Work and Income benefits than any other age group
• difficulties competing in the labour market due to their age, skills and/or work experience
• instances of employer prejudices towards young people when laying off and recruiting, due
to the perceived ability to bounce back and the perception that young people don’t have
the work ethic
• young people moving back ‘home’ to save costs – home being New Zealand, their
provincial hometown or back in with their parents
• hundreds of young people not maximising their skills and potential.
4.4 Income support
At the end of May 2011, around 300 Gisborne / East Coast teenagers were receiving some form of
income support, including supplementary benefits:
• around 20 fewer than in 2009 and around 40 fewer than in 2010.
In 2011, the main groups of teenage income support recipients in Gisborne / East Coast were:
• just over 80 recipients of the Unemployment Benefit (in Training) (27% of all teenage
recipients in the district) – a similar number to 2009 but 10 fewer than in 2010
• almost 80 receiving the DPB Sole Parent14 (26%) – around 10 fewer than two years earlier
• around 40 receiving the Invalid’s Benefit (12%) – little changed from either 2009 or 2010
• around 40 receiving the Unemployment Benefit15 (also 12%) – also little changed from either
of the two preceding years
• almost 30 receiving the Independent Youth Benefit (10%) – little changed from 2009 but 10
fewer than in 2010
• around 30 Sickness Beneficiaries16 (9%) – little changed over the two previous years.
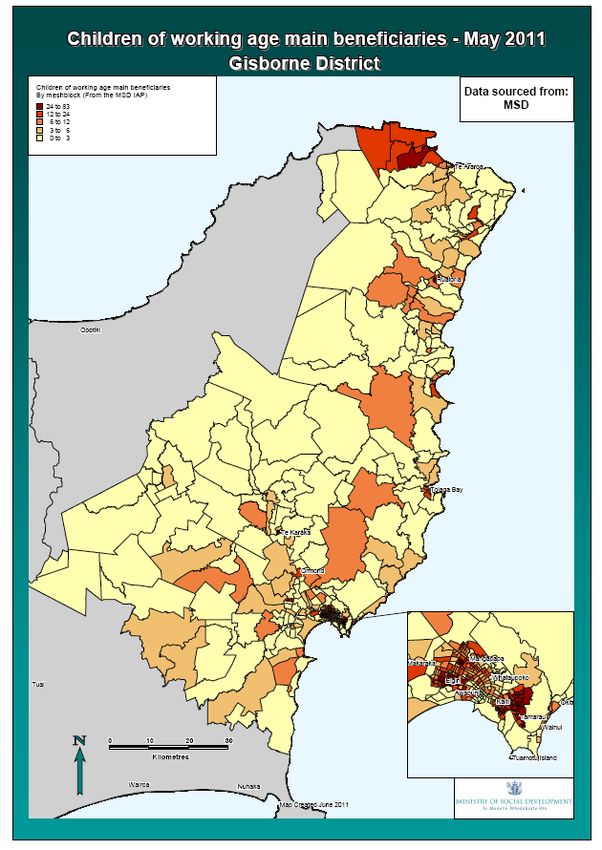
Between them, Gisborne District’s teenage income support recipients had around 90 children in
May 2011, almost all of whom were in the families of DPB Sole Parent13 recipients.
The Ministry of Social Development’s East Coast Regional Plan17 notes that young people are often
the first to feel the effects when the economy changes. A number of ways to help them be ready to
14
Includes DPB Sole Parent and Emergency Maintenance Allowance
15
Includes Unemployment Benefit and Unemployment Benefit Hardship
16
Includes Sickness Benefit and Sickness Benefit Hardship
Gisborne / East Coast District Community Profile – for the CRM Forum – 30 June 2011 Page 27 of 71take advantage of opportunities in the labour market arise have been developed, however services
such as Youth Transition Services were not listed as available in CHB.
4.5 Cigarette smoking
In 2006, Gisborne / East Coast District’s youth were also much more likely to be regular smokers
than their peers around the country with:
• 29% of 15-19 year-olds smoking regularly (versus 19% nationally)
• 45% of 20-24 year-olds smoking regularly (compared with 30% nationwide).
4.6 Suicide
From 1992 to 2007 inclusive, a total of 104 Gisborne / East Coast District residents took their own
lives. Of those, 24 of the suicide deaths were young people aged between 15 and 24 years. The
largest number of youth suicides in any one year was six in 1995. No youth suicides occurred in the
district in seven of the 16 years.
5.0 Older People
Gisborne / East Coast District, like New Zealand as a whole, is predicted to experience and aging
population in years to come. This demographic shift needs to be factored into strategic plans and
policies.
5.1 Gisborne’s Older Person’s Policy
In April 2010 the Gisborne District Council adopted an Older Person’s Policy to support Gisborne
District Council’s commitment to be a district that: values its older people, promotes their
meaningful contribution to the community and facilitates a positive ageing experience for all. It
covers issues of inclusion, promotion of accessible services and resources and the sharing of
information between organisations involved with providing services for older people and promoting
active and positive lifestyles for older people.
5.2 New Zealand Positive Ageing Strategy
The New Zealand Positive Ageing Strategy 2001 established 10 principles as a framework for
integrating policies and programmes across the government sector. The Minister for Senior Citizens
has identified three priority areas to champion positive ageing as follows:
• employment of mature workers - encouraging flexible work options and opportunities for
older workers to remain in work
• changing attitudes about ageing - promoting inter-generational programmes and reinforcing
the important contribution older people make to their communities
17
For more detail go to: http://www.msd.govt.nz/about-msd-and-our-work/publications-resources/corporate/regional-
plans/2010-12/east-coast/index.html
Gisborne / East Coast District Community Profile – for the CRM Forum – 30 June 2011 Page 28 of 71• protecting the rights and interests of older people – by raising awareness of elder abuse and
neglect prevention.18
5.3 Ministry of Social Development’s East Coast Regional Plan
The East Coast Regional Plan has a priority of “Improved quality of life for older people”. The Plan
notes that MSD is working with other government agencies to make it easier for older people to
access government services. MSD is also working nationally and regionally with non-government
organisations, such as Age Concern and Grey Power, to ensure seniors are getting all the services
they need. The Plan notes that MSD has the following services in place for older people:
• Senior’s Website - that people can apply online for New Zealand Superannuation and also
access a range of information about our services and the services offered by others
• SuperGold Card - provides a range of discounts to cardholders, including public transport.
Work is underway to increase the number of discounts available outside the main cities, and
meeting with local business associations and Chambers of Commerce to find more business
partners and explore other opportunities to develop the programme.19
6.0 Health
6.1 Mental health
In 2008, around 1,920 Gisborne / East Coast District residents commenced mental health treatment
within the public health system:
• 52% of those clients were Māori
• younger age groups made larger contributions to the number of clients commencing
treatment in 2008 in Gisborne than they did nationally
• children under the age of 15 made up 15% of clients from Gisborne (10% nationally)
• 15-29 year-olds made up 33% (30% nationally)
• 30-44 years accounted for 26% of the Gisborne clients (29% nationally)
• 45-59 year-olds made up 16% (18% nationally)
• 60-74 year-olds and those over the age of 75 each accounting for 5% of the Gisborne
clients.
Mental health teams had 2,590 clients from Gisborne commence treatment during 2008:20
• Both locally and nationwide, the Community Team21 saw the largest number of clients (39%
and 42% respectively)
18
For more information about Government’s Positive Ageing Priorities go to: http://www.msd.govt.nz/what-we-can-
do/seniorcitizens/positive-ageing/priorities/index.html
19
For more information about the East Coast Regional Plan go to: http://www.msd.govt.nz/about-msd-and-our-
work/publications-resources/corporate/regional-plans/2010-12/east-coast/
20
One person can be seen by more than one team so the number of clients seen by teams will be larger than the number
of individual clients from a territorial authority.
21
Community teams provide non-residential assessment and treatment services, including outpatient services.
Gisborne / East Coast District Community Profile – for the CRM Forum – 30 June 2011 Page 29 of 71• Taking into account all alcohol and drug teams, including those established to treat certain
age or ethnic groups, alcohol and drug referrals were the second most common (20% of
clients in Gisborne and 18% nationally)
• The Child, Adolescent and Family Team22 saw 19% compared with 11% nationwide
• The Kaupapa Māori Team23 saw 10% of clients (3% nationwide)
• The Psychogeriatric Team saw 6% of clients (versus 5% nationally).
Clients commencing mental health treatment by main teams seen, 2008:
All New Zealand and Gisborne District
Percent of clients
45
All New Zealand
40 Gisborne District
35
30
25
20
15
10
5
0
Community Team Alcohol and Drug Teams Child, Adolescent and Family Team Kaupapa Māori Team Psychogeriatric Team
Type of team seen
Source: New Zealand Health Information Service
6.2 Plunket WellChild and immunisation
The Royal New Zealand Plunket Society estimates that it provides WellChild services to around
92% of the country’s newborns. In 2010, the society reported 373 ‘new baby’ cases in Gisborne /
East Coast District (just 48% of the total live births registered to mothers in the district that year).
This indicates that a considerable number of Gisborne parents access other providers for their
WellChild services. In 2010, 60% of the Plunket babies in Gisborne were Māori.
Plunket records showed that in 2010, 35% of Plunket’s new baby cases were living in an NZDep
decile 10 area (the 10% most socio-economically deprived in the country):
• more than three-quarters (78%) of these babies were Māori
• another 29% of Gisborne’s Plunket babies were living in decile 8 or 9 areas.
In 2010, the Royal New Zealand Plunket Society made just over 480 formal written referrals in
Gisborne / East Coast District. The most common reasons for referral were:
• child behaviour (29% of all referrals)
• parenting practice (14%)
22
Child, adolescent and family teams provide assessment and treatment services to people aged 0-19 years inclusive.
Includes inpatient, residential or community-based child, adolescent and family teams.
23
Kaupapa Māori teams provide assessment and treatment services to people within a Māori kaupapa. Includes
inpatient, residential or community based teams within a Māori kaupapa (including child, adolescent and family, youth
specialty and psychogeriatric services).
Gisborne / East Coast District Community Profile – for the CRM Forum – 30 June 2011 Page 30 of 71• social needs24 (9%).
They were followed by immunisation, growth issues and safety and injury prevention (6% each).
The majority of referrals (65%) were made to Plunket Kaiawhina, with another 11% going to ‘other’
health professionals25.
In addition, Plunket made around 4,860 less formal recommendations in Gisborne / East Coast
District in 2010:
• 34% related to immunisation
• 16% for dental health
• 11% for child health and illness
• 10% for ‘community linkages’26 (10%).
Around 42% of these recommendations were made to general practice teams, 12% went to dental
services 9% to Plunket nurses, 9% to other Plunket services, 8% to other health professionals and
7% to the Plunket Group.
Based on reports from parents, Plunket assessed that 79% of the children in its client families in
Gisborne / East Coast District were fully immunised in 2010 – a smaller proportion than the 85%
nationally.
Complete immunisation was slightly more likely for Māori children in Gisborne / East Coast District
than nationally (82% compared with 78%).
6.3 Cigarette smoking
The 1996 and 2006 Censuses asked people aged 15 years and over about their cigarette smoking
habits. Nationally, the proportion of adults smoking cigarettes fell between censuses, from 24% in
1996 to 21% in 2006. However, in Gisborne / East Coast District, there was no change over the ten
years. In 2006, compared with New Zealand as a whole, Gisborne adults were:
• considerably more likely to be regular smokers (30% of the population aged 15 years and
over, compared with 21% nationally)
• as likely as other New Zealand adults to be ex-smokers (22% both locally and nationally)
• much less likely to have never smoked (48% versus 57% nationwide).
There are considerable differences in smoking habits across the district in 2006:
• 28% of the adults in Gisborne City were cigarette smokers
• 30% smoked in rural parts of the district
• 42%on the East Cape were regular smokers.
24
Includes housing issues, enrolment into early childhood educational facilities, access to finance/budgeting services,
access to food sources, clothing and other necessities.
25
Includes family planning, midwives, dietician, asthma clinic, diabetes clinic, physiotherapist, lactation consultant
(non-Plunket), pharmacist, ear caravan, community nurse, specialist nurse, DHB/hospital services in the community.
Health professionals have recognised health qualifications gained through a formal course of study.
26
Includes facilitation of social networking, support and education for parents and/or caregivers through identification of
and access to appropriate, acceptable and available linkages as part of building social capital. Includes interpreter
services.
Gisborne / East Coast District Community Profile – for the CRM Forum – 30 June 2011 Page 31 of 71Across the country, a considerably higher proportion of Māori than non-Māori reported regularly
smoking cigarettes:
• in Gisborne, with 44% of the district’s Māori residents were cigarette smokers compared with
20% of non-Māori. Nationally, the proportions were 42% and 18% respectively
• in Gisborne, 38% of Māori adults had never smoked regularly. This was similar to the 39%
of Māori nationally, but a much smaller proportion than the 55% of non-Māori residents of
the district who had never smoked
• Gisborne’s Māori were also less likely than non-Māori to be ex-smokers (19% compared
with 25%).
For information about youth smoking habits, see Youth section earlier in this report.
6.4 Life expectancy
Statistics New Zealand’s life tables show that life expectancy in Gisborne / East Coast District is
lower than average. A newborn baby boy has a life expectancy of 73.8 years while a newborn girl
can expect to live 78.0 years (both 4.4 years fewer than the New Zealand average for each sex).
7.0 Economic Wellbeing
7.1 Socio-economic deprivation
The NZDep2006 index of deprivation27 shows that Gisborne / East Coast District is considerably
more socio-economically deprived than New Zealand as a whole. Across the country, roughly equal
numbers of people live in areas at each of the 10 levels of deprivation. This means that at the time
of the 2006 Census, 50% of the national population lived in decile 1 to 5 areas (the less deprived in
New Zealand). In Gisborne / East Coast District, just 28% of residents lived in those areas.
27
Salmond C, Crampton P, Atkinson J, NZDep 2006 Index of Deprivation. The NZDep2006 index of deprivation was
created from data from the 2006 Census of Population and Dwellings. The index describes the deprivation experienced
by groups of people in small areas. Nine deprivation variables were used in the construction of the index, reflecting eight
dimensions of deprivation. The variables used were the proportions of people: aged 18-64 receiving a means-tested
benefit; living in households with income below an income threshold adjusted for household size; not living in own
home; aged less than 65 living in a single-parent family; aged 18-64 unemployed; aged 18-64 without any qualifications;
living in households below a bedroom occupancy threshold adjusted for household size; with no access to a telephone;
and with no access to a car.
Gisborne / East Coast District Community Profile – for the CRM Forum – 30 June 2011 Page 32 of 71You can also read