Gisborne to Wairoa Rail Reinstatement Feasibility Study Freight Assessment - BERL
←
→
Page content transcription
If your browser does not render page correctly, please read the page content below
Gisborne to Wairoa Rail
Reinstatement Feasibility Study

     Freight Assessment

               1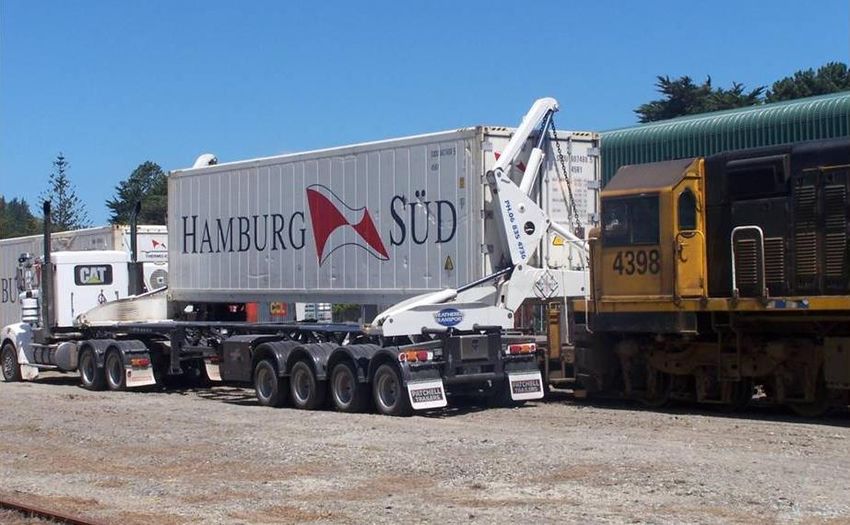
Cover Photo Captions:
Freight train crossing Poverty Bay flats carrying general freight plus 16x chilled containers of produce from the
Poverty Bay flats directly to the container port at Napier. Photo: Aberail, 27 February 2012.
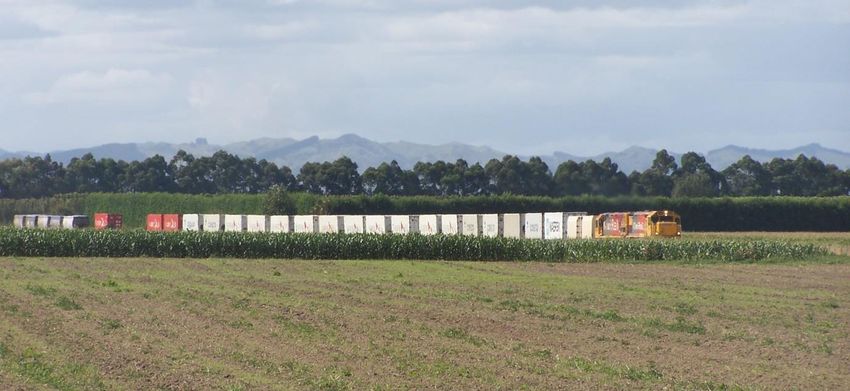
Weatherell Transport Ltd truck with side lifter, loading full squash container onto railway wagon at Gisborne
Railway Station. Photo: Aberail, January 2012
2Contents
1.0 Introduction .................................................................................................................................... 5
Purpose of this Report ....................................................................................................................... 5
Background ....................................................................................................................................................... 5
Freight Assessment Approach .......................................................................................................... 5
Comparison with freight quantities in 2012 .................................................................................. 6
2.0 Current freight ................................................................................................................................ 7
2.1 Outbound............................................................................................................................................... 7
2.2 Inbound .................................................................................................................................................. 7
3.0 Projected freight ............................................................................................................................ 8
3.1 Containerised Outbound Freight ...................................................................................................... 8
4.0 Logs .................................................................................................................................................. 11
4.1 Rail options for logs ........................................................................................................................... 13
5.0 Inbound ........................................................................................................................................... 14
5.1 Aggregate – sealing chip, coastal and river protection .............................................................14
5.2 Aggregate – concrete production ...................................................................................................14
5.3 Bulk Cement ........................................................................................................................................14
5.4 Fertilizer................................................................................................................................................14
5.5 Other...................................................................................................................................................... 15
5.6 Empty or back filled containers ...................................................................................................... 15
6.0 Currently available freight quantities and revenue .......................................................... 16
6.1 Current Container Numbers .............................................................................................................16
6.2 Monthly Distribution of Currently Available Containers ............................................................16
6.3 Current Container Indicative Revenue ........................................................................................... 17
7.0 Forecast freight quantities and revenue for 2025 ............................................................. 19
7.1 Forecast Container Numbers ...........................................................................................................19
7.2 Monthly Distribution of Forecast Container Numbers for 2025 ..............................................19
7.3 Forecast Container Revenue ........................................................................................................... 20
7.4 Revenue from additional log wagons ............................................................................................. 21
8.0 Possible Additional Freight in 2025 ...................................................................................... 22
8.1 Other Horticultural Produce ........................................................................................................... 22
8.2 Wine ...................................................................................................................................................... 22
8.3 Wool...................................................................................................................................................... 22
8.4 Kiwifruit ............................................................................................................................................... 22
8.5 Inbound Logs ...................................................................................................................................... 23
9.0 Rail freight considerations ....................................................................................................... 24
9.1 Containerisation and biosecurity ................................................................................................... 24
39.2 Confidence in service ....................................................................................................................... 24
9.3 Marshalling and sidings .................................................................................................................... 24
9.4 A reliable supply of empty containers and log wagons ........................................................... 25
9.5 Timeframes ......................................................................................................................................... 25
9.6 Competitive pricing and service ..................................................................................................... 25
10.0 Gisborne Log Shuttle ...................................................................................................... 26
41.0 Introduction
Purpose of this Report
This report has been prepared as one of two potential uses of the rail line between Gisborne and
Napier. It forms part of the Gisborne –Wairoa Rail Feasibility Study being undertaken by BERL and
other parties. The Wairoa to Napier section of the rail track has been restored but is yet to operate
on a commercial basis while the necessary freight infrastructure is completed in Wairoa.
This feasibility study concerns the Wairoa to Gisborne section of the railway but for freight purposes
the freight element of the Feasibility Study concerns the movement of freight between Gisborne and
Napier. There is very little freight traffic between Gisborne and Wairoa.
Background
The Gisborne to Napier section of the rail network was last operated in 2012 and ceased use after a
series of washouts in March 2012. In 2012 KiwiRail was of the view that the level of freight to and
from Gisborne did not warrant the reinstatement of the washed out sections of track. The KiwiRail
position was outlined in an assessment of the commercial viability of the line, dated 18 May 2012.1
At the time KiwiRail believed that fertiliser represented approximately 50% of all freight carried on
the line and that the best prospect for additional freight was from forestry, specifically logs.
Prospective log revenue was forecast to increase significantly from 2019 and then for a period of
only seven to 10 years.2 The annual revenue was in the order of $1 million and the forecast revenue
was estimated at $2.5 million. This level of revenue was not considered to be sufficient to justify
reinstatement of the line.
Freight Assessment Approach
To determine the current and potential freight demand, producers in the Gisborne region were
canvassed to determine what is being produced and how it is transported. The extent to which this
freight could move to a rail service was then analysed. Some producers were able to provide
information on projected production.
Rail offers some particular advantages over road transport in the areas of reduced service
interruption and increased biosecurity, capacity, and safety. Some of these advantages relate to
containerisation which is increasingly in demand due to convenience and to the ability to meet
higher biosecurity requirements.
1
Napier Gisborne Line – Assessment of the Commercial Viability of the Line, KiwiRail, 18 May 2012
2
Ibid, page 3
5Comparison with freight quantities in 2012
The 2012 report produced by KiwiRail stated3 that 44,325 tonnes of freight was moved on the line in
the first nine months of financial year ended 30 June 2012.
Table 1 Comparison with freight quantities in 2012
Actual Forecast
Year 2012 2012 2020 2025
(9 months) (Annualised) (excl logs) (excl logs)
Tonnes 44,325 59,100 100,950 154,700
The 2012 report noted that normally over 50% of the tonnage was fertilizer.4 No fertiliser is included
in the 2020 or 2025 forecast tonnage.
Freight tonnage currently available and forecast is exclusive of logs, of which there is a large
number needing to be transported out from Gisborne. During the peak season the available supply
of other freight exceeds the capacity of a rail service running five trains per week with 24 containers
per train. For the remainder of the year spare capacity on the rail freight service can be filled with
log wagons, making up full train loads all year round.
Revenue calculations in Sections 6 and 7 of this report include the assumption that logs will fill any
spare capacity on rail freight services. Alternative scenarios whereby the freight supply is lower than
forecast, and a seven trains a week service are also examined.
The currently available containerised freight and forecast containerised freight for 2025 compare
very favourably with the freight carried by rail in 2012 as detailed above.
3
ibid, page 4
4
Ibid, page 9
62.0 Current freight
The existing transport network available for freight consists of road freight on trucks and shipping
from Gisborne Port. Since the closure of the railway service in 2012, almost all non-log products
transported out of the Gisborne region have been taken by road. Export products are taken by truck
to ports in Napier or Tauranga, with some to Wellington or Auckland. There is also domestic freight
for the South Island via Wellington that that was previously be sent by rail but is now sent by road.
Shipping out of Gisborne is constrained by the exposure of the port to the southerly swell and small
dock area. Currently the port deals mostly in logs, and there are a small number of reefer ships that
service Gisborne.
The weight designations on the region’s arterial roading network between Gisborne and Napier, and
much but not yet all of the way through to the north, has been raised recently to allow High
Productivity Motor Vehicles (HPMV), which are trucks up to 60 tonnes. This change in designation
enables large containers to travel by road. However, the highways from Gisborne are narrow and
winding with steep hills. In practice, slower speeds are required on the hill sections with increased
safety risks and it is likely that vehicles of this size will accelerate the wear and tear on the roads.
Safety is an issue given the significant community concern about the number and size of heavy
vehicles currently using the highway.
A recent inland port development at Kawerau is encouraging freight forwarders to consider trucking
from Gisborne to Kawerau to transfer to rail for the last 93kms to Tauranga.
Air freight is not an option for large volumes of freight as the airport cannot accommodate aircraft
of the required size. The cost of airfreight precludes its use for all but small and high value products
such as live crayfish.
2.1 Outbound
There has long been a perception that the primary form of freight suitable for rail transportation out
of the Gisborne Tairāwhiti area is logs. Since 2012 there have been a number of changes in the
nature, quantity and type of freight suitable for transport by rail from the area. The key
developments have been:
Significant growth of seasonally intensive horticulture, particularly new varieties of apples
and new crops such as persimmons and gold kiwifruit
Reopening of the former Prime sawmill, as Far East Sawmill, producing appearance grade
kiln dried timber.
While logs remain a significant export product from the area, other primary products needing to be
transported from Gisborne include processed timber, fruit and vegetables, meat, wool and wine.
A significant number of the crops produced are under forward contracts, which assists with
planning of logistics requirements ahead of the next season. Ensuring that the supply chain
arrangements are in place ahead of the next season is an important matter.
2.2 Inbound
Inbound freight to Gisborne is much smaller than outbound. A primary inbound item is therefore
empty containers. Aggregate and fertilizer are the main inbound products.
73.0 Projected freight
The current and expected freight tonnages for each type of freight are outlined below for use in the
calculation of the freight available and the viability of the rail service. The impact of projected
increases in freight quantities over the next few years is referred to in a separate sub-section.
3.1 Containerised Outbound Freight
3.1.2 Processed Timber
There are two timber processors in Gisborne, Juken Nissho (JNL) and
Far East Sawmill, which operates from the former Prime Sawmill. Both Processed wood
Average 35 x 40ft per
plants are located alongside the rail line at Matawhero, with a rail
week
siding already into the Far East Sawmill site and one close to the JNL 1,750 per year
site. 36,750 tonnes
Expected to double in
JNL has long had a presence in Gisborne and currently produces next few years
approximately 20,000 tonnes/cubic meters of Structural Laminated
Veneer Lumber each year. This production is equivalent to about 1 40ft container a day, 5 days a
week, representing 250 containers and 5,250 tonnes per annum.
An important development has been the reopening of the old Prime sawmill site, with the support of
ECT/Eastland Group, by Far East Sawmills. Far East produces kiln dried appearance grade timber
for a range of export markets, particularly Northern Europe, Asia, North America and Australia. The
finished product is sent by truck to Tauranga but the company would prefer to load containers for
transport on rail to Napier Port. The mill produces the equivalent of 6 containers a day, 5 days a
week, on a single shift. This level of production equates to about 1,500 containers a year or 31,500
tonnes.
3.1.2 Meat
The major meat processor in Gisborne is located adjacent to the railway Meat
at Matawhero. Its requirement is for a service to transport containers Average 17 x 20ft per
week
to Napier, totalling 14 to 20 20ft containers a week all year round.
880 per year
Without significant freezer storage on site it is important that meat is 17,600 tonnes
transported soon after processing, five days a week. Expected to be
consistent
Three to four containers a week are chilled meat, with the rest being
frozen meat. The meat is packed in cartons with each container
holding about 20 tonnes.
There is a seasonal production period operating a double shift for six months, from October to
March, to handle the peak stock season.
3.1.3 Apples
Apples for export markets are a major new crop for the Gisborne area. Apples
The growing season is better than Hawke’s Bay and harvest can start Average 35 x 40ft per
week in peak season
two weeks ahead of other areas. The area planted in apples has grown
357 per year
from just on 250 ha in 2016-17 to 400 ha in 2018-19, with further large 7,140 tonnes
increases in the areas to be planted over the next few years. While a Expected to triple by
2025
small crop can be harvested two years after planting, heavier crops are
available from year three.
8The apple crop is transported out of Gisborne starting in February but most of the crop is moved
over the May to July period. As the total crop increases it is expected that additional cool store
capacity will be built, resulting in apples being held in the area until as late as September.
An average of seven to eight 40ft containers a day over a four to five days week will be required
during the peak export period (May to July) in 2020, increasing to twelve to fourteen per day by
2022, and over twenty per day by 2025.
3.1.4 Squash
Gisborne is one of the major squash growing areas in New Zealand. The
Squash
harvest season generally runs from Christmas until early/mid-April.
Average 75 x 40ft per
Squash is a heavy bulk volume product ideal for transporting by rail in week in season
fully loaded 40ft containers. During the 2011/12 season, fully loaded 1,070 per year
30,000 tonnes
trains of squash went from Gisborne to Napier Port. Over recent years
Expected to be
the total amount grown has varied but is generally between 20,000 and consistent
40,000 tonnes per season, depending on growing conditions, with an
average of 30,000 tonnes.
Up to 65 percent of Gisborne squash has been exported in wooden bins on reefer boats from
Eastland Port with the rest sent by road to Napier and Tauranga. Containers are used but until now
have not been filled fully due to road transport weight restrictions. Part filled containers have
required final packing and sealing at certified transhipment deports in Napier and Tauranga. This
involves the management of significant biosecurity risk. A move to packing and sealing full
containers in Gisborne offers significant benefits.
Over the course of the squash export season the total number of containers is expected to be
around 1,070, based on current production. This number could increase to 1,250 over the next five
years but, for the purpose of this feasibility study, are projected to remain at the current level.
3.1.5 Maize/Corn
In the 2019 season 44,400 tonnes of maize and maize seed was
Maize/Corn
produced plus 20,000 tonnes of processed sweetcorn and 8,000 tonnes Average 6.5 x 20ft per
of fresh sweetcorn. This crop provides both seasonal, December to week
April, fresh product freight and all year round freight of processed 340 per year
6,800 tonnes
product. The export product is transported by truck in 20ft containers Expected to be
through to Napier and Tauranga for markets in the Pacific and South consistent
East Asia. About 400 containers a year for export are currently sent out
by road, with around 340 containers, totalling 6,800 tonnes, sent to Napier. Typically there are 12 to
14 containers a week during the December to April season and seven to nine containers a week for
the rest of the year.
3.1.6 Citrus/Lemons
The total weight of citrus crops in the Gisborne area is 25,000 tonnes. Citrus/Lemons
Current indications are that a total of about 35 20ft containers of Average 3 x 20ft per
lemons are sent to Napier during the May to July season. This equates week
35 per year
to about three containers a week, representing a total of about 700 700 tonnes
tonnes which is less than 3 percent of total citrus production in the Expected to be
region. consistent
Once a rail service, with associated freight forwarding, is well
established, then there is potential to secure further citrus products for transport by rail. As there
9are a number of smaller growers and pack houses, there will be a requirement for a party to
coordinate consolidation of crops to maximise efficiencies over road transport. During the four to
five month season around 100 tonnes a day is transported out of Gisborne, a significant percentage
to Hawke’s Bay.
3.1.7 Processed Food and other Products
Processors of horticultural and other manufactured products based in Processed Food and
Gisborne produce at least 2 containers a week, year round. Both 20 ft other products
Average 2 x 20ft per
and 40 ft containers are used. All export product is shelf stable and is week
not time sensitive other than to meet shipping timetables. 100 per year
2,000 tonnes
Expected to increase
104.0 Logs
There is a view in Gisborne that the annual log harvest may rise to up
Logs
to five million tonnes over the next few years as the ‘wall of wood’
Between 347,000 and
reaches maturity. Currently available statistics do not support this 825,000 tonnes in
view. The most current wood availability forecasts for the East Coast excess of Eastland
Port’s 3 million
considered five harvest scenarios5. Of the five scenarios the more likely
capacity available each
are scenarios two and three. Both scenarios project a smoothing of year from 2020 to
harvest volumes, particularly by the large forest owners, to produce 2034.
regular cash flow and ensure ongoing work for harvest contractors6.
Scenario one (large-scale owners harvest at stated intentions and small scale owners harvest at 28
years) does indicate wood availability in excess of 5 million tonnes from 2021 to 2024 but it is
considered by many in the sector that there are not sufficient harvesting crews to harvest that
quantity of timber. It is also noted that these projections were prepared in 2014 and since that time
the sector has been harvesting early to take advantage of high log process. Early harvesting is likely
to have taken the top off scenario one forecasts.
Figure 1 Wood harvest scenario one
Scenario two (large-scale owners harvest at stated intentions then at an overall non-declining yield
and total wood availability is modelled at a non-declining yield over a 28 year rotation) projects
recovered volumes of 3,347,000 cubic metres per annum from 2020 until 2050.
5
Wood Availability Forecasts – East Coast 2014, Ministry of Primary Industry, May 2015
6
For the purposes of the rail feasibility study non pinus radiata species (Douglas fir and others) have been ignored.
Projected recoverable volumes were expressed as cubic meters and it is assumed that 1 cubic metre of
recoverable pinus radiata equals 1 metric tonne in weight.
11Figure 2 Wood harvest scenario two
Scenario three (large-scale owners harvest at stated intentions then at an overall non-declining
yield and total wood availability is modelled at a split non-declining yield over a 28 year rotation),
projects a 3,825,000 cubic metres from 2020 until 2036 with a reduction to 2,259,00 from 2039 and
then increasing to 3,396,000 cubic metres from 2048.
Figure 3 Wood harvest scenario three
Eastland Port has a capacity of three million tonnes of logs per annum, before any reduction due to
periods when the port is closed due to adverse weather conditions.
It is also noted that any significant fall in log prices may result in some forests to the north of
Gisborne, accessed via SH35, becoming uneconomic to harvest.
12MPI has advised that planning in underway for the next wood availability forecast which will be
conducted in 2020 and published in 2021.
4.1 Rail options for logs
Three rail options have been identified for the transport of logs out of Gisborne
4.1.1 Option A - Top up of containerised freight trains
Where a train of 24 wagons of containerised may not be full to capacity, particularly in the April to
December period, then the required number of wagons could be made up by hauling log wagons.
This option ensures that there is sufficient freight to provide a daily rail service from Gisborne to
Napier. Organisation of the freight could be undertaken by a Gisborne based freight forwarder.
It is possible to build the train above 24 wagons, say up to 28 wagons, with the number of log
wagons increasing when container freight is lighter than expected.
This option also reduces the number of trucks on the road as each log wagon represents two truck
movements.
4.1.2 Option B - Dedicated log train
Under the assumption that the preferred size of a log train from Gisborne to Napier is 24 wagons
with each wagon carrying 30 tonnes of freight, then a once daily service would require 480 tonnes,
about 720 cubic metres, of logs. This assumes that each train takes about four hours each way with
some time to drop off full wagons and pick up empty wagons for the return trip.
These figures suggest it is possible to set up a dedicated daily log service, using large scale forest
owners as contracted customers, to implement a regular log service. Such a service is unlikely to
have any material impact on Eastland Port but will serve three important purposes:
1. Removes 48 logging truck movements per day (approximately 12,480 per annum) between
Gisborne and Napier
2. Provides a reliable transport option when weather conditions affect Eastland Port
3. Spreads the capital cost of reinstatement over two trains a day rather than one train.
4.1.3 Option 3 - A combination of Options 1 and 2
Under Option 3 both Option 1 and Option 2 are implemented.
The benefits of Option 3 are the combined benefits of Options 1 and 2. It maximises the number of
rail services to spread the capital investment in the track infrastructure and rolling stock over move
freight and it maximises the reduction in truck movements on the highway between Gisborne and
Napier.
With development of the freight service it might be attractive to add logs out of Wairoa to Napier,
depending on the loads and the requirement for logs etc.
135.0 Inbound
For the purposes of this feasibility study no provision has been made for income from inbound
freight. Potential freight has been identified and is summarised below. The freight providers spoken
to during the consultation stage expressed interest in using a reinstated rail service but wish to see
it in operation before making any commitment. If the track is repaired and the line reopened then
the rail operator can discuss freight options with these providers.
5.1 Aggregate – sealing chip, coastal and river protection
The demand for aggregate in the Gisborne area has increased significantly in recent years due to the
formation of forestry roads, and a significantly higher level of road maintenance due to the heavy
road usage by trucks. There is a lack of local sources of key grades and demand for aggregate from
outside Gisborne is being assessed currently by sector participants and technical advisers. There is
also a requirement for rock boulders for coastal and river protection works.
It is noted that the Tairāwhiti District does not contain any high strength Torlesse Terrane
“greywacke” sandstone. There are some “greywacke-like” sandstone sources that have slightly lower
strength and durability. The net result is likely to be the use of a mix of locally and Hawke’s Bay
sourced aggregate to supply Gisborne and north to East Cape.
Once reinstated, there will be an ongoing demand for ballast to maintain the rail line.
5.2 Aggregate – concrete production
Aggregate for concrete comprises a mix of different sizes. Much is brought in from Hawke’s Bay
sources every week with the annual amount over 12,000 tonnes.
Around 250 tonnes of aggregate a week is trucked in from Nuhaka, which used to be transported by
rail. The shorter distance from Nuhaka makes rail less likely as an option today, but supplies from
the Hawke’s Bay provides a possible option for rail transport.
5.3 Bulk Cement
Over 75 tonnes a week, year round, of bulk cement is brought in by truck from Napier Port with daily
deliveries to maintain supplies to keep up with production and avoid holding silos dropping to low
levels.
5.4 Fertilizer
Over 30,000 tonnes a year of fertiliser is transported into Gisborne from Napier and Waipukurau. It is
transported by road throughout the year, typically at a rate of around 120 tonnes every week day,
plus additional amounts during seasonal peak periods. Fertilizer is also trucked in from Tauranga.
Local companies have experience with using top loading containers, with scope for the use of these
containers to carry product to Wairoa and Gisborne. These 20ft containers require suitable unloading
equipment. The containers can also provide short term storage before being off loaded for delivery
by trucks for on farm use.
Fertiliser was a significant part of the total inbound freight carried by rail leading up to the closure
of the line in 2012, with most going to a depot at Matawhero. The rail siding that runs into the depot
14at Matawhero is still in place, but the rail infrastructure at the Napier plant has since been removed.
KiwiRail has disposed of the fertiliser wagons used on the line. Today fertiliser is carried by road
transport as a back load to woodchip trucked south.
The initial projected amount of fertiliser available for rail transport is 6,000 tonnes. This is
equivalent to about 300 20ft containers, spread through the year.
5.5 Other
At least one sizeable manufacturer has expressed the view that its input material, which now arrives
in 40ft containers from Napier by road, could be transported by rail. It is also interested in using rail
for export products, sent out mostly in 20ft containers on a regular basis through Napier Port.
The area’s largest wine producer brings in 500 tonnes of inputs, and 250 tonnes of wine from
Hawke’s Bay each year.
5.6 Empty or back filled containers
With more freight travelling outbound, empty containers is important inbound freight. These
containers can transported be more efficiently by rail than road, if the trucks are no longer required
to carry the outbound goods.
156.0 Currently available freight quantities and revenue
6.1 Current Container Numbers
Based on the currently available freight identified by freight producers and logistics companies, the
following summary of freight quantities and container numbers has been prepared. It is the view of
the authors of this study that this currently available freight is sufficient to justify a train of 24
wagons every week day (5 days a week, 260 days a year). A total of 4,532 containers (100,950
tonnes) of freight would be available for 2020, based on confirmed container numbers for 2019.
The currently available freight could be supplemented as required with log wagons to make up a
train of 24 wagons every day.
Table 2 Amount of available freight 2020
Tonnes per Number of containers
Product container 20ft 40ft Total tonnes
Processed timber 21 1,750 36,750
Squash 28 1,070 29,960
Meat 20 880 17,600
Apples 20 357 7,140
Maize and corn 20 340 6,800
Citrus 20 35 700
Other 20 100 2,000
Total 1 ,3 5 5 3 ,1 7 7 1 0 0 ,9 5 0
Freight is referred to often in terms of TEUs, being twenty foot equivalent units. A 40 foot container
is referred to as being 2 TEUs. In this study we have not used the term TEUs because of the
combination of 20 and 40 foot containers and log wagons. For the sake of completeness the
projected level in 2020 of containerised freight available for rail is equivalent to 7,709 TEUs.
6.2 Monthly Distribution of Currently Available Containers
The table below details how currently available freight is spread across 2020. These numbers are
considered to be conservative and assume one container per wagon. It is possible that the rail
operator may load two 20ft containers on a single wagon which would further increase the capacity
and therefore the revenues. The rail operator would have the choice of reducing the number of
wagons on a train but maintaining total tonnage or adding additional log wagons.
Table 3 Forecast available freight by month, 2020
Product Jan Feb Mar Apl May Jun Jul Aug Sep Oct Nov Dec Total
Processed timber 105 140 140 175 175 140 175 140 175 140 140 105 1,750
Meat 64 68 68 85 85 68 85 68 85 68 68 68 880
Other 6 8 8 10 10 8 10 8 10 8 8 6 100
Squash 300 300 300 85 85 0 0 0 0 0 0 0 1,070
Apples 20 20 20 30 55 96 96 10 10 0 0 0 357
Maize and corn 30 30 30 33 38 25 28 22 28 25 25 26 340
Citrus 0 0 0 0 12 11 12 0 0 0 0 0 35
Total 525 566 566 418 460 348 406 248 308 241 241 205 4 ,5 3 2
It is not unreasonable to assume that once a regular freight service is operating that inbound freight
will become available, subject to cost being comparable with existing transport.
166.3 Current Container Indicative Revenue
Indicative revenue for a reinstated rail freight service based on current container numbers detailed
in section 6.1 and 6.2, is set out below.
These scenarios assume that the 24 wagon train will be filled first with available containerised
freight. In the peak horticulture season, supply of available containerised freight exceeds the
capacity of the five train per week service. This explains the difference between the 1,355 20-foot
containers of freight listed in Table 2, and the 1,138 20-foot containers transported by the rail
service as listed in Table 4. Conversely, during the months of the year where the supply of
containerised freight is less than the total capacity of the rail service, that capacity will be filled
with log wagons.
The price per container/log wagon is based on current average road transport prices provided by
freight operators. Prices are stated on a door-to-door basis and include loading and unloading and
associated costs. Actual rates may vary subject to any arrangements for larger customers. These
revenue forecasts include the cost of delivering empty containers and log wagons from Napier to
Gisborne and returning full containers and log wagons to Napier, delivery of empty containers and
pick up of full containers from freight providers by a road transport operator, and all related rail
head activity costs. The forecasts represent the projected cost to the freight provider, not just the
amount paid to the rail operator for the rail component of the total freight cost.
Table 4 Revenue scenario: Five trains per week (logs taking up spare capacity)
2020
Unit cost ($) Number Total ($000s)
40ft containers 1,850 3,177 5,877
20ft containers 1,700 1,138 1,935
Log wagons 780 1,925 1,502
Total 6 ,2 4 0 9 ,3 1 4
For the purposes of this study it is assumed that each wagon will carry either a 20 foot or 40 foot
container. It is possible that some wagons will carry two 20 foot containers. In such situations the
revenue generated by each container will not change but the revenue per train will increase by
adding a log wagon for every wagon holding two containers. If all 20 foot containers projected for
2020 were carried two per wagon, then the number of additional log wagons that could be added, to
make a up a 24 wagon train, is 667. These additional wagons could generate up to $520,260 of
additional revenue.
The second scenario is provided as a conservative option that assumes actual freight is only 80% of
forecast quantities with the balance of the train being log wagons.
Table 5 Revenue Scenario: With low-volume non-log freight (80%), with logs taking up spare
capacity
2020
Unit cost ($) Number Total ($000s)
40ft containers 1,850 2,542 4,702
20ft containers 1,700 1,084 1,843
Log wagons 780 2,614 2,039
Total 6 ,2 4 0 8 ,5 8 4
17The projected revenue for 2020 of between $8.6 million and $9.3 million compares very favourably
with 2012 revenue of approximately $1 million increasing to $2.5 million in 2019 detailed in the
KiwiRail report of 2012.7
7
Ibid, page 3
187.0 Forecast freight quantities and revenue for 2025
7.1 Forecast Container Numbers
It is difficult to forecast what might happen in five years from now but an attempt has been made
to forecast freight by taking into account current and projected plantings of apples and the
intentions of the two timber processors. A small number of containers of wine have also been
included in this forecast. It is likely that containers for produce such as kiwifruit, pears,
persimmons and other products will be available but as numbers are uncertain they have not been
included. Some potential but excluded freight, such as kiwifruit, is dependent upon investment in
sector infrastructure such as packing and cool storage resources. As production increase the
probability of this infrastructure investment becomes more likely.
Table 6 Amount of available freight 2025
Tonnes per Number of containers
Product container 20ft 40ft Total tonnes
Processed timber 21 3,500 73,500
Squash 28 1,070 29,960
Meat 20 880 17,600
Apples 20 1,183 23,660
Maize and corn 20 340 6,800
Citrus 20 35 700
Wine 24 20 480
Other 20 100 2,000
Total 1 ,3 7 5 5 ,7 5 3 1 5 4 ,7 0 0
The above table allows for new freight from wine (20 containers) and additional containers from a
significantly higher apple harvest, based on current and planned plantings, and a doubling of output
from the two Gisborne based wood processors. This totals 154,700 tonnes of freight in containers, a
major increase from 100,950 tonnes in 2020, with logs providing additional freight to ensure one 24
wagon train each day.
Freight is referred to often in terms of TEUs, being twenty foot equivalent units. A 40 foot container
is referred to as being 2 TEUs. In this study we have not used the term TEUs because of the
combination of 20 and 40 foot containers and log wagons. For the sake of completeness the
projected level in 2025 of containerised freight available for rail is equivalent to 12,881 TEUs
7.2 Monthly Distribution of Forecast Container Numbers for 2025
The table below details how currently available freight is spread across 2025. The actual number of
wagons required for logs could change depending on the number and weight of 20ft containers.
These numbers are considered to be conservative and assume one wagon per container. It is
possible that in some cases two 20ft containers will be carried on a single wagon. The rail operator
will have the choice of reducing the number of wagons on a train but maintaining total tonnage or
adding additional log wagons.
19Table 7 Forecast available freight by month, 2025
Product Jan Feb Mar Apl May Jun Jul Aug Sep Oct Nov Dec Total
Processed timber 210 280 280 350 350 280 350 280 350 280 280 210 3,500
Meat 64 68 68 85 85 68 85 68 85 68 68 68 880
Other 6 8 8 10 10 8 10 8 10 8 8 6 100
Squash 300 300 300 85 85 0 0 0 0 0 0 0 1,070
Apples 65 65 65 80 276 276 276 40 40 0 0 0 1,183
Maize and corn 30 30 30 33 38 25 28 22 28 25 25 26 340
Citrus 0 0 0 0 12 11 12 0 0 0 0 0 35
Wine 1 1 1 2 2 2 2 2 2 2 2 1 20
Total 676 752 752 645 858 670 763 420 515 383 383 311 7 ,1 2 8
It is a reasonable expectation that by 2025 the rail operator will have been able to demonstrate to
other freight providers that it can provide a reliable and cost effective freight service. Those freight
providers are then likely to provide additional freight that is not included in the above table.
7.3 Forecast Container Revenue
As for the 2020 scenarios, these scenarios assume that the 24 wagon train will be filled first with
available containerised freight. In the peak horticulture season, supply of available containerised
freight exceeds the capacity of the five train per week service. This explains the difference between
the number of containers listed in Table 6, and the number of containers transported by the rail
service as listed in Table 8. Conversely, during the months of the year where the supply of
containerised freight is less than the total capacity of the train service, that capacity will be filled
with log wagons.
Indicative revenue for a reinstated rail freight service based on current container and log freight
numbers detailed in section 7.1 and 7.2, is set out below.
The price per container/log wagon is based on current average road transport prices provided by
freight operators and has not been adjusted for inflation over the next 5 years. Prices are stated on
a door-to-door basis and include loading and unloading and associated costs. Actual rates may vary
subject to any arrangements for larger customers.
The second scenario is provided as a conservative option that assumes actual freight is only 80% of
forecast quantities with the balance of the train being log wagons.
A third revenue scenario has been added to provide for a 24 wagon train 7 days a week for 52 weeks
a year.
Table 8 Revenue Scenario: Five trains per week (logs taking up spare capacity)
2025
Unit cost ($) Number Total ($000s)
40ft containers 1,850 5,115 9,463
20ft containers 1,700 617 1,049
Log wagons 780 508 396
Total 6 ,2 4 0 1 0 ,9 0 8
For the purposes of this study it is assumed that each wagon will carry either a 20 foot or 40 foot
container. It is possible that some wagons will carry two 20 foot containers. In such situations the
revenue generated by each container will not change but the revenue per train will increase by
adding a log wagon for every wagon holding two containers. If all 20 foot containers projected for
202025 were carried two per wagon, then the number of additional log wagons that could be added, to
make a up a 24 wagon train, is 850.
These additional wagons could generate up to $663,000 of additional revenue.
Table 9 Revenue Scenario: With low-volume non-log freight (80%), with logs taking up spare
capacity
2025
Unit cost ($) Number Total ($000s)
40ft containers 1,850 4,530 8,381
20ft containers 1,700 715 1,216
Log wagons 780 994 776
Total 6 ,2 4 0 1 0 ,3 7 3
Table 10 Revenue Scenario: Seven trains per week in 2025 revenue (logs taking up spare capacity)
2025
Unit cost ($) Number Total ($000s)
40ft containers 1,850 5,753 10,643
20ft containers 1,700 1,193 2,028
Log wagons 780 1,790 1,396
Total 8 ,7 3 6 1 4 ,0 6 7
7.4 Revenue from additional log wagons
Discussions with KiwiRail indicate that it may be possible to extend the length of the daily train
from 24 to 28 wagons by attaching an additional 4 log wagons. Set out below is the daily and
annual revenue and approximate reduced truck movements with each additional log wagon.
Table 11 Revenue from additional log wagons
No. of extra wagons Daily ($) Annual ($) Reduced truck movements (Annual)
1 780 195,000 500
2 1,560 390,000 1,000
3 2,340 585,000 1,500
4 3,120 780,000 2,000
218.0 Possible Additional Freight in 2025
In addition to the freight available now for transport by rail there are other categories of freight that
are suitable for transport by rail to Napier and beyond. These freight categories are mentioned in
this section for the sake of completeness to illustrate the depth of the Gisborne productive
economy and the potential for a competitive and customer focused rail freight operator to secure
additional business.
8.1 Other Horticultural Produce
In addition to the main horticultural crops described in section 6.2.1 above there are smaller crops
grown in Gisborne including persimmons and pears. While volumes are not large they represent an
opportunity to containerise and transport by rail rather than by road.
If a regular and reliable rail service was available then the growers and pack houses of these crops
could be included as prospective freight customers.
8.2 Wine
Gisborne has a major wine producer exporting bulk wine which is then bottled in the purchasing
country. The wine is exported in 24,000 litre plastic bladders packed in 20ft containers. Production
in Gisborne is approximately five million litres, being about 5,000 tonnes, or around 208 containers,
per annum. The product is currently moved by road, either directly to export ports or between the
company’s facilities in Hawke’s Bay and Marlborough. Supply chain integrity is critical in every
market and therefore security is an important consideration in any transport option. No forecast of
bulk wine for export has been included in the 2025 rail freight forecasts.
There is a small amount of wine bottled in Gisborne for both the domestic and export markets.
Bottling, including labelling, is undertaken for a mix of vineyards and brands. Up to 20 20ft
containers could be sent to Napier by rail each year but the company would like to see a rail service
operating on a regular and reliable basis before making any commitment to use rail.
8.3 Wool
Around 50,000 bales of wool are trucked from Gisborne to Napier every year. This equates to just
over 330 trips by a truck and trailer carrying 150 bales which would be removed from the road if this
freight travelled by rail. No estimate for wool by rail has been included in the 2025 freight forecasts
as a potential source of freight for a reinstated rail service.
8.4 Kiwifruit
Gisborne has seen significant growth in kiwifruit plantings in recent years, particularly the G3 Gold
variety, and the amount of kiwifruit to be transported out of Gisborne has been growing rapidly.
The 2020 season will see four million export trays of kiwifruit from Gisborne, which is expected to
grow to seven million trays by 2022, and 10 million trays by 2025. These numbers are based on
current plantings and growing licenses issued.
This number of trays equates to around 720 containers for 2020 and to 1,800 containers by 2025.
22Currently, most kiwifruit is transported by road to pack houses in the Bay of Plenty for packing into
retail cartons and containers for shipping out of Tauranga. Much of the new kiwifruit planting in
Gisborne is by Bay of Plenty growers who can harvest earlier than their local crop and achieve a
higher utilisation of their pack houses and other infrastructure without having to replicate these
facilities in Gisborne.
Some kiwifruit is shipped out of Eastland Port and this is expected to increase significantly, along
with the associated use of cool store capacity at the port.
As the quantity of Gisborne kiwifruit increases, it is expected that additional large new pack house
and cool storage facilities will be established in the Gisborne area. When grading, packing and
storage are available in Gisborne it is possible that kiwifruit produced in the Gisborne region can be
sent in containers to either Tauranga or Napier for export. It is not unreasonable to project that a
reasonable percentage of these containers could be sent to Napier by rail. Zespri, the largest
kiwifruit exporter, has confirmed that Napier Port is a good future option for export containers.
8.5 Inbound Logs
One of the Gisborne timber processors expressed interest in sourcing larger logs harvested in the
Wairoa catchment and having them railed north from Wairoa to Gisborne for processing. KiwiRail is
to build a log marshalling yard in Wairoa and larger logs could be sorted and then railed to Gisborne
and left on the processor’s Gisborne siding for unloading and processing.
239.0 Rail freight considerations
9.1 Containerisation and biosecurity
International export is now predominantly containerised. The efficiencies of loading and unloading
on ships, ability to move to and from port, and benefits of reliability and security are high. For
exporters in Gisborne this means they must send their goods via the ports of either Napier or
Tauranga.
Due to weight restrictions on road transport, this has typically meant containers have been trucked
only partially full. SH2 has received designation for trucks up to 60 tonnes which would allow for
full container loads, but the road remains unsuited to this type of vehicle. Rail transport would
alleviate this issue.
The security of containerisation extends beyond protection from interference or theft of product to
biosecurity. The Tairāwhiti area has the Burnt Pine Longhorn Beetle (pine beetle), which could travel
inadvertently in exported goods. Containerisation offers the ability to pack export products in a
protected facility. If it can be fully loaded in Tairāwhiti the container can then be sealed and
certified as free of biosecurity risks. This is important to export markets where this beetle is not
present including Japan and North America. China also has strict biosecurity requirements.
For goods requiring refrigeration containerisation offers significant benefits. Temperature data
loggers are increasingly used to ensure product has been kept consistently under appropriate
conditions.
9.2 Confidence in service
Exporters must be able to have confidence in the frequency and reliability of any freight option.
Horticultural goods are sensitive to delays and interruptions. Spoilage or damage to product may
result from an infrequent or delayed service.
This confidence extends to the start date of a new service. Potential customers will require several
months’ notice and a high degree of confidence in the start date in order to decide to use the
service.
9.3 Marshalling and sidings
Supporting infrastructure is required as part of reinstating the line. It had been expected that log
trains would be operating between Wairoa and Napier by October 2019, but, at the time of this
report, no logs have left Wairoa by train because the proposed log marshalling area at Wairoa
station has not been constructed.
It is important that all prospective freight providers see that the missing support elements, such as
yards and sidings, are being reinstated or constructed at the same time as the line itself is being
reinstated. This includes consideration of the development of the Matawhero yard as a future site
for loading containers onto Gisborne trains.
249.4 A reliable supply of empty containers and log wagons
There is limited storage infrastructure in the Gisborne area. Most producers need to dispatch their
products as soon as possible after harvest or processing. Therefore, there must be a constant
supply of clean empty containers. Similarly log wagons must be available.
There is demand for an increased supply of export containers to be on hand in Gisborne for short
notice use for export crops, especially during peak season periods. The transport supply chain must
be responsive to the ebbs and flows associated with seasonal export crops.
9.5 Timeframes
Given the time it has taken to reinstate the Wairoa to Napier section of the line there is concern
that there will be considerable delays if a decision is made to reinstate the Gisborne to Wairoa
section of the line. Delays undermine confidence and defer the expected benefits, particularly with
respect to reducing the number of trucks on the roads and wear and tear on the roads.
Freight forwarders and their customers will require sufficient notice and confidence in the
timeframe for the line to reopen so that they can organise their logistic support. With the peak
season starting at the end of December each year, the line needs to be opened for initial trains at
least two to three months ahead of this time for testing, and be operating efficiently for customers
ahead of the peak season.
9.6 Competitive pricing and service
Pricing must be such that it is competitive with road transport, allowing for the efficiencies and
benefits of fully loaded and biosecurity sealed containerisation. The service provided must be able
to compete in terms of regularity and timeframes.
2510.0 Gisborne Log Shuttle
There are two log storage facilities on Dunstan Road at Matawhero used by Eastland Port and other
parties, including the Hikurangi Farm Forests OptiLog site. A number of community groups and
businesses interviewed for this feasibility study (including logistics companies) noted that they did
not understand why Eastland Port did not use a log rail shuttle to transport logs from Dunstan Road
to the port. Both log storage areas could have sidings as both are located next to the rail line.
Using a train to transport logs back to the port would reduce the number of trucks going through
the centre of Gisborne and reduce wear and tear on the roads.
A 10 wagon log shuttle, with each wagon holding 30 tonnes, 4 shuttles a day, 5 days a week, 50
weeks a year, would transfer an estimated 300,000 tonnes of logs from road to rail. This tonnage
represents approximately 8,571 trucks or 17,143 truck movements through the centre of Gisborne.
We understand that there is a non-KiwiRail provider that could be interested in providing a rail log
shuttle service to Eastland Port. A log shuttle service should not interfere with any rail freight
programme between Gisborne and Napier.
A log shuttle could also contribute towards track maintenance costs.
26You can also read