Global Equities 27th May 2021 - Oldfield Partners

Page created by Gary Campbell
 
CONTINUE READING
Global Equities 27th May 2021 - Oldfield Partners
Global Equities
                                                                              27th May 2021

                                                                         www.oldfieldpartners.com

                                                       Authorised and regulated by the Financial Conduct Authority
Oldfield Partners LLP has issued this communication to Professional Clients for private circulation only; it must not be distributed to Retail Clients (as defined by the Financial Conduct Authority).

                                                       Please read the “Important Information” section on the last page of this presentation.
Global Equities 27th May 2021 - Oldfield Partners
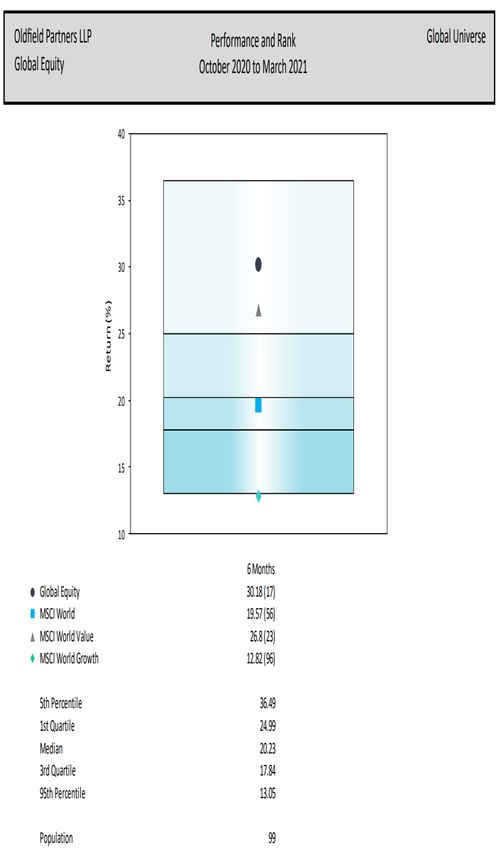
Value has a long-term track record of success

               100 Years of Value investing1                                                                       Value vs Growth2

                                                     But investors now eschew Value
1. Monthly data. Average returns of Fama-French Large/Small Value benchmark portfolios.
Source: Log scale US Value/Growth, relative performance. Shaded areas mark recessions. BofA Merrill Lynch Global Investment Strategy 11th October 2018, Fama-French.
2. MSCI World Value/ MSCI World Growth to end March 2021.
                                                                                                                                                                       2
Global Equities 27th May 2021 - Oldfield Partners
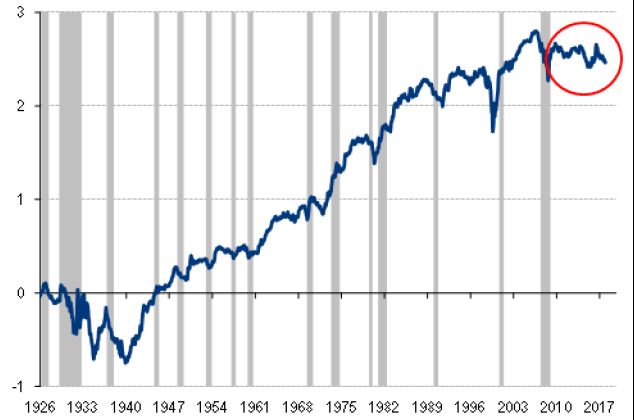
Oldfield Partners – Value investing is at our core

                               FY 2016                                                    Q4 2018

                                                              OP
                                                            Global
                                                           Strategy

                                                            Global
                                                          Value index

                      “With every new wave of optimism or pessimism, we are ready to abandon
                         history and time-tested principles.” - Benjamin Graham, The Intelligent Investor

                                            Delivering when Value works
Source: Intersec Global Universe.

                                                                                                            3
Global Equities 27th May 2021 - Oldfield Partners
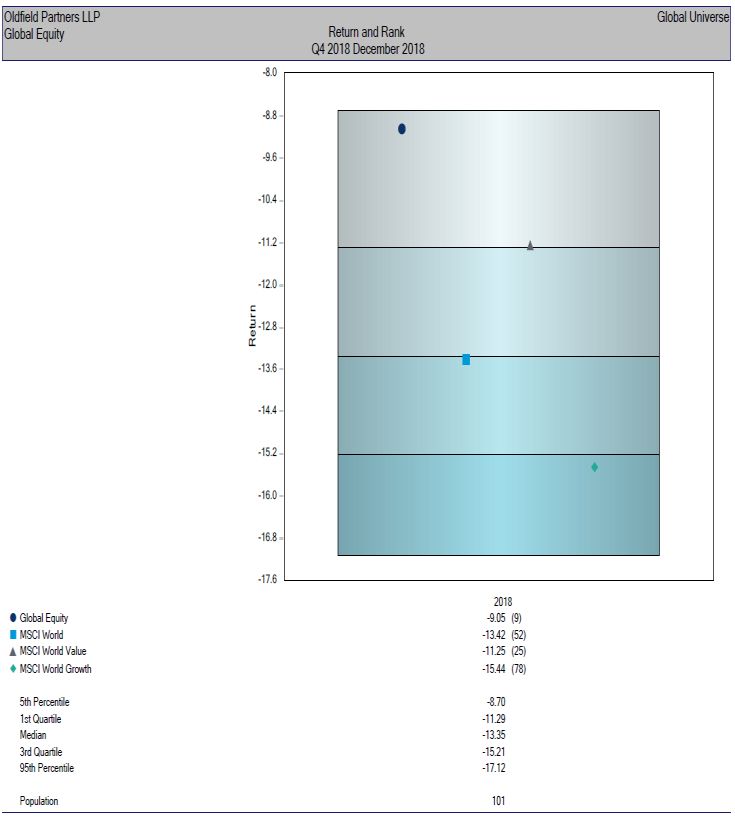
Oldfield Partners – delivering when value works

                                       Q4 2020 – Q1 2021

                              OP
                            Global
                           Strategy
                           Global
                         Value index

Source: Intersec Global Universe.

                                                           4
Global Equities 27th May 2021 - Oldfield Partners
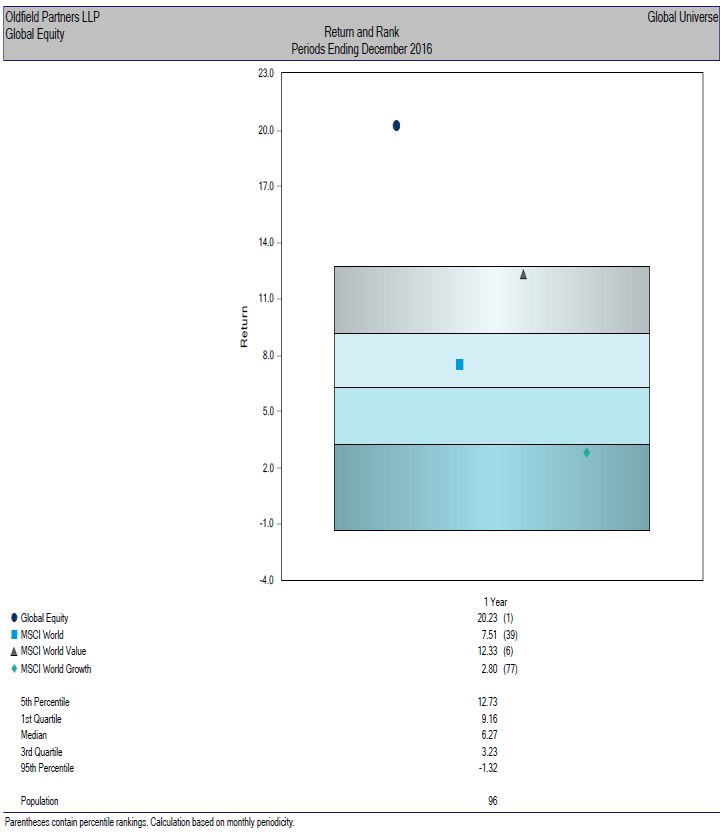
Performance since the vaccine

   135

   130
                                                                                                                               +38.5%
   125

                                                                                                                               +30.2%
   120

   115                                                                                                                         +19.5%

   110

                                                                                                                               +9.9%
   105

   100

    95
     Nov 20                        Dec 20                        Jan 21                       Feb 21                  Mar 21

                                  OP G            MSCI World              MSCI World Value              MSCI World Growth

Source: Bloomberg., 1 Date as at 18th May 2021, indexed from 6th November 2020. Total Returns in USD.
Representative global equities portfolio used.
                                                                                                                                        5
Global Equities 27th May 2021 - Oldfield Partners
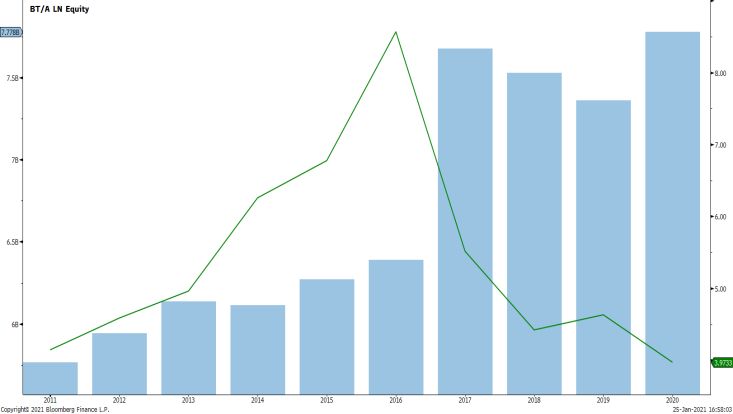
Strategy performance

                                                                 $                                                                     £

                                Overstone Global                                 MSCI World            Overstone Global                                MSCI World
                                                 MSCI World                                                             MSCI World
                                  Equity Fund                                      Value                 Equity Fund                                     Value

    Since vaccine+                    +38.5%                  +19.5%                 +30.2%                  +28.4%                  +10.8%              +20.7%
    2021 to date                      +17.1%                   +9.6%                +15.8%                   +12.6%                   +5.4%              +11.3%
    2020                               -5.3%                  +15.9%                 -1.2%                    -8.0%                  +12.6%               -4.0%
    2019                              +16.4%                  +27.7%                +21.7%                   +11.8%                  +22.7%              +17.0%
    2018                               -9.5%                   -8.7%                -10.8%                    -4.0%                   -3.1%               -5.3%
    2017                              +18.2%                  +22.4%                +17.1%                   +7.9%                   +11.7%              +6.9%
    2016                              +21.1%                   +7.5%                +12.3%                   +44.5%                  +28.3%              +34.1%
    Since inception
                                        +6.3%                   +8.2%                +6.2%                    +8.0%                   +9.9%                +7.9%
    annualised*

Performance shown is of the A shares, calculated on a Total Return basis net of investment management fees and expenses. Index is MSCI World (Net Dividends
Reinvested) and MSCI World Value (Net Dividends Reinvested).
Source: OP, Bloomberg, Northern Trust Ireland and MSCI ©. Data as at 18th May 2021. *Inception Date is 1st June 2005. + Since vaccine: since close on 06Nov20.
                                                                                                                                                                    6
Global strategy - portfolio characteristics

                                       Valuation                                                                         Fundamentals

25                                                                                               18.0%                                                                      14.0

                                                                                                 16.0%                              15.3%
                        20.3                                                                                                                                                12.0
20                                                                                               14.0%                    13.3%
                                                                                                                                                                            10.0
                 15.5                                                                            12.0%
15
                                                    13.3                                         10.0%                                                                      8.0
          12.4
                                                                                                                     8.4%
                                              9.8                                                 8.0%                                                                      6.0
10
                                                                                                  6.0%
                                                                                                                                             ex-                            4.0
                                        5.4                                                                                                  utilities          3.0
                                                                                                  4.0%                                                    2.7
 5                                                                                                                                                                    2.3
                                                                                 3.1                                                                                        2.0
                                                                           2.1                    2.0%
                                                                     1.0
 0                                                                                                0.0%                                                                      0.0
          Price/earnings              Price/cash flow             Price/book value                                   Return on equity              Net debt to EBITDA

Source: OP, Bloomberg.
Date: As at 31st March 2021.
Representative global portfolio used. Based on MSCI method. Net debt/EBITDA excludes financials and includes only industrial net debt where applicable.
The ex-utilities net debt/EBITDA values are as follows: OP: 1.6x, MSCI World Value: 2.8x and MSCI World: 2.0x.
Earnings, cash flow and ROE based on blended-forward consensus. Book value is historic.                                                                                     7
Investment Environment
US valuation

                                                 Shiller PE Ratio for the S&P 500

                                    The valuation of the US market has rarely been higher
Source: Robert Shiller, Yale University.
Date: As at 4th May 2021

                                                                                            9
The valuation of the US market – US market cap to GDP

   2.00
                                                                    Valuation matters
                                                                   Valuation matters
   1.80

   1.60

   1.40

   1.20

   1.00

   0.80

   0.60

   0.40

   0.20

   0.00

                          Valuations are now in unchartered territory in many cases
Source: Bloomberg, 31st December 2020. Wilshire 5000/ US Nominal GDP.

                                                                                        10
The re-rating of the US vs international markets

                                           Cyclically adjusted P/E ratio

                                     Value is found outside of the US market
Source: Gavekal, 4th February 2021

                                                                               11
The US dominates the Value benchmark - Top 20 names in the MSCI Value

                                         Fwd P/E           P/BV       Fwd P/CF P/Sales
OP Global Strategy                        12.4               1.0        5.4      0.8
JPMORGAN CHASE                            11.7               1.8        n/a      3.8
JOHNSON&JOHNSON                           17.5               6.4        13.7     4.7
UNITEDHEALTH GRP                          21.4               5.4        19.8     1.3
BERKSHIRE HATH-B                          24.6               1.4        n/a      2.3             Would raise the overall
PROCTER & GAMBLE                          24.4               7.6        17.7     4.4             valuation metrics of our
HOME DEPOT INC                            25.1             108.0        18.5     2.6             portfolio
BANK OF AMERICA                           13.1               1.3        n/a      3.7
INTEL CORP                                13.8               3.2         8.3     3.5
COMCAST CORP-A                            19.0               2.7         9.9     2.2             Would lower the overall
VERIZON COMMUNIC                          11.5               3.4         6.5     1.8             valuation metrics of our
EXXON MOBIL CORP                          17.0               1.5         7.3     0.9             portfolio
AT&T INC                                   9.6               1.2         4.9     1.2
CISCO SYSTEMS                             16.2               5.5        13.6     4.3
COCA-COLA CO/THE                          25.0              11.1        20.1     6.3
CHEVRON CORP                              18.7               1.5         7.3     1.4
PFIZER INC                                11.8               3.3        18.0     3.5
PEPSICO INC                               24.0              13.7        16.8     2.6
MERCK & CO                                12.1              n/a         n/a      3.8
NOVARTIS AG-REG                           13.9              n/a         n/a      4.2
WALMART INC                               25.7               4.8        14.1     0.7

                                                    Is the MSCI Value index still value?
Source: MSCI and Bloomberg.
Top 20 constituents for the index as at 31st March 2021. Valuation data as at 21st April 2021.

                                                                                                                        12
Country exposure

   100%

     90%                                                                                     USA
                                                                                             UK
     80%                                                                                     Taiwan
                                                                                             Switzerland
     70%                                                                                     Sweden
                                                                                             Spain
     60%                                                                                     South Korea
                                                                                             Singapore
                                                                                             Russia
     50%
                                                                                             Norway
                                                                                             Netherlands
     40%
                                                                                             Japan
                                                                                             Italy
     30%                                                                                     France
                                                                                             Finland
     20%                                                                                     Germany
                                                                                             Cash
     10%                                                                                     Canada

      0%
           2005 2006 2007 2008 2009 2010 2011 2012 2013 2014 2015 2016 2017 2018 2019 2020

Source: OP.
Date: 31st March 2021.                                                                                13
Global Equity Strategy - portfolio structure

Sector weights

 30%

 25%

 20%

 15%

 10%

  5%

  0%
ConsumerConsumer
         DiscretionaryConsumer
               Consumer            Energy
                         Staples Energy       Financials Health
                                             Financials    Healthcare  Industrials
                                                                Care Industrials     Information
                                                                             Information Technology
                                                                                                 Materials      Real
                                                                                                    Materials Real   Estate Communication
                                                                                                                   Estate
                                                                                                                     Communication Services Utilities
                                                                                                                                         Utilities
      Discretionary    Staples                                                       Technology                               Services

Country weights

 70%

 60%

 50%
 40%

 30%

 20%

 10%

  0%
            Canada            Finland       France         Germany           Italy           Japan       South Korea United Kingdom United States

     Source: OP, Bloomberg.                      Global Equity Strategy         MSCI World Index
                                                                                                                                                 14
     Date: 31st March 2021.
Portfolio
Top contributors and detractors – relative attribution

                                            Top 5 Contributors                         %         Top 5 Detractors                            %

                    Q4 2020                  Samsung Electronics                     +2.1          Barrick Gold                             -1.6

                                             BT                                      +1.3          Sanofi                                   -0.9

                                             Lloyds                                  +1.3          E.ON                                     -0.8

                                             NOV                                     +1.3          Nokia                                    -0.7

                                             General Motors                          +1.0          Bayer                                    -0.7

                                            Top 5 Contributors                         %         Top 5 Detractors                            %

                                             Hewlett Packard Enterprise              +0.8          Korea Electric Power                     -0.8
                    Q1 2021
                                             BT                                      +0.7          Barrick Gold                             -0.6

                                             Mitsubishi UFJ                          +0.6          Samsung Electronics                      -0.3

                                             Nokia                                   +0.6          Toyota                                  -0.3

                                             Siemens                                 +0.6          NOV                                      -0.2

Source: OP, Bloomberg and MSCI ©.
Date: As at 31st March 2021.
% = the contribution to relative return of a representative global equities portfolio versus the MSCI World (Net Dividends Reinvested) Index in USD terms.
                                                                                                                                                             16
Top contributors and detractors – relative attribution

                                               Top 5 Contributors                           %          Top 5 Detractors                              %

                    Since                      Lloyds                                      +3.0          Barrick Gold                               -1.8
                    vaccine
                                               BT                                          +3.0          Sanofi                                     -0.6
                    to date*
                                               NOV                                         +2.2          Kansai Electric Power                      -0.3

                                               Citigroup                                   +1.7          E.ON                                       -0.1

                                               Hewlett Packard Enterprise                  +1.6          Nomura                                     -0.1

Source: OP, Bloomberg and MSCI ©.
*Date: From 6th November 2020 to 18th May 2021.
% = the contribution to relative return of a representative global equities portfolio versus the MSCI World (Net Dividends Reinvested) Index in USD terms.
Estimate data used.                                                                                                                                          17
BT – value trap vs patience
                                                                                BT share price chart to end 2020

▪       UK’s dominant communication infrastructure

▪       Significant headwinds, 2015 500p → 2020 100p

▪       Openreach (ROIC), Enterprise (sales), pension
        (interest rates)

▪       Absolute and historically low valuation

▪       2015 acquired EE for £13bn, BT £12bn 03/20

▪       Openreach +£13bn                                                             BT EBITDA and rating

▪       Stabilise CF and deployment to drive value

▪       OCF £7.5bn to 8.0bn, capex: £4.0 to 4.5bn

▪       FTTP ‘fair bet’ – catalyst

                                                       Long-term value opportunity
Source: OP, as at 30th December 2020. Charts taken from Bloomberg.

                                                                                                                   18
Key purchases and sales

                                                                                       Purchases                          Sales

                                                                                                            Southwest Airlines, Japan Airlines,
                                                                       easyJet, Exor, Berkshire Hathaway,
                                      Q4 2020                                                                       General Motors
                                                                                      Bayer
                                                                                                                  Samsung Electronics

                                      Q1 2021                                          Fresenius                  Siemens Energy, Nokia

Source: OP.
Representative global equities portfolio used. Bold are complete purchases or sales.
                                                                                                                                                  19
easyJet – emerging relatively stronger from vaccine recovery

                                                                                        EV to Invested Capital

   ▪      Many airlines entered crisis with poor balance
          sheets

   ▪      OP stress tests Q2 2020

   ▪      Low cost model deemed superior over-time

   ▪      Strong balance sheet and young fleet, 70%
          owned

   ▪      First to recover - 83% revenue short-haul
                                                                                         Net debt / EBITDAR
          leisure

   ▪      Constrained airports = pricing power

   ▪      Cost advantage to grow

   ▪      Management incentivised to improve returns

                                                            Long-term industry winner
Source: OP research, Bernstein estimates and analysis, Bloomberg.

                                                                                                                 20
Fresenius – under-rated recovery and growth

                                                                                   OP Sum of the Parts (€bn)

▪      Diversified healthcare group                                       Kabi                           16.8

▪      Historic rating 18x P/E                                           Helios                                                   18.0

                                                                       Vamed                                                       1.8
▪      Helios: utility-like profits from hospital business
                                                               Stake in FMC                                                              6.0
▪      Kabi: injectables and nutrition                                Net debt                                                           (12.7)

▪      FMC: dialysis down, stock market listed –               Minorities and
                                                                 corporate
                                                                                                                          (1.8)

       recovery potential                                      Intrinsic value                                           28.2

                                                                    Market cap                                  21.4
▪      Returns depressed due to investments in
       biosimilars and COVID-19
                                                                                            Forward P/E
                                                              30
▪      Mid-single digit organic growth
                                                              25
▪      Initiated position at 11x P/E in March 2021            20

                                                              15

                                                              10

                                                                5

                                                                0
                                                                Aug-05    Aug-07   Aug-09   Aug-11    Aug-13    Aug-15    Aug-17    Aug-19
                                                                            Fresenius                MSCI Europe Health Care Index

                                 Expect discount to narrow as returns improve
Source: Bloomberg, OP research
Date: As at 15th April 2021                                                                                                              21
ESG
Climate Change
                                              Share and gain knowledge for assessing and
                                                   engaging on climate related risks

                                                            Stewardship Committee oversight

          Idea generation                      Active ownership                            Escalation process

                • Investment team have              • Engage with company                      • Withholding support
                 access to MSCI ESG                  on material issues                          or voting against
                 research reports                    within the ordinary                         management (and
                                                     routine of interaction                      informing them)
                • Investors carry out their
                 own appraisal of material          • Stewardship                              • Meeting with non-
                 ESG issues to an                    Committee oversees                          executive directors or
                 investment thesis                   progress of                                 the chairman
                                                     engagements
                • Dedicated ESG section                                                        • Collaborative
                 in all key research notes          • MSCI Controversies                         intervention with
                                                     Alert system to monitor                     other institutional
                • Debated by the wider               new or existing                             investors
                 investment team at                  controversies
                 weekly team meetings                                                          • Engaging with
                                                                                                 regulatory or
                                                                                                 governmental bodies

   Include dedicated                                                           Collaborative
 section for assessing                                                         engagement
transition risks to a low                                                      with CA 100+
 carbon economy, with                                                           signatories
  scenario analysis for
     material risks
                                                                                                                       23
Global Equity Strategy: Carbon intensity contribution

                                                                              1% 0%
                                                                  2%
                                                                3%
                                                           4%

                                                      6%

                                                7%
                                                                                                              54%

                                                      7%

                                                             11%

                       Korea Electric Power                Easyjet Plc                Kansai Electric Power    Eni
                       Barrick Gold                        Berkshire Hath-B           E.On                     Nov Inc
                       Bayer                               Samsung Electronics        Bt                       Exor
                       Tesco                               Toyota                     Sanofi                   Siemens
                       Mhi                                 Nokia                      Fresenius Se & C         Hewlett Packard Enterprise
                       Citigroup                           Mitsubishi Ufj             Lloyds                   Nomura

Source: OP and MSCI data
Date: 2020 data (except EZJ 2019) as at April 2021.
Representative global equities portfolio used.
                                                                                                                                            24
Global Equity Strategy – holdings and valuation methodologies

  Valuation                                                             Target Valuation (Analyst)

                                                               Share                                                                    Total return
  Company Name                                   % Portfolio                       Primary valuation method       Fair value   Upside                  Resp.
                                                                Price                                                                     (2 years)
  BT GROUP PLC                                      6.1          156                             SOTP + P/E             226      44%           49%       SZ
  SIEMENS AG-REG                                    5.9          141                                       P/E          155       9%           15%       CO
  LLOYDS BANKING GROUP PLC                          5.2         42.77                            P/TBV + P/E             66      53%           63%     RG/SZ
  E.ON SE                                           5.1          9.94                                      P/E        12.50      26%           36%       SZ
  BAYER AG-REG                                      5.0           53                                     SOTP            71      33%           41%       CO
  SAMSUNG ELECTRONICS CO LTD                        4.9        85,400               PE + net cash per share         91,900        8%           12%        AF
  BERKSHIRE HATHAWAY INC-CL B                       4.8          263     SOTP + look through earnings + P/B             369      40%           40%        JL
  SANOFI                                            4.4           84                                      P/CF          108      28%           36%     SZ/RG
  MITSUBISHI UFJ FINANCIAL GRO                      4.3          611                             P/E + P/TBV            708      16%           24%       AG
  ENI SPA                                           4.2         10.57                                      P/B        12.80      21%           34%       NW
  TOYOTA MOTOR CORP                                 4.2         8,461                                      P/B        9,700      15%           20%       JM
  TESCO PLC                                         4.1          228               P/E, P/B, P/CF, EV/EBITDA            299      31%           44%       NW
  MITSUBISHI HEAVY INDUSTRIES                       3.9         3,400                                      P/B        3,939      16%           21%       AG
  CITIGROUP INC                                     3.8           73                             P/E + P/TBV             90      24%           30%       RG
  EXOR NV                                           3.7           72                                     SOTP            95      32%           33%       SZ
  NOV INC                                           3.6         13.83                                EV/EBITDA        25.00      81%           81%       HF
  EASYJET PLC                                       3.5         1,009                                 P/S + P/E       1,450      44%           45%       SZ
  HEWLETT PACKARD ENTERPRISE                        3.5         15.91                                      P/E        18.00      13%           19%       NW
  NOMURA HOLDINGS INC                               2.9          597                                       P/B          762      28%           38%       JM
  BARRICK GOLD CORP                                 2.8         25.83                                      P/B        38.10      48%           52%       RG
  KOREA ELECTRIC POWER CORP                         2.7        24,000                 EV/Sales + EV/IC + P/B        35,550       48%           56%       CO
  KANSAI ELECTRIC POWER CO INC                      2.3         1,128                                      P/B        1,863      65%           74%       AG
  NOKIA OYJ                                         2.2          3.46                         EV/Sales + P/B           3.62       5%            9%        JL
  FRESENIUS SE & CO KGAA                            1.3         37.76                            SOTP + P/E              51      35%           40%       CO
  Weighted Average Upside                                                                                                        28%

Source: OP.
Date: As at 5th April 2021.
Representative global equities portfolio used.
                                                                                                                                                          25
Oldfield Partners – an authentic Value investor

                                                                                                                Performance since vaccine
    Throughout an unprecedented drawdown in Value;                                                                   announcement 1
                                                                                                                                                             Total return
    ▪      OP remains true to its contrarian investment
           philosophy                                                                             OP Global                                                       +38.5%

                                                                                                  MSCI World                                                      +19.5%
    ▪      Maintained and grown our investment team
                                                                                                  MSCI World Value                                                +30.2%
    ▪      Maintained a relatively consistent client base
                                                                                                  MSCI World Growth                                               +9.9%
    ▪      Continues to win new clients

                                     Stable platform to capture the Value opportunity
Source: 1. Vaccine announcement after market close on 6th November 2020 to 18th May 2021, performance total return USD, source Bloomberg using a representative
global equities portfolio.
                                                                                                                                                                      26
Risk warning and other important information

The value of all investments and the income from them can go down as well as up; this may be due, in part, to exchange
rate fluctuations. Past performance is not necessarily a guide to future performance.

This document is issued by Oldfield Partners LLP (“OP”) which is authorised and regulated by the Financial Conduct Authority in the United Kingdom (the “FCA”). The investment products and services of OP are only available to persons who are Professional
Clients for the purposes of the FCA’s rules. They are not available to Retail Clients. OP has taken all reasonable care to ensure that the information contained in this document is accurate at the time of publication, however it does not make any guarantee as to
the accuracy of the information provided. Comparison to the index where shown is for information only and should not be interpreted to mean that there is a correlation between the portfolio and the index. While many of the thoughts expressed in this document
are presented in a factual manner, the discussion reflects only OP’s beliefs and opinions about the financial markets in which it invests and these beliefs and opinions are subject to change at any time.

This document is not intended as an offer or solicitation with respect to the purchase or sale of any security. This document is not intended for distribution to, or use by any person or entity in any jurisdiction or country where such distribution or use would be
contrary to local law or regulation. In particular this document is not intended for distribution in the United States or for the account of U.S. persons (as defined in Regulation S under the United States Securities Act of 1933, as amended (the "Securities Act"))
except to persons who are "qualified purchasers" (as defined in the United States Investment Company Act of 1940, as amended (the “Companies Act”)) and "accredited investors" (as defined in Rule 501(a) under the Securities Act).

Nothing in these materials should be construed as a recommendation to invest in OP’s products or as legal, regulatory, tax, accounting, investment or other advice. Potential investors should seek their own independent financial advice. The information contained
in this document is strictly confidential and is intended only for use of the person to whom OP has provided the material. No part of this report may be divulged to any other person, distributed, and/or reproduced without the prior written permission of OP.

The following is a brief summary of only some of the risk factors which may apply to an investment in a product or a segregated account managed by OP (collectively an “Account”): An investment in an Account carries with it a significant degree of risk. The value
of an Account may fall as well as rise and investors may not get back the amount originally invested. Accordingly, an investment in an Account should only be made by persons who are able to bear the risk of loss of all the capital invested. Investment Risk - An
investment in an Account involves investment risks, including possible loss of the amount invested. The capital return and income of an Account are based on the capital appreciation and income on the investments it holds, less expenses incurred. Therefore, an
Account’s return may be expected to fluctuate in response to changes in such capital appreciation or income. Currency Risk - The investments held by an Account may be acquired in a wide range of currencies and this will create currency exposure. Political
Risks - The value of an Account’s assets may be affected by uncertainties, such as political developments, changes in government policies, taxation and currency repatriation and restrictions on foreign investment in some of the countries in which the Account
may invest. Counterparty and Settlement Risks – An Account will be exposed to a credit risk on parties with whom it trades and may also bear the risk of settlement default. In addition, market practices in relation to the settlement of transactions and the custody of
assets could provide increased risks. Emerging Markets - Where an Account invests in equities or securities of companies incorporated in or whose principal operations are based in emerging markets additional risks may be encountered. These include: (a)
Currency Risk: the currencies in which investments are denominated may be unstable, may be subject to significant depreciation and may not be freely convertible; (b) Country Risk: the value of an Account’s assets may be affected by political, legal, economic
and fiscal uncertainties within the emerging markets; (c) Market Characteristics: some emerging markets are still in the early stages of their development, have less volume, are less liquid and experience greater volatility than more established markets and are
not highly regulated; (d) Custody Risk: in some markets custodians are not able to offer the level of service and safe-keeping, settlement and administration of securities that are available in more developed markets; and (e) Disclosure: less complete and reliable
fiscal and other information may be available to investors and accounting standards may not provide the same degree of shareholder protection as would generally apply internationally. Substantial Repurchases - If there are substantial repurchases within a
limited period of time, it may be difficult for an Account to provide sufficient funds to meet such repurchases without liquidating positions prematurely at an inappropriate time or on unfavourable terms. Investment in Other Collective Investment Schemes – an
Account may invest in other collective investment schemes and management fees and performance fees (if applicable) will be in addition to the Account’s charges. The foregoing summary list of risk factors does not purport to be a complete enumeration or
explanation of the risks involved in an investment in an Account.

                                                                                                                         Oldfield Partners LLP
                                                                                                                           11 Grosvenor Place
                                                                                                                           London SW1X 7HH
                                                                                                                            United Kingdom
                                                                                                                       Partnership No. OC309959.

                                                                                                                                                                                                                                                                    27
You can also read