Global fertilizer hotspots and their prospects for 2019 - Argus Media
←
→
Page content transcription
If your browser does not render page correctly, please read the page content below
Argus White Paper:
Global fertilizer
hotspots and their
prospects for 2019

Key

      All
      Nitrogen
      Potash
      Sulphur
      NPKs
      Phosphates

Disclaimer: Argus depicts geo-political borders
as defined by the United Nations Geospatial
Information Section. For more information visit
http://www.un.org/Depts/Cartographic/map/
profile/world.pdf

Global fertilizer hotspots and their prospects for 2019            In Europe, three regulation-related developments occurred in
Heading into 2019, Argus takes a look at a selection of market-    the second half of 2018, and uncertainty generated by these
moving stories from across the globe.                              events is likely to persist in 2019.

In India, DAP import demand has been driven by increasingly        More globally, the potash market continues to watch growing
high costs for raw materials, particularly phosphoric acid,        production capacity with interest. 2019 is likely to be the year
which has pushed domestic DAP production close to loss-            where greenfield output starts to hit the export markets in
making territory.                                                  serious numbers.

In China, the winding down of sulphur discharge at Nantong         Elsewhere, Argus also looks at confidence in South African
port poses questions over trader storage options, and liquidity.   farming, prospects for polyhalite in Europe, the rise of NPK com-
                                                                   petition in Asia, and how competitive Yuzhny ammonia is after
                                                                   transit times lengthened and new regulations were rolled out.

 Fertilizer
                                                                    Copyright © 2018 Argus Media group - www.argusmedia.com - All rights reserved.
                                                                    Trademark notice: ARGUS, the ARGUS logo, ARGUS MEDIA, ARGUS DIRECT,
                                                                    ARGUS OPEN MARKETS, AOM, FMB, DEWITT, JIM JORDAN & ASSOCIATES, JJ&A,
 illuminating the markets                                           FUNDALYTICS, METAL-PAGES, METALPRICES.COM, Argus publication titles and
                                                                    Argus index names are trademarks of Argus Media Limited.
Argus news and analysis
India cuts DAP output for NPKs as yet. Fresh supply-side capacity is ramping up in Morocco
A fall in domestic Indian DAP output was one of the key devel- and Saudi Arabia, while OCP will look to continue offloading
opments in the phosphates market last year, which increased finished product in the world’s largest DAP import market.
distributors’ appetite for imports. Indian DAP imports have
been substantial in the current fertilizer year, reaching 6mn t Russian NPK suppliers are still optimistic that they will con-
in April-January 2019 compared with 4.05mn t a year earlier. tinue to sell to India despite its growing domestic capacity.
Import demand has been driven by increasingly high costs for New capacity at firms such as state-owned Pupuk Indonesia,
raw materials, particularly phosphoric acid, which has pushed the holding company for a number of domestic fertilizer manu-
domestic DAP production close to loss-making territory. facturers including Petrokimia Gresik — which aims to add a
Moroccan state-owned producer OCP successively negotiated total of 2.4mn t/yr of NPK capacity in two phases — is likely to
an increase in its quarterly phosphoric acid contracts with provide new competition for Indian NPK intake with products
Indian buyers in 2018, from $567-572/t P2O5 cfr India in the such as 20-20-0+13S.
fourth quarter of 2017 to $768/t P2O5 in the last quarter of
2018. This rise in production cost for DAP resulted in reduced We will be closely monitoring this and other developments in
Indian output, as suppliers switched to NPKs, which require the phosphate and NPK sectors, providing essential analysis
less acid in their production process. Indian DAP output in through our phosphate and NPK prices, forecasts and analysis
April-December 2018 dropped by 30pc on the year to 2.59mn services.
t, latest provisional data show. Click here for more information on phosphates.
Click here for more information on NPKs.
Turning to NPK production
A gradual increase in domestic NPK production at the expense India DAP imports compared with domestic output
of DAP output became evident in late 2017. But the pace of ’000t $/t
the process really ramped up at the start of the Indian finan- 1,200 800
Imports (LHS)
cial year in April 2018. Total NPK output in April-November 1,000 Production (LHS) 750
reached 6.08mn t, up by 9pc on the year, with only August Phos acid cfr India (RHS)
800 700
showing a year-on-year decrease.
600 650
The phosphoric acid quarterly contract rise led Indian produc-
400 600
ers to focus on output of NPK products such as 10-26-26 and
12-32-16, along with NP 20-20-0+13S. All three grades contain 200 550
high P content to compensate for the lack of domestic DAP 0 500
output. Apr Jul Oct Jan
18
Apr Jul Oct
17
Please note: Indian DAP production data for December is provisional. The
Crucially, the focus on NPK production coincided with in- import figures are based on Argus’ projections from the scheduled DAP line-up.
creased demand over the same period. NPK sales in April-
November rose by 17.9pc on the year to 6.31mn t. NPK imports Potash overcapacity on the horizon
only increased slightly over the period, by 8.3pc to 404,000t, The potash market is used to expecting the unexpected. Last
as the Indian import market mainly focused on buying DAP. year it suffered issues affecting production, rail and trucking,
There are at least four new capacity expansions planned in In- along with low CPO futures prices and significant currency
dia , with three scheduled for commissioning this year. Deep- fluctuations against the US dollar. Even new governments in
ak plans to increase capacity at its Taloja plant by 900,000 some countries had an impact.
t/yr to 1.2mn t/yr in 2018-19. And capacity at Greenstar’s
Tuticorin NPK plant will rise by 600,000 t/yr to 1.2mn t/yr. PPL But the next 12-18 months will be particularly interesting. Sup-
plans to raise capacity at its Paradeep plant by 400,000 t/yr pliers will be forced to accommodate the entry of Eurochem
to 1.7mn t/yr, while MCFL aims to commission an 800,000 t/yr into the market, along with new greenfield production from
expansion to 1.1mn t/yr in 2022. K+S in Canada, ideally without losing price gains made after
the recent lows of summer 2016.
2019
The fall in Indian DAP output has resulted in a deficit, as sales Argus expects global MOP demand to reach 64.5mn t in 2018,
to end-users hit 7.69mn t in April-December, up by 0.4pc on the up by 1.8mn t on the year. Nameplate capacity is currently put
year, provisonal data show. Looking to 2019, there was specu- at 92mn t, but is expected to rise to 94mn t this year.
lation at a major conference held recently that there would be
a rollover or a decrease of up to $30/t P2O5 in the phosphoric The K+S Bethune mine will add around 1.8mn t of output to
acid cfr India price. A fall would probably result in an increase the 2019 global total. And Eurochem will add another 1.4mn t,
in domestic DAP output and a decrease in NPK production. according to current projections. So at first glance, the market
But there has been no indication from suppliers or importers will be oversupplied in 2019.
argusmedia.comArgus news and analysis
But MOP from new mines has taken longer than expected to at Uralkali's Solikamsk-2 mine, which could lead to reduced
hit the export market. This has delayed the point at which output. Uralkali has also taken an unusually long time to
many participants thought prices would level off. On top of settle in China, and there is still a possibility that it will not
this, a number of minor events helped to cut supply in 2018, supply India at all in the 2018-19 contract period. K+S' Ger-
delaying oversupply further, and this could continue in 2019. man mine operations continue to be at the mercy of weather
The potash industry is also losing some production, as SQM conditions, although huge efforts have been made to miti-
focuses on lithium at the expense of MOP output, and with the gate their impact. And SQM's focus on lithium over potash
closure of the K+S Sigmundshall mine in Germany. In addition, will roll over into 2019 and beyond.
Nutrien recently decided to permanently close its New Bruns-
wick potash facility, while K+S has lost hundreds of thousands The overall outlook for cfr MOP prices is for rising or stable
of tonnes of potential output caused by a number of issues at levels until at least the first quarter of 2020, providing that
its Werra complex. suppliers exercise restraint in their production targets. If they
do not, buyers can look forward to falling prices as the market
Perhaps most importantly, suppliers are acutely aware of the seeks to rebalance.
need to match production with demand, and may continue to
be flexible with operating rates. Argus puts operating rates at We will be closely monitoring this and other developments in
70pc in both 2018 and 2019. the potash sector, providing essential analysis through our
potash prices, forecasts and analysis services.
Current issues that could affect the market but are more Click here for more information on Potash:
difficult to forecast include reports of water-related issues
New potash mines projected for completion during and after 2017
Production Company (Mine name) Region, Country Nameplate capac- Estimated produc- Estimated produc-
start ity (mn t/yr KCl) tion 2018 (mn t) tion 2019 (mn t)
2017/18 Turkmenkhimiya (Garlyk) Turkmenistan 1.40 0.05 0.10
K+S Kali (Bethune) Saskatchewan, Canada 2.86 1.40 1.80
Eurochem (Usolsky) Palashersk, Russia 2.30 0.30 1.20
Eurochem (Volgakali) Kotelnikovo, Russia 2.30 0.03 0.15
2019 Belaruskali (Petrikov) Belarus 1.50 0.00 0.10
2020 Uralkali (Ust-Yaiva) Russia 2.50 0.00 0.00
Uralkali (Solikamsk 2) Perm Krai, Russia 2.30 0.00 0.00
Slavkaliy (East Nezhinsky Mine) Luban, Belarus 2.00 0.00 0.00
Total 17.16 1.78 3.35
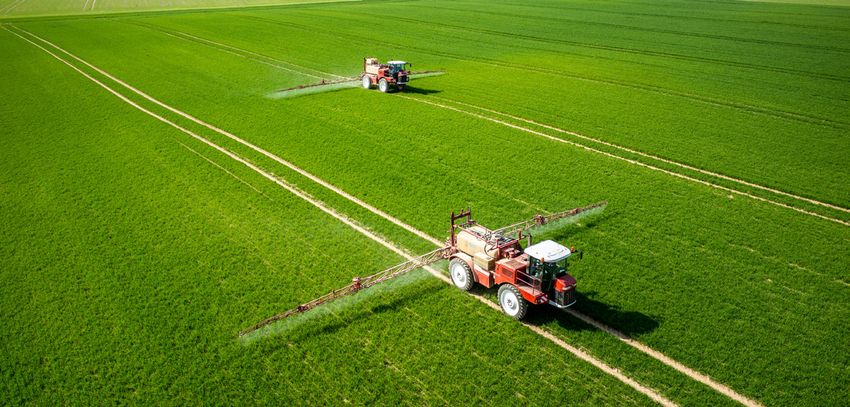
Potash mine production
K+S Kali (Bethune) – Start up: 2017/18 Uralkali (Solikamsk 2) – Start up: 2020 Uralkali (Ust-Yaiva) – Start up: 2020
Estimate production: 1.8mn t/yr (2019) Estimate production: 0mn t/yr (2019) Estimate production: 0mn t/yr (2019)
Belaruskali (Petrikov) – Start up: 2019
Estimate production: 0.1mn t/yr (2019)
Eurochem (Usolsky) – Start up: 2017/18
Estimate production: 1.2mn t/yr (2019)
Eurochem (Volgakali) – Start up: 2017/18
Estimate production: 0.15mn t/yr (2019)
CAMC (Uyuni) – Start up: 2018 Slavkaliy (East Nezhinsky Mine) – Start up: 2020
Estimate production: 0.05mn t/yr (2019) Estimate production: 0mn t/yr (2019)
Turkmenkhimiya (Garlyk) – Start up: 2017/18
Estimate production: 0.1mn t/yr (2019)
0.5
Total capacity mn t/yr
1.5
Estimated production 2019
3.0
argusmedia.comArgus news and analysis
Nantong closure to increase Chinese sulphur prices EU developments on AN, UAN and phosphates
Discharge of sulphur at the Langshan berth at Nantong port in Three regulation-related developments occurred in the sec-
the Yangtze river was to be wound down by the end of 2018. ond half of 2018. Uncertainty generated by these events is
Nantong is China’s largest sulphur discharge ports, with the likely to persist in 2019.
highest storage capacity.
The EU in mid-August officially began anti-dumping proceed-
Nantong has in the past stored in excess of 800,000t of ings against UAN solutions imports from Russia, the US, and
sulphur at any one time. When total sulphur inventories at Trinidad and Tobago. This followed a complaint made in June
Chinese ports reached a three-year high of 1.8mn t in August by manufacturers’ body Fertilizers Europe.
2016, Nantong accounted for 730,000t. But Zhenjiang will now
become the key port for sulphur imports, although its capac-
The European Commission noted “sufficient” evidence of
ity is lower than Nantong’s. It has had a weekly maximum
raw-material distortions in Russia because of dual pricing for
capacity of around 680,000t in the past three years, and has a
gas, a highly significant UAN production cost. The commission
weekly average of around 305,000t compared with Nantong’s
said Fertilizers Europe had provided evidence of an increase
500,000t. Expansion work will increase sulphur storage ca-
pacity at Zhenjiang to 0.8mn-1mn t, but this was not expected in absolute terms and market share of imports from Russia,
to be completed in time for the full closure of sulphur dis- Trinidad and Tobago, and the US, as well as a negative impact
charge operations at Nantong port on prices charged and market share held by EU producers.
The investigation into dumping and injury covers imports to
Because of this, storage options for trading firms and end- the EU from 1 July 2017 to 30 June 2018, of which almost two
users will affect liquidity on both a cfr China and Yn/t ex- thirds went to France. A decision on the case could be made
works basis, especially as the Yangtze river area is the hub in the first week of February, at around the same time as Eu-
of domestic Yn/t sulphur trade. On a Yn/t basis, domestic rope's spring application season begins.
Chinese traders have and will continue to lose out on stor-
age capacity. But this will not easily allow traders to import The EU in mid-November finalised a decision to reduce anti-
cfr cargoes for later sale on a Yn/t basis to consumers in the dumping duties on most Russia-produced AN by around a
Yangtze river area. This will lead to reduced liquidity on the third, taking them to a uniform rate of €32.71/t. The move
domestic ex-works spot market, and the lower availability came after European farmers and co-operative federation
will increase prices. On a cfr basis, the lower storage capacity Copa Cogeca, among others, called for the EU to abolish
available to traders means that they will not be able to import anti-dumping duties and taxes on a range of fertilizer im-
as much as before. But end-users will most likely increase ports. Copa Cogeca had specifically asked the EU to remove
their cfr import activity as ex-port inventories will be reduced. anti-dumping duties on AN imports from Russia, which have
And what is available will be at elevated prices that are not been in place since August 1995.
necessarily competitive with cfr imports. As a result, end-
users will become more active on the cfr market covering the
But the commission decided to retain the duties — albeit at
trader deficit and will help support prices compared with late
lower levels — after a case review that lasted for over a year.
2018, in which cfr China prices trended lower than was usual
Duties on the majority of Russia-produced AN were reduced
for the time of year.
by 30.5pc to €32.71/t, from €47.07/t previously. Duties on AN
We will be closely monitoring this and other developments in produced by Eurochem in Russia were cut to the same level,
the sulphur and sulphuric acid sectors, providing essential from €32.82/t previously. The duties again centred on the
analysis through our sulphur and sulphuric acid prices, fore- price of natural gas, which accounts for 60-70pc of the total
casts and analysis services. cost of AN production. Russian producers have far lower gas
costs than their EU counterparts.
Click here for more information on sulphur and sulphuric acid.
Fertilizers Europe said Russian producers are able to compete
Inventories at Nantong and Zhenjiang port unfairly with EU firms as a result of an “artificially low”, non-
mn t
market-based gas price. This “state-fixed cost base” encour-
1.2 ages “structural dumping”, Fertilizers Europe director-general
Nantong Zhenjiang
Jacob Hansen said ahead of the commission's decision.
1.0
The amendment to the duties is unlikely to have a signifi-
0.8 cant impact, at least in the short term, on the EU market. A
€32.71/t tariff on imports to the EU, combined with a basic
0.6 third-country duty of 6.5pc that is also in effect, makes cost-
effective trade difficult. And many potential buyers are un-
0.4 likely to be willing to purchase Russian AN for the time being.
0.2
But for Russian producers, selling at a cheap enough price
while still making trade economically viable is a possibility,
0.0
2016 2017 2018 with the duties now at the reduced level. If buyers do become
argusmedia.comArgus news and analysis
interested, and Russia-based producers consider it worth- Click on these hyperlinks to read more market-moving stories
while, imports of Russian AN to the EU could ramp up signifi-
cantly at some point. Asia NPK market to heat up in 2019
Competition among sellers in the Asian NPK market is ex-
For now, EU-based nitrates producers will probably be able to pected to heat up this year amid rising exports from China and
retain a level of price security, until such a time as the duties increased domestic capacity within the region.
are reduced by a greater degree and/or international relation- China, the world’s leading NPK producer, ramped up its NPK
ships change. exports from a low base last year, and the trend could con-
tinue in 2019.
AN and CAN prices in Europe tend to carry a significant
Continue reading >>
premium to urea, the other major source of straight nitrogen.
The price per unit of nitrogen in urea was around €7.12 on an
Yuzhny ammonia market in spotlight for 2019
fca basis, based on Argus assessments for the French market
The Yuzhny market is in the spotlight in 2019. Buyers are
at the beginning of November 2018, compared with €8.38 in
imported AN 34. focusing on whether fob prices out of the Ukrainian port are
competitive enough to absorb additional freight costs in-
The premium is a result of a number of factors, including curred by the long transit time from the Dardanelles to Yuzhny.
the high costs for gas incurred in production. There is also a As well as seasonal weather conditions, delays have been
nitrogen-nutrient efficiency associated with nitrates, a family caused by new regulations that make tug boat assistance and
of fertilizers that is a firm favourite among farmers in several daylight travel mandatory for all LPG vessels over 150m in
European countries, that helps to justify the premium. length passing through the Bosphorus and Dardanelles.
Continue reading >>
The EU's retention of robust duties on Russian AN should help
ensure that EU-based nitrates producers can continue to price Potash sellers make hay while the sun shines
products significantly above urea, in terms of cost per unit of Potash suppliers enjoyed good times in 2018 thanks to sub-
nitrogen, for the immediate future. stantial price rises in Asia and elsewhere.
A $50/t increase in the annual India contract, a $60/t rise in
Finally, a few days after the AN anti-dumping decision, nego- the annual China contract, and southeast Asia spot values
tiators from the European Parliament and EU member states ending 2018 at around three-year highs all helped to create a
agreed on a cadmium (Cd) limit of 60mg Cd/kg P2O5 for fin- positive story for MOP sellers in Asia.
ished phosphate fertilizers. The limit is unlikely to drastically But the question being increasingly asked now is how much
disrupt current trade flows — around 75pc of OCP's phos- longer will this uptrend last?
phate rock from Morocco is unaffected. But it will be interest-
Continue reading >>
ing to see whether Russian producers can effectively market
their 'low-cadmium' product and garner a price premium.
Mixed prospects for European polyhalite
Polyhalite is a minor product in the context of the European
We will be closely monitoring this and other developments in
fertilizer market, but it has attributes that could allow it to
the nitrogen and ammonia sectors, providing essential analy-
sis through our nitrogen and ammonia prices, forecasts and grow significantly.
analysis services. The sole supplier is Israeli fertilizer and chemicals company
Click here for more information on nitrogen. ICL, producing in the UK from a substantial North Sea re-
Click here for more information on ammonia. source. But UK firm Sirius Minerals plans to begin production
by 2021, increasing availability for the multi-nutrient mineral.
France UAN Imports by origin When, how and even whether Sirius will ultimately enter the
France 2017-18 UAN imports by origin
’000t
Other Trinidad and Tobago Russia US
- 2.08mn t in market remain topics of debate.
2017-18
250 Continue reading >>
200
Confidence in South African agriculture falls further
150
The South African agricultural sector’s confidence in its future
100 prospects has fallen to a nine-year low as a result of uncer-
50
tainty over the government’s land reform policy, an industry
survey shows.
0
Continue reading >>
Jul Aug Sep Oct Nov Dec Jan Feb Mar Apr May Jun
2016-17
2015-16
0 500 1,000 1,500 2,000 2,500
- Eurostat
argusmedia.comYou can also read