Global Investment Outlook 2021 - Business-cycle reset ABN AMRO Investment Solutions - ABN AMRO Investment ...
←
→
Page content transcription
If your browser does not render page correctly, please read the page content below
1

  ABN AMRO Investment Solutions

Global Investment Outlook 2021
Business-cycle reset
  December 2020

  This document is for information purposes only and does not constitute investment recommendation.
  For professional clients only.
Global Investment Outlook 2021   2

Global Investment
Outlook 2021
Macro
Global Investment Outlook 2021                                                                                                                                                                          3

Macro Outlook 2021

                                                                  GROWTH                                                         INFLATION
        Business-                                                 Following many years of late-cycle dynamics, the
                                                                  coronavirus pandemic caused a deep recession
                                                                                                                                 We see limited drivers of substantial inflation
                                                                                                                                 before 2022. A large amount of money is waiting to
                                                                                                                                                                                      KEY
                                                                                                                                                                                      TAKEAWAYS

        cycle reset
                                                                                                                                 be spent and Covid-19 could accelerate the           A return to early-cycle
                                                                  that has set a low base from which to rebound.
                                                                                                                                 process of de-globalisation. But low inflation is    dynamics while the
                                                                  We now face early-cycle dynamics not seen for a
                                                                                                                                 also structural (demographics, digitization, etc.)   Covid crisis reset the
                                                                  decade: above trend-line GDP and corporate
                                                                                                                                 and the pandemic may have boosted productivity.      business cycle. We see
                                                                  earnings growth and rock-bottom interest rates.
                                                                                                                                                                                      no substantial reflation
                                                                                                                                                                                      at few quarters horizon.
                                                                                                                                                                                      High political pressure
                                                                                                                                                                                      on central banks to
  MONETARY POLICY                                                 POLITICS                                                      GEOPOLITICS                                           keep rates low in a high
                                                                                                                                                                                      debt environment.
                                                                                                                                                                                      The         shift      to
  Central banks remain attentive to downside risks.               The end of Donald Trump’s presidency is not the               Supply chains become shorter and more
                                                                                                                                                                                      sustainability, and the
  They have already discussed possible ways to                    end of populism in the US or more broadly. This               diversified. Geopolitical uncertainty and wage-cost
                                                                                                                                                                                      joint monetary -
  adjust monetary policy if more accommodation is                 probably means continued political and                        convergence have been shortening global supply
                                                                                                                                                                                      fiscal policy implicit
  needed. Towards a new policy framework (flexible                geopolitical turmoil, but more importantly, it also           chains for more than a decade already. The
                                                                                                                                                                                      coordination are being
  average inflation) tolerating inflation to overshoot            makes additional fiscal stimulus by governments               coronavirus pandemic added further impetus to
                                                                                                                                                                                      accelerated.
  to make up for past misses of their target.                     more likely to address the causes of populist                 this trend. The ongoing transformation of supply
                                                                  discontent.                                                   de-globalization could lead to regionalisation.

ABN AMRO Investment Solutions: This document is for information purposes only and does not constitute investment recommendation. For professional clients only – December 2020
Global Investment Outlook 2021 4
Macro Outlook
GDP and manufacturing growth
The swift and massive shock of the COVID-19 pandemic and shutdown measures to contain it have plunged the global economy into a severe contraction, the
worst since World War II. But a divergence remains between industry and GDP, dominated by services. The Services sector is lagging the global activity
rebound. The recovery gap between manufacturing and services will be reinforced by last lockdown measures.
01.01.1990
01.12.1990
01.11.1991
01.10.1992
01.09.1993
01.08.1994
01.07.1995
01.06.1996
01.05.1997
01.04.1998
01.03.1999
01.02.2000
01.01.2001
01.12.2001
01.11.2002
01.10.2003
01.09.2004
01.08.2005
01.07.2006
01.06.2007
01.05.2008
01.04.2009
01.03.2010
01.02.2011
01.01.2012
01.12.2012
01.11.2013
01.10.2014
01.09.2015
01.08.2016
01.07.2017
01.06.2018
01.05.2019
01.04.2020
01.01.1991
01.12.1991
01.11.1992
01.10.1993
01.09.1994
01.08.1995
01.07.1996
01.06.1997
01.05.1998
01.04.1999
01.03.2000
01.02.2001
01.01.2002
01.12.2002
01.11.2003
01.10.2004
01.09.2005
01.08.2006
01.07.2007
01.06.2008
01.05.2009
01.04.2010
01.03.2011
01.02.2012
01.01.2013
01.12.2013
01.11.2014
01.10.2015
01.09.2016
01.08.2017
01.07.2018
01.06.2019
01.05.2020
World GDP World Manufacturing Production World GDP World Manufacturing Production
260 240 12% 0,12
240 220 8% 0,08
220 200 4% 0,04
200
180 0% 0
180
160 -4% -0,04
160
140 -8% -0,08
140
120 120 -12% -0,12
100 100 -16% -0,16
80 80 -20% -0,2
1990 1993 1996 1999 2002 2005 2008 2011 2014 2017 2020 1991 1994 1997 2000 2003 2006 2009 2012 2015 2018
World GDP and Manufacturing Production in USD (100 in Q1 1990) World GDP and Manufacturing Production y/y growth
Sources: Datastream, IMF, OECD, Year-on-Year changes, Quarterly data in USD from Q1 1990 to Q3 2020, ABN AMRO Investment Solutions.
ABN AMRO Investment Solutions: This document is for information purposes only and does not constitute investment recommendation. For professional clients only – December 2020Global Investment Outlook 2021 5
Macro Outlook
Global Economic Surprises Emerging Market Economic Surprises Global Developed Economic Suprises
80
60
Between the 2 waves of the COVID-19 pandemic, the
activity strongly rebounded. The Economic Surprises
40
surged with the reopening of developed economies in
May. This post re-opening recovery was also helped by
20
governments’ stimulus packages and central banks’
pandemic emergency decisions.
0
The activity is expected to slowdown at the end of 2020 -20
with the new (partial) lockdowns decided in Europe.
However, we expect that the global activity will quickly -40
rebound in H1 2021. Some of restrictions on mobility and
the closure of shops in parts of Europe can be eased -60
gradually after some improvement in virus trends. 01.15 09.15 05.16 01.17 09.17 05.18 01.19 09.19 05.20
Indices of Global Developed and Emerging Market Economic Surprises
Source: Bloomberg, weekly data, 01/01/2015–27/11/2020. The Global Developed Economic Surprises index is a weighted average of Bloomberg economic surprise indices for US (ECSURPUS Index; 60%), eurozone (ECSURPEA Index;
35%) and UK (ECSURPGB Index; 5%). The Emerging Market Economic Surprises Index is the Citigroup Emerging Market Index (CESIEM Index) ABN AMRO Investment Solutions.
ABN AMRO Investment Solutions: This document is for information purposes only and does not constitute investment recommendation. For professional clients only – December 2020Global Investment Outlook 2021 6
Macro Outlook
Consumption of goods and services during the COVID-19 recession
3.250 12.500
The Great lockdown across the world led to a sudden 3.000
NBER Recessions Nondurable Goods (left)
12.000
stop in household consumption. Helped by policy makers’ Durable Goods (left) Services (right)
2.750 11.500
ultra-accommodative, monetary and regulatory response
to the pandemic, the consumption of Durable and 2.500 11.000
Nondurable goods has surged (V-shape) with reopening 2.250 10.500
economies. 2.000 10.000
Billions $
Billions $
1.750 9.500
The services were the most hit by the COVID-19 pandemic
such as restaurants, travel, leisure and transport. The 1.500 9.000
rebound of the services activity is lagging especially with 1.250 8.500
the restrictions to contain the second wave. 1.000 8.000
750 7.500
In past recessions, on the contrary, we observed smooth
services and procyclical manufacturing activity. 500 7.000
250 6.500
The progressive lift of restrictions (lockdowns, curfews)
0 6.000
as well as the approbation of a vaccine (Pfizer, Moderna) 01.02 07.03 01.05 07.06 01.08 07.09 01.11 07.12 01.14 07.15 01.17 07.18 01.20
against the COVID-19 should accelerate the recovery in
the services consumption. US Real Personal Consumption
Source: Datastream, US Bureau of Economic Analysis, NBER, monthly data, 01/01/2002–01/10/2020. Billions of 2012 Chained prices in USD. ABN AMRO Investment Solutions.
ABN AMRO Investment Solutions: This document is for information purposes only and does not constitute investment recommendation. For professional clients only – December 2020Global Investment Outlook 2021 7
Macro Outlook
Restaurants are close (close early) but trucks keep rolling
The Global lockdown in March and April have plunged the economic activity by up to 30%. The curfews and “partial” lockdowns decided to contain the second
wave of the pandemic were much less severe. The worst hit sub-sectors by the new measures are especially the accommodation and food services. But
industrial and manufacturing activity continue to run with factories allowed to open during the lockdowns.
80% 140
Canada Germany
60% Seasonnally adjusted values 7-day average
UK US 130
40%
20% 120
0%
110
-20%
-40% 100
-60%
90
-80%
-100% 80
24.02 24.03 24.04 24.05 24.06 24.07 24.08 24.09 24.10 24.11 01.01 01.02 01.03 01.04 01.05 01.06 01.07 01.08 01.09 01.10 01.11
Seated diners from reservations (y/y 7-day moving average) German Trucks Toll Mileage 2020 Index
Sources: OpenTable, German Federal Statistical Office (Statistisches Bundesamt, Destatis), daily data from 01/01/2020 to 30/11/2020. ABN AMRO Investment Solutions.
ABN AMRO Investment Solutions: This document is for information purposes only and does not constitute investment recommendation. For professional clients only – December 2020Global Investment Outlook 2021 8
Macro Outlook
Eurozone Real Money Supply vs. Real GDP
In the eurozone’s bank-based financial system, M1 money
supply remains a leading indicator of real GDP growth.
After the Global Covid-19 Crisis, we can expect a pick-up
in 2021 eurozone growth.
A lot of cash is available and waiting. With reopening
after the first lockdown, a part of this cash has been
consumed, but precautionary savings remain
(uncertainty, “lockdown insurance”, Ricardian
equivalence effect).
Our scenario is that this cash will be used progressively
later (in few months/quarters) leading to higher demand
and then increasing Capex and slightly more inflation (as
well as asset prices).
Eurozone Real Money Supply is leading Real GDP y/y growth
Source: Bloomberg, ECB, Eurostat, Quarterly data from 01/01/1992–24/11/2020. Year-on-year changes in %. Real M1 money supply, deflated by consumer prices, advanced by 3 quarters on the right-hand scale. Real GDP on the left-hand
scale. ABN AMRO Investment Solutions.
ABN AMRO Investment Solutions: This document is for information purposes only and does not constitute investment recommendation. For professional clients only – December 2020Global Investment Outlook 2021 9 Global Investment Outlook 2020 Markets
Global Investment Outlook 2021                                                                                                                                                                         10

Market Outlook

                                                                                                                                                                                       KEY
                                                                  EQUITIES                                                       STYLES                                                TAKEAWAYS

                MARKETS                                           Equities remain our preferred asset class.
                                                                  Emerging markets equities offer the highest risk-
                                                                                                                                 We favour Small and Quality factors for their
                                                                                                                                 resilience. Despite long-term support (strong
                                                                                                                                                                                       Equities will probably
                                                                                                                                                                                       benefit      from
                                                                                                                                                                                       economic recovery and
                                                                                                                                                                                                             the
                                                                  return trade-off (valuations). Equities are one of             fundamentals, digitization, low interest rates, ESG
                                                                  the few asset classes that still offer attractive              appetite) for growth stocks, rotation risks on        the        early cycle
                                                                  yields with High Return Debt and Emerging Debt.                cyclical/defensive are high with vaccine news.        dynamics.
                                                                                                                                 We prefer a neutral position on value-growth.         High      forced     and
                                                                                                                                                                                       precautionary savings
                                                                                                                                                                                       will progressively be
                                                                                                                                                                                       spend. This will be
                                                                                                                                                                                       directly or indirectly in
                                                                  CREDIT                                                                                                               favour of risky assets.
  INTEREST RATES                                                                                                                 VOLATILITY                                            The combination of high
                                                                                                                                                                                       debt and low yield for
  Major central banks have signalled their intention              Like every recession, credit spreads widened.                  Volatility will remain probably volatile during the   less-risky assets would
  to maintain low interest rates a long way out on                However, rapid and substantial fiscal and                      first-half of the year amid news about vaccine        reinforce the “There Is
  the yield curve. This will prevent a too strong                 monetary stimulus made this an exceptionally                   campaign issues and economic policy news. We          No Alternative” effect .
  steepening of the yield curve usually observed in               short-lived phenomenon, leaving investors with a               see a low volatility regime take hold later in the
  the early-stage of the business cycles.                         mix of early- and late-cycle characteristics (some             second half of the year.
                                                                  defaults to come while spreads are low).

ABN AMRO Investment Solutions: This document is for information purposes only and does not constitute investment recommendation. For professional clients only – December 2020
Global Investment Outlook 2021 11
Market Outlook
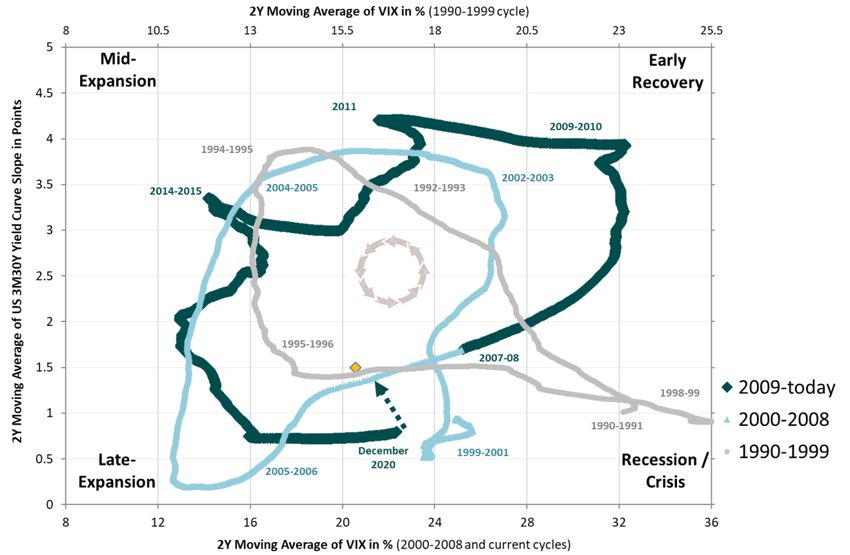
The Macro Financial Clock
With structural shifts toward low inflation (flat Phillips Curve,
digitisation, globalisation, shrinking worker bargaining
power) and low real interest rates (demographics, capital
price, excessive savings, etc.), end of business cycles are
no longer characterised by inflation and monetary
tightening. We have to monitor business cycle developments
with new tools.
Changing US financial conditions over the last three cycles
have been counter-clockwise. Indeed, volatility tends to rise
before a recession and ease with the recovery whilst the
yield curve flattens before a recession and picks up during
the recession.
The end of the longest economic cycle in history was
precipitated by the shutdown of the global economic activity
to stem the coronavirus outbreak. Volatilities hit record high
while the yield curve stayed flat, typical movements in crisis
time. Now, easing volatilities and modestly steepening yield
curve signal the dawn of a new business cycle. A renewed cycle with more favourable conditions
Sources: Datastream, daily data from 01/01/990 to 30/11/2020. The yellow point represents spot conditions.
ABN AMRO Investment Solutions.
ABN AMRO Investment Solutions: This document is for information purposes only and does not constitute investment recommendation. For professional clients only – December 2020Global Investment Outlook 2021 12
Market Outlook
Ultra-low interest rates environment
Central banks across the globe turned more accommodative than ever to support the economic activity in 2020. Bond purchase programs and other
stimulating tools drive interest rates to historic lows while spreads remain tight (e.g. Portugal sovereign debt). Fixed income asset returns are set to stay low
for a long time.
18 16 25 8
Yield-to-Maturity
16 14 7
Spread vs France
14 20
12 Global High Yield (%) 6
12 Global IG Corporate (%)
10 5
15
10
8 4
8
6 10
3
6
4 2
4
5
2 2 1
0 0 0 0
2007 2009 2011 2013 2015 2017 2019 1999 2001 2003 2005 2007 2009 2011 2013 2015 2017 2019
Portugal 10Y Sovereign Debt (%) at historic low levels Yield on main fixed-income asset securities continue to fall
Source: Bloomberg, France and Portugal 10Y sovereign bond yield-to-maturity. Source: ICE BofAML, Global High Yield Constrained Regular Rebalanced Index and Global
Investment Grade Non-sovereign Index yield-to-worst.
ABN AMRO Investment Solutions: This document is for information purposes only and does not constitute investment recommendation. For professional clients only – December 2020Global Investment Outlook 2021 13
Market Outlook
Lasting factor rotation or temporary market overreaction
Positive announcements on vaccines effectiveness against the COVID-19 triggered a “Black Swan” movement on stock markets. Momentum stocks that
overperformed since the beginning of the crisis were heavily dumped by investors in favour of more cyclical/value stocks that suffered the most of the
pandemic consequences.
20%
15%
15% Stoxx 600 constituents
Value-Momentum Europe
10% 10%
YtD return
9/11/2020 5%
Daily Return
5%
0%
-60% -40% -20% 0% 20% 40% 60% 80% 100%
0%
-5%
-10%
-5%
-15%
-10%
1999 2001 2003 2005 2007 2009 2011 2013 2015 2017 2019 -20%
9/11/2020 daily return
A “Black Swan” on factors YtD return explains most of the cyclical stocks outperformance
Source: Bloomberg, MSCI Europe Value Index daily returns - MSCI Europe Momentum Index daily Source: Datastream, daily and YtD performances of individual constituents of the Stoxx 600
returns.
ABN AMRO Investment Solutions: This document is for information purposes only and does not constitute investment recommendation. For professional clients only – December 2020Global Investment Outlook 2021 14
Market Outlook
How factors perform in highly volatile markets
Value factor (relative to growth) significantly underperformed as Energy and Financial sectors were penalized by respectively lower oil demand and reduced
interest margins. On the other hand, small size companies were preferred during the rebound amid stable credit conditions and weak interest rates. While the
minimum volatility factor offered protection to investors during the market downturn, it underperformed with rebounding equities.
5 3
4
Europe 2
US
(performance/standard deviation)
(performance/standard deviation)
3 1
2
Sharpe Ratio
Sharpe Ratio
0
1
-1
0
-2
-1 01/01/2020-16/01/2020 (pre-covid)
01/01/2020-16/01/2020 (pre-covid)
17/01/2020-23/03/2020 (market selloff)
17/01/2020-23/03/2020 (market selloff) -3
-2 24/03/2020-27/11/2020 (rebound)
24/03/2020-27/11/2020 (rebound)
01/01/2020-27/11/2020 (YtD) 01/01/2020-27/11/2020 (YtD)
-3 -4
Value Small Quality Momentum Min Vol Value Small Quality Momentum Min Vol
Source: Bloomberg, MSCI Europe (Blend), MSCI Value Europe, MSCI Growth Europe, MSCI Small Europe, , MSCI Large Europe, MSCI Quality Europe, MSCI Momentum Europe, MSCI Min Vol Europe, MSCI
USA (Blend), MSCI Value USA, MSCI Growth USA, MSCI Small USA, , MSCI Large USA, MSCI Quality USA, MSCI Momentum USA, MSCI Min Vol USA. Value is relative to Growth, Small is relative to Large and
Quality, Momentum and Min Vol are relative to Blend,
ABN AMRO Investment Solutions: This document is for information purposes only and does not constitute investment recommendation. For professional clients only – December 2020Global Investment Outlook 2021 15 Global Investment Outlook 2020 Risks
Global Investment Outlook 2021                                                                                                                                                                                  16

Risk Outlook
What we are watching in 2020
   MACROECONOMICS
Too many stop and go policies                                              Vaccine logistic: people and frozen chain                                  Vaccine acceptation: achieving or not herd community
As Europe and the US face a new wave, the virus's apparent                 Moderna’s vaccine has to be shipped at –20°c and stored at that            The success of any vaccine depends on the share of the
seasonality could lead to further periods of partial lockdown by           temperature for six months. Pfizer’s vaccine must be kept at –             population that gets vaccinated. According to some simulations,
next winter putting public debt under pressure.                            70°c. Once transferred to a refrigerator, it must be administered          a vaccine will benefit public health by saving many lives but
                                                                           within 30 and 5 days respectively.                                         nevertheless may.

   MONETARY POLICY
Inflation surprises                                                        The Fed-Treasury nexus                                                     Central bank credibility
Inflation is unlikely to rise much over the next two-to-three years.       President-elect Joe Biden's nomination of Janet Yellen is a                By making the fight against global warming one of its priorities,
However, post-Covid crisis, inflation would be volatile from time          significant signal for the Biden administration's economic policy,         the European Central Bank is starting an alarming development,
to time with some extreme surprises fuelling the market sentiment          from near-term stimulus to Fed-Treasury cooperation. Will the              according to some commentators. The risk is to jeopardize its
that ‘great inflation is coming’.                                          Fed remain fully independent?                                              credibility patiently built over many years

   POLITICS
Elections and political events                                             De-globalization                                                           Brexit
In the next twelve months, from Peru to India, the Netherlands to          The heyday of globalization is behind us. Globalization is on the          Those hoping that Brexit will disappear of the news agenda
Australia, many elections are scheduled. But the future of the             back foot, with the ratio of trade-to-output moving sideways for           forever from 2021 may be a little disappointed. Even if a deal is
Senate majority (fiscal stimulus plans and level of US long term           more than a decade. The risk is that the “Trade-war’ by former             agreed, it will inevitably be a basic one. A free-trade agreement
yields) will depend on the second round of elections in Georgia            president Trump will evolve in “securing supply-chain” conflicts.          will avoid tariffs but may not prove to be a particularly sustainable
on January 5, 2021.                                                                                                                                   trading platform in the long-term.
ABN AMRO Investment Solutions. This document is for information purposes only and does not constitute investment recommendation. For professional clients only – December 2020.
Global Investment Outlook 2021 17
Risk Outlook
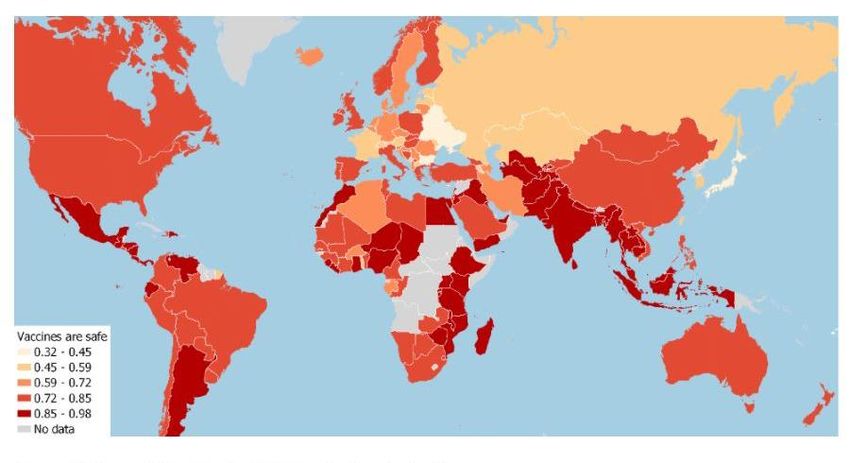
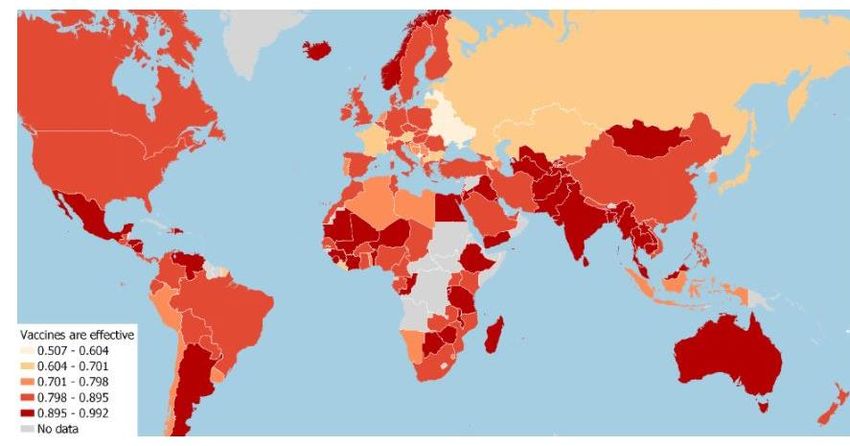
Vaccine challenges
Huge challenges remain before a vaccine can be rolled out. The global But some experts argue that the most difficult challenge may actually be
battle to secure prospective supplies has raised alarm about equitable getting people to take it. A September survey of more than 10,000
access, while questions remain over logistics, distribution, and, perhaps Americans showed that only a slim majority of adult respondents would
most significantly, cost, as well as efficiency over the long-term. The definitely or probably get a vaccine to prevent Covid-19, were it available
challenges of manufacturing and distributing the vaccine lie ahead today. A 2018 study shows that vaccine scepticism is even greater in a
number of other countries.
Share of respondents who agree that vaccines are safe Share of respondents who agree that vaccines are effective
Source: Aksoy, C, B Eichengreen and O Saka (2020), “Revenge of the Experts: Will COVID-19 Renew or Diminish Public Trust in Science,” SSRN.org, May. And Wellcome Trust
(2018), Wellcome Global Monitor 2018.
.
ABN AMRO Investment Solutions: This document is for information purposes only and does not constitute investment recommendation. For professional clients only – December 2020Global Investment Outlook 2021 18 Disclaimer
Global Investment Outlook 2021                                                                                                                                                                                                                                        19

Disclaimer
   ABN AMRO Investment Solutions - AAIS
   Limited company with Executive and Supervisory Board capital of 4,324,048 Euros
   registered with the RCS Paris under number 410 204 390,
   Head office: 3, avenue Hoche, 75008 Paris, France,
   Approved by the AMF, dated 20/09/1999,
   as a portfolio management company under registration number GP99-27

This promotional document prepared by ABN AMRO Investment Solutions (“AAIS”) does not constitute a solicitation to buy, an offer to sell or legal or tax advice. On no account does it constitute a personalised recommendation or investment advice. Before making any
investment decision, the investor is responsible for assessing its risks and for ensuring that the decision is consistent with his objectives, his experience and his financial circumstances.
The investor’s attention is drawn to the fact that information on the products featured in this document is no substitute for the completeness of the information contained in the fund’s legal documentation that you have been given and/or that is available free of charge on
request from AAIS or on the website www.abnamroinvestmentsolution.com

Before making any investment, the investor must pay particular attention to the risk factors and carry out his own analysis that takes into account the need to diversify investments. All investors are encouraged to take advice on this matter from their regular legal, tax,
financial and/or accounting advisors before making any investment.
The information and opinions contained in this document are for general information only. They are taken from sources that AAIS considers trustworthy, but no guarantee can be given as to their accuracy, reliability, validity or completeness. Past performance is not a
guide to the future performance of the fund and/or the financial instruments and/or the financial strategy described therein. Performance data do not take into account any commissions paid on the subscription or acquisition of financial instruments. No guarantee can be
given that the described products will achieve their objectives. Investing in financial instruments carries risks and investors may get back less than the amount of their investment. When a financial investment is denominated in a currency other than your own, the
exchange rate may have an impact on the amount of your investment. The tax treatment differs according to each client’s particular circumstances. It is therefore strongly recommended that, before investing, you take advice on the appropriateness of the investment to
your objectives and your legal and tax circumstances.
It is your responsibility to ensure that the regulations to which you are subject, depending on your status and your country of residence, do not prevent you from investing in the products or services described in this document. Access to products and services may be
restricted for certain persons or in certain countries. For additional information, you should contact your regular advisor.
Complaints may be sent free of charge to the AAIS customer service department using the following email address: aais.contact@fr.abnamro.com

This document is intended only for its original addressees and may not be used for anything other than its original purpose. It may not be reproduced or distributed, in whole or part, without the prior written consent of AAIS and AAIS shall not be held responsible for any
use made of the document by a third party.
The names, logos or slogans identifying AAIS’s products or services are the exclusive property of AAIS and may not be used for any purpose whatsoever without the prior written consent of AAIS.
Global Investment Outlook 2021 20
You can also read


