Global Market Outlook - For Solar Power / 2019 2023 - Solar Power Europe
←
→
Page content transcription
If your browser does not render page correctly, please read the page content below
Global Market Outlook
For Solar Power / 2019 - 2023

Supported by:

Mobilising Investments
                                                       in Emerging Markets
                                                                              ACCESS TO FINANCE
                                                                              GET.invest’s Finance Catalyst delivers advisory services for
                                                                              the preparation of decentralised renewable energy projects
                                                                              and connects your business to financing.

                                                                              NETWORKING & INFORMATION EVENTS
                                                                              Our information and networking sessions stimulate
                                                                              cooperation and new business development.
                                                                                                                                                          Caption to image. © SPE

                                                                              MARKET INFORMATION
                                                                              We provide investors, project and business developers with
                                                                              critical market intelligence for informed decisions.

                                                                              FUNDING DATABASE
                                                                              Navigate the complex landscape of funding sources and find
                                                                              out which instrument suits your renewables project or business.
Picture credits © Alliance for Rural Electrification

                                                       www.get-invest.eu                                                                        @GET_invest             GET.invest

                                                       GET.invest is supported by
FOREWORD

Welcome to SolarPower Europe’s Global Market Outlook 2019 – 2023.
The year 2018 was unique to us – we won the title ‘Overall Best European Association’ at the European Association
Awards 2019 at a time when the European solar market has entered another growth phase. We expect this growth
to continue beyond 2020 as the European Union has provided a legislative energy package that lives up to its name,
‘Clean Energy for All Europeans’. It is now about the implementation of these directives into member states’ laws –
and we are looking forward to supporting our national members in their efforts to push the solar business case in
their home markets – creating future high-tech jobs as we are fighting climate change.
This Global Market Outlook 2019 – 2023 is a manifesto of our successful work that has only been possible through
close cooperation with our members: companies active across all parts of the solar value chain from around the
world, and national solar and storage associations from many European countries. We are again very thankful to
the Global Solar Council (GSC) and its members for providing deep insights into their home countries for our GW-
markets chapter, which now includes overviews on the 11 leading solar markets, a number that is quickly rising.
Contributions of solar associations from all continents have made this Global Market Outlook evermore a truly
global collaborative effort.
2018 was also a unique year for the entire global solar industry, as we were able to exceed the magic installation
mark of 100 GW per year for the first time. This led the solar power generation fleet to grow to over 500 GW or 0.5
TW. We were seeing again strong cost improvements; new applications unfolding, such as floating solar; corporate
renewable Power Purchase Agreements reaching a double-digit GW-level; and a market for merchant solar starting
to emerge in several markets (for more trends, please check our Solar Trends Chapter).
However, unlike in the previous two years, with 30-50% annual growth rates, solar demand rose in the single-digit
range in 2018, as the world ‘s largest market China suddenly decided to restructure its incentives scheme to make
solar fit for the next growth phase. The good news is that despite China’s solar restructuring, global solar demand
continued to grow last year, as new and emerging solar markets, as well as Europe, have been embracing solar’s
attractive business proposition – a truly clean, highly versatile and very low-cost power generation source. This
market diversification means interest in solar is quickly rising around the globe, which will minimise risks to the
sector if demand in any of the bigger solar markets stumbles for some reason.
Solar’s short slowdown is luckily already behind us. Until 2021, we expect two-digit growth rates that will more than
double the total installed solar power capacity within four years – from 0.5 TW at the end of 2018, to over 1.1 TW by
the end of 2022. This sounds impressive, but when taking into consideration that global CO2 emissions rose to a
new high last year – and knowing that solar and other renewables are key to solve that overarching issue, growth
needs to speed up dramatically. In any case, the solar industry is ready for much more!
Enjoy reading our Global Market Outlook.

                                                                                  Thanks to our Sponsor Members:

WALBURGA            MICHAEL SCHMELA
HEMETSBERGER        EXECUTIVE ADVISOR
CEO

                                                     SolarPower Europe / GLOBAL MARKET OUTLOOK FOR SOLAR POWER 2019-2023 / 3
TABLE OF CONTENTS

                                                            FOREWORD                                                                                                        3
                                                            EXECUTIVE SUMMARY                                                                                               5
                                                            1     GLOBAL SOLAR MARKET                                                                                       7
                                                                  UPDATE 2000 – 2018                                                                                        7
                                                                  PROSPECTS 2019 – 2023                                                                                    17
                                                                  PROSPECTS 2019 – 2023 / SEGMENTS                                                                         24

                                                                TRENDS WHAT’S COOL IN SOLAR                                                                          27
                                                                  1  Digital Solar & Storage I – What solar prosumers really need                                    28
                                                                  2  Digital Solar & Storage II – Unleashing large-scale solar
                                                                     & storage through grid intelligent solar                                                        30
                                                                  3 BIPV – The next generation is ready for the mass market                                          33
                                                                  4 Solar Mobility – Electrification of the transport
                                                                     sector will rely heavily on solar                                                               35
                                                                  5 Taking care – Sustainability in solar                                                            37
                                                                  6 Asset Management 2.0: More transparency,
                                                                     more digitalisation                                                                             38
                                                                  7 Corporate Sourcing of renewables – Why corporates
                                                                     increasingly strive to go 100% RE                                                               40
                                                                  8 Tenders – Towards intelligent tenders                                                            42
                                                                  9 Emerging Markets – Joint efforts to mitigate risks
                                                                     and scaling solar                                                                               44
                                                                  10 Solar + hydrogen – The perfect match for a
                                                                     Paris-compatible hydrogen strategy?                                                             47
                                                                  11 Technology update: What’s hot in solar                                                          49

                                                            2     GW-SCALE SOLAR POWER MARKETS IN 2018                                                                    53
                                                            3     THE EUROPEAN SOLAR MARKET                                                                               79
                                                                  UPDATE 2000 - 2018                                                                                      79
                                                                  UPDATE 2000 – 2018 / SEGMENTS                                                                           82
                                                                  PROSPECTS 2019 – 2023                                                                                   84
                                                            4     GLOBAL MARKET OUTLOOK FOR SOLAR POWER                                                                   88

Project manager & lead author: Michael Schmela, SolarPower Europe.

Market intelligence: Raffaele Rossi, Michael Schmela, SolarPower Europe.

Internal co-authors: Aurélie Beauvais, Naomi Chevillard, Mariano Guillén Paredes, Máté Heisz, Raffaele Rossi, Michael Schmela, SolarPower Europe.

External co-authors: China Photovoltaic Industry Association (CPIA); Dan Whitten, US Solar Energy Industries Association (SEIA); Subrahmanyam Pulipaka & Pranav R.
Mehta, National Solar Energy Federation of India (NSEFI); Takeaki Masukawa & Hishashi Suzuki, Japan Photovoltaic Energy Association (JPEA); Steve Blume, Smart Energy
Council; Virdiana Vázquez Guerrero, Mexican Solar Energy Association (ASOLMEX); Chang Sik Son & Eun-Chel Cho, Korea Photovoltaic Society (KPVS); Esen Erkan, Günder
Turkish Solar Energy Society (GÜNDER); Jaap Baarsma, Holland Solar; Rodrigo Lopes Sauaia & Stephanie Betz, Brazilian Photovoltaic Solar Energy Association (ABSOLAR).

External contributors: ACESOL, AEA, ALER, APESF, APREN, BPVA, BSW-Solar, CADER, EDAMA, EDORA, Elettricità Futura, EMPOWER Kosovo, ENERPLAN, European
Energy, GIZ, Green Energy Association of Israel, HELAPCO, Institut Luxembourgeois de Régulation, IRENA, ISEA, Lithuanian Solar Energy Association, MANAP, MEEREA,
MESIA, Photovoltaic Austria, PV POLAND, Solar Trade Association, Solární Asociace, Solenergiklyngen, SPAQ, Svensk Solenergi, Swissolar, TPVIA, UNEF.

Design: Onehemisphere, Sweden.
Supported by: Intersolar Europe, Global Solar Council (GSC).

Disclaimer: Please note that all historical figures provided in this brochure are valid at the time of publication and will be revised when new and proven figures are
available. All forecast figures are based on SolarPower Europe knowledge at the time of publication. Please also note that forecast figures have been rounded.

SolarPower Europe’s five-year forecast consists of Low, Medium and High Scenarios. The Medium scenario anticipates the most likely development given the current state
of play of the market. The Low Scenario forecast is based on the assumption that policymakers halt solar support and other issues arise, including interest rate hikes and
severe financial crisis situations. Conversely, the High Scenario forecasts the best optimal case in which policy support, financial conditions and other factors are enhanced.

Segmentation is based on the following system size: Residential (
EXECUTIVE SUMMARY

2018 will be remembered as the                On the plus side, solar’s power generation cost (LCOE) decreased by around
year solar broke the 100 GW                   14% year-on-year in 2018, according to Lazard Capital, now enabling power
threshold of annual installations,            prices in the 2 US cents per kWh range in many sunny places around the world.
and it will be recalled as the year
                                              Low generation cost alone is not enough to facilitate growth; it also needs the
solar in total reached a cumulative
                                              right policy frameworks and energy market designs. The administration in
operational capacity of over 500
                                              China, the world’s largest solar market for years now, has pulled the break for
GW or 0.5 TW.
                                              its generous feed-in tariff incentive scheme in mid-2018 to make itself fit for the
2018 will also likely go down in              grid parity age, looking into tools to better steer growth and have generation
history as the year solar took a              closer to where demand is. At 44.4 GW, China’s market shrunk by 16%
short ‘break’ for the next growth             compared to its record 52.8 GW in 2017. While other leading solar markets also
phase. A total of 102.4 GW went on            stagnated (US) or shrank (India, Japan) for various reasons, many new and
the grid around the world last year.          emerging markets more than compensated for the weakness of the tier 1
That’s still 4% more than the 98.5            group. In 2018, 11 countries installed more than 1 GW of solar; that’s two more
GW installed in 2017 but compares             compared to the nine GW-scale solar markets in 2017. Our Medium Scenario
to two years with very high growth            estimates that the number will significantly increase to 16 countries in 2019.
rates – around 30% in 2017 and 50%
                                              Europe is one of the new solar growth regions. Driven by the European
in 2016.
                                              Union’s binding national 2020 targets, the continent added 11.3 GW in 2018,
Despite its rather low, one-digit year-       a 21% rise over the 9.3 GW installed the year before. This year, our Medium
on-year growth, solar was again the           Scenario sees demand surge by over 80% to 20.4 GW, and for 2020, we see
power generation technology with              18% growth to 24.1 GW, which would be a new installation record, beating
the largest capacity additions                the 22.5 GW Europe added in 2011.
globally in 2018. More solar was
                                              While several emerging markets showed impressive growth in 2018, Australia
deployed than for any other single
                                              was probably the solar shooting star of the last year. The country and
technology. In fact, solar additions
                                              continent accelerated its stellar growth pace in 2018, adding 5.3 GW, up nearly
were more than twice as high as net
                                              300% from 1.3 GW in 2017 – and this high demand is supposed to continue.
additions for coal and also for wind.
Like the year before, solar alone             In our Medium Scenario we anticipate around 128 GW newly installed PV
installed more capacity than all fossil       capacity in 2019, which would translate into a 25% market growth over the
fuels and nuclear together in 2018,           2018 additions. Next to many other markets, we are more upbeat on solar in
although the lead was paper-thin,             the world’s largest solar market China in 2019 than in last year’s GMO,
less than 1%. While solar’s capacity          anticipating a newly installed capacity of 43 GW. That’s because the Chinese
additions seem impressive in relation         administration seems to be getting their restructuring act together faster than
to its fossil fuel peers, the truth is that   anticipated. Also, for the following four years we are upbeat on global solar.
solar still has a very long way to go to      Our Medium Scenario anticipates demand to rise by 12% to 144 GW in 2020,
tap its vast potential – its share in the     10% to 158 GW in 2021, 7% to 169 GW in 2022, and 6% to 180 GW in 2023.
global power output for 2018 was a
                                              Like in previous years, the scenarios of the Global Market Outlook 2019 show
very small 2%.
                                              higher growth than in last year’s edition of the GMO. In 2019, we estimate a
                                              cumulative installed capacity of 645 GW for the Medium Scenario 2019, which is
                                              about 4% higher than in last year’s GMO. Our new 5-year global market outlook
                                              anticipates for our most likely Medium Scenario, that global solar power
                                              generation plant capacities will reach 1,297 GW in 2023. Under optimal conditions,
                                              we estimate that the world could get as high as 1,610 GW by the end of 2023 and
                                              enter the terawatt production capacity level already in 2021. However, the year
                                              that will be more likely remembered for entering the solar terawatt age is 2022,
                                              which would translate into around 4% of global electricity production.
                                              The report and all figures can be downloaded at:
                                              www.solarpowereurope.org

                                                             SolarPower Europe / GLOBAL MARKET OUTLOOK FOR SOLAR POWER 2019-2023/ 5
1
GLOBAL SOLAR MARKET
UPDATE 2000 - 2018
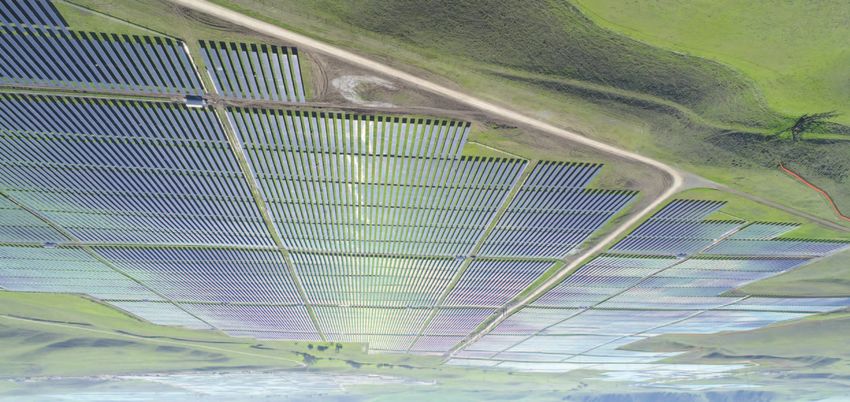
© First Solar
In 2018, solar took a little break Relatively, solar’s share reached 36% of all newly added power capacities
from the enormous growth rates in 2018, compared to 38% the year before. While impressive at first sight,
seen in previous years. Although the ‘stagnation’ in both solar and wind growth in 2018 meant that
the solar market grew modestly by renewable capacities only contributed 63% to total power additions (see
only 4%, it was enough to again Fig. 2). When looking at the share of total installed power generation
outdo any other power generation capacities, renewables contributed 33% in 2018, and 26% in terms of power
technology last year. More solar PV output. All solar PV power plants together produced only 2.2% of the world’s
was deployed than all fossil fuels electricity output. This shows that despite solar’s recent dominating role in
and nuclear together. Solar also annual power generation additions, there’s huge untapped potential for
added more capacity than all both solar and its renewable peers.
renewables combined—including
large hydro—and had twice as
much installed than wind power
FIGURE 1 NET POWER GENERATING CAPACITY ADDED IN 2018
(see Fig. 1).
BY MAIN TECHNOLOGY
2018
Other Res; 7 GW
Large Hydro; 21 GW Solar; 102 GW
Nuclear; 5 GW
Gas; 46 GW
Coal; 50 GW
Wind; 49 GW
Source: Global Energy Monitor (2019); IRENA (2019); SolarPower Europe (2019). © SOLARPOWER EUROPE 2019
SolarPower Europe / GLOBAL MARKET OUTLOOK FOR SOLAR POWER 2019-2023 / 7
1 GLOBAL SOLAR MARKET
           UPDATE 2000 - 2018                                        / CONTINUED

FIGURE 2 RENEWABLE POWER GENERATION AND CAPACITY AS A SHARE OF GLOBAL POWER 2008-2018

           70

                                                                                                                                    62%    63%
                                                                                                             60%
           60
                                                                              53%       54%                                57%

           50
                                                                                                  49%

                             39%                 39%               44%
           40
                                                        38%
%

                                                                                                                                    32%    33%
           30                                                                                                              31%
                                                                                                             30%
                                                                                        27%       28%
                                                                              26%                                                          26%
                                                        24%        25%                                                              25%
                             23%                 24%                                                         23%           24%
           20                                                                           22%       22%
                                                                              21%
                             18%                 19%    19%        20%

           10

                                                                                                                           1.3%     1.8%   2.2%
                                                 0.1%   0.2%       0.3%       0.4%      0.6%      0.8%       1.0%
                            0.1%
             0
                            2008                 2009   2010       2011       2012     2013       2014       2015          2016     2017   2018

                                                                 Renewable capacity change as a % of global capacity change (net)

                                                                 Renewable power as a % of global capacity

                                                                 Renewable power as a % of global power generation

                                                                 Solar power as a % of global power generation
Source: IRENA (2019).                                                                                                                        © SOLARPOWER EUROPE 2019

The reason for a preference for solar over other                                            but usually also below gas, and in the range of wind,
technologies has been, among other reasons, its steep                                       depending on the region, even lower. In 2018, tenders
cost reduction curve – which is continuing to decrease                                      and PPAs showed several instances of bids, awards and
(see Fig. 3). Today, generation costs for solar power are                                   contracts with solar power prices in the 2 US cents/kWh
significantly lower than for new nuclear and coal plants,                                   range. Such price levels were reached in various

FIGURE 3 SOLAR ELECTRICITY GENERATION COST IN COMPARISON WITH OTHER POWER SOURCES 2009-2018

          350

          300

          250
USD/MWh

          200

          150

          100

           50

             0
                            2009                 2010   2011       2012       2013     2014       2015       2016          2017     2018

                                                         Solar         Wind          CCGT        Coal            Nuclear
Source: Lazard (2018). All prices In 2019 USD.                                                                                               © SOLARPOWER EUROPE 2019

8 / SolarPower Europe / GLOBAL MARKET OUTLOOK FOR SOLAR POWER 2019-2023
geographies around the world (see Fig. 4). The lowest                                               technology improvements, which continue to (see
solar power price bid in 2018 was recorded at 1.38 INR                                              overview Technology Trends, p.49)
(1.86 US cents) per kWh in India; although this was an
                                                                                                    The latest Levelized Cost of Energy (LCOE) Analysis –
escalating tariff with a special business model for
                                                                                                    Version 12.0, released in November 2018 by US
government rooftop buildings.
                                                                                                    investment bank Lazard, shows utility-scale solar’s cost
In general, prices for solar power are much higher in                                               improving over the previous version by 14%. Utility-
developing countries than in economies with stable                                                  scale solar is again cheaper than new conventional
policy conditions and high credit ratings. But with                                                 power generation sources nuclear and coal, as well as
support from international lenders, such as                                                         combined cycle gas turbines (CCGT) (see Fig. 5).
development financing institutions, project risks can be
                                                                                                    A total of 102.4 GW solar was installed in 2018 (see Fig. 6),
considerably reduced in developing countries. In Egypt,
                                                                                                    exceeding the 100 GW level in one year for the first time.
for example, in 2018, a 200 MW solar tender from the
                                                                                                    While that’s only a 4% year-on-year growth over the
Egyptian Electricity Transmission Company received the
                                                                                                    98.5 GW installed in 2017, it is once again higher than
best offers from international developers in the 2 US
                                                                                                    many solar analysts had anticipated. After the world’s
cent range – at 2.8 US cents per kWh. This solar project
                                                                                                    largest solar market, China, had stopped its utility-scale
is backed by the European Bank for Reconstruction and
                                                                                                    solar subsidy programme in May 2018, many analysts
Development (EBRD). The Scaling Solar Programme of
                                                                                                    dramatically reduced their forecasts, with Goldman Sachs
the World Bank Group, which is probably the largest
                                                                                                    being the most conservative, anticipating solar demand
solar scheme of this kind, is supporting solar
                                                                                                    to drop by 24% to 75 GW in 2018. We did not change our
deployment in African countries, Ethiopia, Madagascar,
                                                                                                    GMO 2018 Medium Scenario over the course of last year,
Senegal and Zambia, and in its latest tenders, has led
                                                                                                    keeping our market growth estimate at 4% to 102.6 GW.
to awards in the low 4 US cent/kWh range. In April 2019,
                                                                                                    The actual 102.4 GW installation figure deviates only
Zambia’s GET FIT programme between the country’s
                                                                                                    200 MW or less than 1% from our original estimate, and
energy ministry and the German Development Bank
                                                                                                    it’s the first time in years that we have not underestimated
(KfW) awarded 120 MW of solar capacity at a price of
                                                                                                    the growth of the solar sector; in the past, actual installed
3.99 US cents/kWh: a new record for Sub-Saharan Africa.
                                                                                                    capacities usually turned out be closer to the upper end
While low-cost financing is key for developers to opt for                                           of our GMO High Scenario estimate.
solar, another important part of the cost equation are

FIGURE 4 SELECTION OF LOWEST SOLAR AUCTION BIDS AROUND THE WORLD IN 2018

               4
                            3.52                                                   3.55

               3                               2.79
                                                                                                                                   2.49                        2.50
                                                                                                2.34        2.40                               2.38
US cents/kWh

                                                                                                                       2.16

               2                                                 1.86

               1

               0
                           Brazil1            Egypt             India             India      Saudi Arabia   UAE      Arizona,    Arizona,   Nevada,          Texas,
                                                                                                                       US*2        US*        US*             US*

*: PPA with Production Tax Credit, 1: Average winning bid, 2: With 2.5% annual escalation.                                                            © SOLARPOWER EUROPE 2019

                                                                                             SolarPower Europe / GLOBAL MARKET OUTLOOK FOR SOLAR POWER 2019-2023 / 9
1 GLOBAL SOLAR MARKET
                  UPDATE 2000 - 2018                    / CONTINUED

FIGURE 5 SOLAR ELECTRICITY GENERATION COST IN COMPARISON WITH CONVENTIONAL POWER SOURCES 2018

                 300

                 250

                 200
LCOE (USD/MWh)

                 150

                 100

                  50

                   0
                         Residential PV        C&I PV       Utility-scale PV          CCGT           Coal         Nuclear

Source: Lazard (2018).                                                                                            © SOLARPOWER EUROPE 2019

                 More than

                            100 GW                       installed in 2018

FIGURE 6 EVOLUTION OF GLOBAL ANNUAL SOLAR PV INSTALLED CAPACITY 2000-2018

                 120

                                                                                                                  102.4
                 100

                  80
GW

                  60

                  40

                  20

                   0
                       2000 2001 2002 2003 2004 2005 2006 2007 2008 2009 2010 2011 2012 2013 2014 2015 2016 2017 2018

                                      EUROPE            AMERICA                APAC          CHINA          MEA

                                                                                                                  © SOLARPOWER EUROPE 2019

10 / SolarPower Europe / GLOBAL MARKET OUTLOOK FOR SOLAR POWER 2019-2023
Top 5 global solar markets 2018 of more utility-scale plants, a hard cap for distributed
generation systems, that was already met at the time, and
Although annual solar demand in China declined for the
another round of FIT cuts. As high-tech & low cost remain
first time since 2014, it continued to dominate the solar
key to China’s New Energy Administration (NEA), the Top
world in 2018 (see Fig. 7). China installed 44.4 GW: a year-
Runner Programme continued untouched, as well as the
on-year decrease of 16% from the record additions of
Poverty Alleviation Programme.
52.8 GW and 53% growth in 2017, and installations of 34.5
GW in 2016 (128% growth). Still, this means China added The United States’ solar market remained stable at 10.6
over four times more solar than the second largest market GW. That made the country the world’s second largest
in the world, and more than the remaining top 10 solar market again in 2018. We had anticipated a slight
combined. The sudden solar restructuring programme decline in our GMO 2018 estimate (down to 10.1 GW)
announcement of China’s administration on the 31st of due to impacts on system pricing from import tariffs and
May 2018 (thus tagged ‘531’) caught the sector by surprise, the impacts of a corporate tax reform. However, utility
but was actually overdue. After a record 9.7 GW had been scales solar continued to dominate US solar, being
installed in the first 3 months of 2018, it was apparent that responsible for over half of new installations in 2018.
the country was on course for another record year,
We had assumed India would move up to second place
although it was already struggling with high curtailment
in 2018 after it secured rank 3 in 2017. But that did not
rates and heavy delays from payments of its feed-in tariff
materialise. After installing only 8.3 GW, down 16% from
rates to solar power plant operators. With price offerings
9.6 GW in 2017, India maintained third place. There were
significantly lower in its Top Runner high-efficiency
multiple reasons for the market contraction – a new
module auction programme than its regular feed-in tariff,
goods and services tax, a lengthy discussion on
the Chinese administration had proof that it was time for
safeguard duties, and implementation of other
a change from its uncapped, very attractive FIT scheme
protective measures, including attempts to combine
that had often been higher than in many other regions of
multi-gigawatt power plant tenders with creation of
the world. China’s measures to stop uncontrolled growth
local integrated module manufacturing facilities, and to
immediately after the 31st of May included full termination
top it off, issues with missing transmission lines.
FIGURE 7 GLOBAL TOP 10 SOLAR PV MARKETS IN 2018
60
52.8
50
44.4
40
GW
30
20
10.6 10.6 9.6
10 8.3 7.2
6.6
5.3
2.9 2.8 2.0 2.6
1.3 1.8 1.1 1.6 1.5 0.8
0.3
0
China USA India Japan Australia Germany Mexico South Korea Turkey Netherlands
2018 2017
© SOLARPOWER EUROPE 2019
SolarPower Europe / GLOBAL MARKET OUTLOOK FOR SOLAR POWER 2019-2023 / 111 GLOBAL SOLAR MARKET
UPDATE 2000 - 2018 / CONTINUED
Again, Japan installed less than the year before, adding hand, showed significant strength after stagnation in
6.6 GW in 2018, down 8% from the 7.2 GW installed in 2017. It connected 8.2 GW to the grid; a 37% growth rate
the previous year. According to the Japan Photovoltaic over the 6 GW installed in 2017. Last year, 22 of the 28
Energy Association (JPEA) this was due to further FIT EU markets showed higher installation numbers than
reductions for non-residential systems and grid the year before. Two added over 1 GW (Germany,
constraints, leading to the first curtailment of solar in Netherlands), and Germany became the EU’s and
the Kyushu area on the mainland in October 2018, Europe’s largest solar market again after connecting
which has expanded to other regions as well. Japan’s 2.9 GW to the grid, up 67% from 1.8 GW in 2017.
solar market is struggling in its transition phase from its
The PV market in Asia-Pacific shrank by 4% to 71.4 GW
FIT scheme to auctions and self-consumption. There is
in 2018. Asia’s top three – China, India and Japan – all
still a large project pipeline waiting for installation, while
disappointed. However, positive news came from Korea,
the first three solar tenders with around 1.15 GW of total
which exceeded the 2 GW level for the first time. The
capacity were all undersubscribed and resulted only in
main driver is the Korean Renewable Portfolio
a little over 500 MW and a lowest bid of 14.25 JPY (12.85
Standards scheme, which was launched to replace the
US cents) per kWh, which is considerable higher than in
feed-in tariff and requires utility companies exceeding
auctions of other countries. JPEA anticipates the
500 MW generation capacity to supply 6% and 10% of
country’s solar downturn to continue and bottom at
their electricity from new and renewable power sources
4 GW in 2024, before electricity market restructuring will
by 2019 and 2024. Solar in Taiwan also grew
be accomplished, enabling the next growth phase.
significantly—by 86% year-on-year—but fell a few
The world’s fifth largest market in 2018 was Australia. megawatts short of reaching the GW level. Taiwan
The country and continent accelerated its stellar growth installed 971 MW in 2018, up from 523 MW in 2017, which
pace in 2018, adding 5.3 GW, up 295% from 1.3 GW in led to a total of 2.7 GW. Taiwan’s solar market is fuelled
2017, when it first turned into a gigawatt-scale market. by a feed-in tariff as the country strives to have 20 GW
While the solar base of Australia remained roof-top of solar power capacity installed by 2025.
systems, adding over 1.8 GW to cover now more than
Latin America has a new solar star: Mexico. The Central
nearly 22%, or every fifth house, the key to the new
American country not only installed over 1 GW for the first
growth dimension is utility-scale systems with additions
time, but it almost reached the 3 GW level, adding 2.8 GW
of 3.5 GW in 2018, up from less than 100 MW the previous
in 2018. This is nearly a factor 10 from 285 MW added in
year, and a multi-gigawatt development pipeline that is
2017 and catapults Mexico to the number one spot in
incentivised primarily though the national Renewable
Latin America and seventh place in the top 10. The
Energy Target (RET), a carbon price certificate model
reasons for this strong growth can be found mainly in the
mechanism that ends in 2020.
government’s three renewable energy auctions held in
2016 and 2017, and to a minor extent in a boom of
Regional update 2018 distributed solar with currently more than 100,000 solar
roofs on homes, industrial and commercial buildings.
The next growth phase seems to be taking place now
both in Europe as a whole and the European Union. As the year before, Brazil exceeded the 1 GW level in
While Europe added 11.3 GW in 2018, a 21% increase 2018, adding around 1.2 GW; a growth rate of 13%. While
compared to the 9.3 GW installed the year before, this is around two-thirds of this share was utility-scale
a somewhat slower growth rate than in 2017 (30% YoY). installations stemming from tenders, nearly one-third
The reason: solar activities in Turkey—which is was distributed solar capacity incentivised through a
traditionally included in Europe in the GMO and was the national net-metering programme. Next to the two GW-
continent’s largest market in 2017—slowed dramatically scale markets Mexico and Brazil, there is some sort of
due to the country’s financial crisis and missing political solar activity in several Latin America’s countries,
support. Turkey added 1.6 GW in 2018, down from including a few more established PV markets, like Chile
2.6 GW the year before. A bright European solar spot and Argentina, and more nascent solar markets, like
outside the EU was Ukraine, where demand more than Colombia and Peru. As managing the significant upfront
tripled to 803 MW, thanks to a highly attractive feed-in cost for solar power plants is often a challenge for local
tariff. The European Union’s solar market, on the other developers in Latin America (as well as many other
12 / SolarPower Europe / GLOBAL MARKET OUTLOOK FOR SOLAR POWER 2019-2023emerging markets), a number of companies have the launch of a 1.8 GW tender in the fifth round of its
recently issued green bonds to support their solar Renewable Energy Independent Power Producers
development plans. Procurement Programme (REIPPPP) in November, but
that has yet to happen.
The Middle East is mostly known in solar for its tenders
that have led to several record-breaking low solar tariffs 2018 saw progress in the several stage tender processes
on the Arabian Peninsula. Although new tenders took for utility-scale solar power plants in Ethiopia,
place and were awarded in Kuwait, Oman, the United Madagascar, Senegal and Zambia; countries that are
Arab Emirates and Saudi Arabia in 2018, in terms of grid- part of the World Bank Group’s Scaling Solar
connections of finalised utility-scale PV power plants, Programme. A total of over 700 MW has been awarded
there was only little news, as most of this had still been from 2017/2018 Scaling Solar tenders in these four
in the installation phase. The UAE was the largest countries. In addition, Ethiopia issued a 500 MW tender
market on the Arabian Peninsula with around 239 MW. in April 2019, the largest in this programme so far.
Other notable markets in the Middle East region, also However, no new installations from Scaling Solar were
growing mainly through tenders, were Israel, which recorded in Africa in 2018; the 54 MW project in Zambia
nearly quadrupled volumes to 383 MW, and Jordan, from the 2017 tender, which is the country’s first, large
which added 455 MW, up from 185 MW the year before. utility-scale PV plant, went online in March 2019.
Africa has been seeing a number of countries entering In summary, in 2018, a number of leading solar markets
the on-grid solar segment as of recently. There were struggled on their growth path as they have been
announcements in countries including Angola, Chad, working on transitioning away from traditional feed-in
Morocco, Mozambique, Tunisia, and Senegal about new tariff incentive schemes, in particular China and Japan.
projects last year. But, when it comes to notable grid- In India, protectionism and other challenges distracted
connected capacities in 2018, these took place only in the market from focussing on meeting its ambitious
a few African countries. The largest market was located targets. While all this has resulted in very little growth
for the first time in the northern part of the continent— last year, the low cost of solar has continued to attract
Egypt with 581 MW. Almost the entire 2018 PV capacity many new countries and emerging markets to start
of Egypt was installed at the Benban Solar Park, which looking even more seriously into this unique, flexible
will have around 1.8 GW once fully completed in 2019. and distributed clean power technology.
South Africa was back on the solar map last year, adding
In 2018, 11 countries installed over 1 GW, compared to
373 MW, up from 172 MW in 2017. Its new government
nine in 2017, and seven in 2016. Details on the leading
succeeded in getting its national utility Eskom to finally
solar markets can be found in Chapter 2, which provides
sign long-delayed PPAs for renewable energy projects
overviews on those 11 countries that installed more
worth 2.3 GW last year. In June 2018, it also announced
than 1 GW of solar in 2018 (see p.53).
SolarPower Europe / GLOBAL MARKET OUTLOOK FOR SOLAR POWER 2019-2023 / 131 GLOBAL SOLAR MARKET
UPDATE 2000 - 2018 / CONTINUED
The 2018 solar market not only exceeded the 100 GW
level for the first time: as the year passed, it was also the
first time the world had more than 0.5 TW of solar power
Half a Terawatt
capacity up and running. One year earlier, at the end of
2017, total global solar power capacity reached over 400
Solar capacity installed
GW, after it surpassed the 300 GW level in 2016 and the globally today
200 GW mark in 2015.
Total installed PV power capacity grew by 25% to 509.3
GW by the end of 2018, up from 407 GW in 2017 (Fig. 8). maintained its second position based on a cumulative
Since the beginning of the century, when the grid- PV capacity of 125.8 GW. The Americas was again the
connected solar era began with the launch of Germany’s world’s third largest solar region in 2018 – with a
feed-in tariff scheme, total solar power has grown by cumulative installed capacity of 78.2 GW and a 15%
nearly 320 times. When looking back just a decade, the stake. Increasing activity in the Middle East and Africa
world’s cumulative PV capacity increased by over (MEA) changed the region’s solar development path last
3,200% – from 15.8 GW in 2008. year. With a total solar capacity of 9.6 GW, it’s world
market share grew slightly in 2018, moving up to 1.9%,
Although growth in the top 3 Asian markets slowed, the from 1.7% the year before.
Asia-Pacific region further expanded its solar leadership
in 2018, again representing more than half of the global A look at individual countries clearly shows that China’s
power generation capacities (see Fig. 9; note that due market contraction in 2018 has not at all affected its solar
to its large size, China is listed separately from the Asia- dominance. Its operational solar power generation
Pacific region). Additions of 71.3 GW in 2018 resulted in capacity reached 34.4%; this is 2% points higher than in
295.7 GW of total installed capacity, equal to a 58% 2017, when China’s share was at 32.3% and already close
global market share – a 3% points year-on-year growth. to presenting one-third of global power generation
The new growth phase of European solar pioneers capacities, which it now surpassed (see Fig. 10). Like in
couldn’t stop the continent from losing market share, the previous years, China was followed by the United
which dropped by 3% points to 25%. Still, Europe States, Japan and Germany. All three lost market shares
FIGURE 8 GLOBAL TOTAL SOLAR PV INSTALLED CAPACITY 2000-2018
600
509.3
500
400
GW
300
200
100
0
2000 2001 2002 2003 2004 2005 2006 2007 2008 2009 2010 2011 2012 2013 2014 2015 2016 2017 2018
EUROPE AMERICA APAC CHINA MEA
© SOLARPOWER EUROPE 2019
14 / SolarPower Europe / GLOBAL MARKET OUTLOOK FOR SOLAR POWER 2019-2023in 2018, with Germany now down to single-digits. The US’ All other solar markets significantly trail behind the top
cumulative installed PV capacity reached 62.1 GW, equal 5. In that group, there are only two notable changes to
to a global share of 12.2%; Japan’s 55.9 GW resulted in a report: following Italy at 19.9 GW and UK at 13 GW,
11.0% share, and Germany’s 45.9 GW meant a 9.0% share, Australia now turned into a +10 GW solar power
down from 10.6% in 2017. While India didn’t have a good generation capacity market on grounds of its massive
solar year in 2018, its market decline is not reflected in the growth streak that led to a total installed capacity of 12.6
total global power rankings – its 27.3 GW of total installed GW by the end of 2018. Moreover, South Korea, after
solar capacity was enough to stay ranked in fifth place reaching a total solar capacity of 7.7 GW, replaced Spain
and increase its share to 5.4%, from 4.7% in 2017. in this top 10 list.
FIGURE 9 GLOBAL TOTAL SOLAR PV INSTALLED CAPACITY SHARES 2012-2018
100
90
80
70
60
50
%
40
30
20
10
0
2012 2013 2014 2015 2016 2017 2018
EUROPE AMERICA APAC CHINA MEA
© SOLARPOWER EUROPE 2019
FIGURE 10 GLOBAL TOP 10 SOLAR PV MARKETS TOTAL INSTALLED SHARES BY END OF 2018
Rest of World; 16%
China; 34%
France; 2%
United Kingdom; 3%
Italy; 4%
Germany; 9%
USA; 12% Japan; 11%
South Korea; 2% India; 5%
Australia; 2%
© SOLARPOWER EUROPE 2019
SolarPower Europe / GLOBAL MARKET OUTLOOK FOR SOLAR POWER 2019-2023 / 1516 / SolarPower Europe / GLOBAL MARKET OUTLOOK FOR SOLAR POWER 2019-2023
1 GLOBAL SOLAR MARKET
      PROSPECTS 2019 – 2023

In Q1/2019, most solar analysts became more upbeat                           Forecast 2019
about the solar market this year, expecting two-digit
                                                                             In our Medium Scenario we anticipate around 128.4 GW
growth figures, although estimates for the annual volume
                                                                             of newly installed PV capacity in 2019, which would
were difficult because the outlook for China was not
                                                                             translate into a 25% market growth over the 102.4 GW
completely clear at that point. China’s National Energy
                                                                             added in 2018 (see Fig. 11). Our Low Scenario, which
Administration had still not published its new solar
                                                                             models major markets to cut their solar support,
support scheme to replace the feed-in tariff programme
                                                                             estimates a strong demand drop to 84.5 GW. Obviously,
for utility-scale projects that had been abruptly shelved in
                                                                             this outcome is highly unlikely, when taking into account
May 2018. However, after several months of silence
                                                                             solar activities around the globe in the first months of the
following the restructuring announcement, an internal
                                                                             year. Our High Scenario forecasts up to 165.4 GW of solar
NEA conference in November 2018 provided signals that
                                                                             additions in 2018, which sounds extremely optimistic and
subsidies will continue until grid-parity is reached, though
                                                                             is also very improbable, but solar has rather often
at lower levels and mainly distributed through auction
                                                                             surprised everyone positively in the past. A lot will depend
mechanisms. Meanwhile, a policy framework for ‘subsidy-
                                                                             on when and how strong the world’s largest market,
free’ projects should be established. Over time, more and
                                                                             China, will come back in the second half of the year.
more details about the plans became known publicly,
including a 3 billion RMB (440 million USD) budget per
year. While the news in January/February led some                            Top 3 global solar markets 2019
analysts to believe demand could return to the record
                                                                             However, we are more upbeat about solar in China in
heights of 2017, much of this enthusiasm had
                                                                             2019 than in last year’s GMO, anticipating newly
disappeared, when, in early April, solar stakeholders were
                                                                             installed capacity of 43 GW. That’s because the Chinese
still waiting for the new solar incentive programme to be
                                                                             administration seems to be getting their restructuring
finally implemented. While end of April, China’s National
                                                                             act together faster than anticipated. Moreover, both
Development and Reform Commission released its ‘2019
                                                                             China’s Top Runner Programme and Poverty Alleviation
On-grid FIT Price Guidance’, which has provided fixed FITs
                                                                             Programme have continued untouched.
for the Poverty Alleviation Programme and rooftop
projects as well as upper price caps for auctions, the final                 Next to China, we expect two other markets to add over
new management regulation was still missing at that time.                    10 GW each this year. One will be India, which we expect

FIGURE 11 WORLD ANNUAL SOLAR PV MARKET SCENARIOS 2019-2023

     300

                                                                                          263.9
     250

     200
                                                                                         6%
                                                       165.4                     7%
                                                                       10%
GW

     150                                                      12%
                                                     25%
                                                                                         125.6
                                             102.4
     100                                              84.5

      50

       0
             2014    2015      2016   2017   2018      2019     2020      2021    2022    2023

             Historical data          Low Scenario            High Scenario           Medium Scenario

                                                                                                                            © SOLARPOWER EUROPE 2019

                                                                    SolarPower Europe / GLOBAL MARKET OUTLOOK FOR SOLAR POWER 2019-2023 / 17
1 GLOBAL SOLAR MARKET
PROSPECTS 2019 – 2023 / CONTINUED
to become the second largest market this year, and the Worldwide, we see the number of solar GW-level
US, which will rank third. markets increasing to 16 in 2019, according to our
Medium Scenario; that’s five more than the 11 GW-scale
After India missed its official fiscal year 2018-19 solar target
markets in 2018. In fact, we had assumed that already
by 59%, as it connected merely 6.5 GW of the planned 11
in 2018, the number of GW markets would reach 14, but
GW to the grid between April 2018 and March 2019, mostly
for various reasons these countries will reach that level
due to tax, import duty and organisation issues, there is big
now in 2019 (for details, see Chapter 2).
motivation to catch up and return to growth. At the end of
the calendar year 2018, India had a total installed capacity
of 25.2 GW, which leaves nearly 75 GW to go to meet the Global solar market developments 2020 to 2023
100 GW target of the National Solar Mission by 2022.
Solar’s attractive value proposition will lead to 2-digit
However, there were high tender activities in 2018, after
growth rates globally, not only this year but also in the
India’s Ministry of New and Renewable Energy (MNRE) had
next two years, and maybe beyond. After two to three
published a roadmap to tender 20 GW in FY 2017/18 and
transitional years, backed by different incentive
30 GW each in FY 2018/19 and FY 2019/20. According to the
schemes, we anticipate a fully restructured Chinese
National Solar Energy Federation of India (NSEFI), the
solar market that will absorb capacities above 50 GW as
current project pipelines indicate that around 10.9 GW
early as 2021, a year earlier than we believed in last
alone will be realised through utility-scale plants in 2019.
year’s GMO. Why? Because from what is known, NEA’s
India’s government also recently approved a total of 1.7
new solar policy framework looks comprehensive and
billion USD in funding for phase 2 of its grid-connected
addresses the right issues to make solar fit for the next
rooftop solar programme to accelerate installations in this
growth phase. In our Medium Scenario, we estimate
segment, which has a target of 40 GW by 2022, but had only
Chinese solar demand will reach around 49 GW in 2020,
around 3.5 GW installed at the end of 2018. In our Medium
56 GW in 2021, 61 GW in 2022 and 64 GW in 2023, which
Scenario, we anticipate India to rise by 55% year-on-year
is in line with the High Scenario of the China
to 12.9 GW in 2019.
Photovoltaic Industry Association (CPIA) (see p.54).
Although the import tariffs on solar modules, which were
China’s return to growth in the coming years is needed
the main reason for market stagnation in the United
to fuel overall solar growth, but the rest of the world will
States last year, are still in effect, the country’s solar
continue to play a stronger role in the solar sector, which
growth story is anticipated to continue in 2019 and
was already shown in 2018, when demand slightly
beyond due to the decreasing cost of solar, the investment
surged, although several of the leading markets
tax credit, state requirements and incentives, strong public
decreased or stagnated.
support and quickly increasing interest from corporates
in renewable power sourcing. We estimate in our Medium The US Solar Industry Association believes, ‘lower costs
Scenario that the US, again mainly through utility-scale PV and strong public and bipartisan sentiment in favour of
installations, will add 11.8 GW, up 11% from 2018. clean energy will lead to solar generation capacity more
than doubling in the next five years’ in the United
In both Europe and the EU, we anticipate very strong
States. In our Medium Scenario for the US, we assume
growth for 2019. As the EU’s national binding 2020
two-digit growth until 2021, when the ITC expires and a
renewables targets are rapidly getting closer, and many
new record volume of 16 GW of solar will be added,
member states still have some way to go (according to
followed by two years of consolidation at the 14 GW
Eurostat, 17 of the EU-28 had not reached their targets by
level. The third solar leader, India must and will speed
end of 2017), low-cost and easily deployable solar is often
up to meet or get close to its ambitious 100 GW by 2022,
seen as a key means to meet the finishing line in time. In
resulting in constantly higher annual installation
non-EU Europe, the drivers are solar’s low cost and
volumes, which according to our Medium Scenario,
attractive incentive schemes. While the financial crisis
means a record 21 GW market in 2023. The European
unfolding last year in Turkey and missing political support
Union seems well prepared for the coming years when
will turn Europe’s number one solar market in 2018 back
it comes to solar – until 2020, because the majority of
to a size considerably below 1 GW this year, the Ukrainian
the EU’s 28 member states still have some way to go
market, propelled by its attractive feed-in tariff program,
meet their national binding renewables targets in 2020,
is expected to cross that threshold for the first time.
and increasingly opt for low-cost solar. Post-2020, the
18 / SolarPower Europe / GLOBAL MARKET OUTLOOK FOR SOLAR POWER 2019-2023final agreements for the ‘Clean Energy for All Europeans’ 1,041 GW of cumulative operating solar power in 2022.
Legislative Package, defining the EU’s energy policy until For this GMO 2019, we forecast between 918 and
2030, are overall very positive for solar power. The 1,346 GW, with 1,117 GW for the Medium Scenario in
Medium Scenario expects a 23% growth rate in 2020 in 2022 – that’s about 7% higher.
the EU-28, a slower year in 2021, and again stronger
Our new 5-year Global Market Outlook anticipates for
2-digit growth as of 2022.
our most likely Medium Scenario that global solar
Globally, our Medium Scenario anticipates demand to power generation plant capacities will reach 1,297 GW
rise by 12% to 144 GW in 2020, 10% to 158 GW in 2021, in 2023. Under optimal conditions, the world could get
7% to 169 GW in 2022, and 6% to 180 GW in 2023. as high as 1,610 GW by the end of 2023 and enter the
However, our High Scenario assumptions could come terawatt production capacity level already in 2021. The
true, resulting in an annual market size of up to 264 GW more likely scenario for entering the solar terawatt age
in 2023, if decision-makers in politics and business is 2022; only four years after the 0.5 TW level was
quickly act upon fully understanding that solar is not reached in 2018.
only often the lowest-cost solution today, but also the
In our Medium Scenario, we expect that total global
most versatile power generation technology; in
installed PV generation capacity will pass the
combination with storage, it is extremely flexible and
following milestones over the next 5 years: 600 GW in
with wind and other renewables it creates a 24/7 supply
2019, 900 GW in 2021 and 1.1 TW in 2022.
source. Energy market designs will be quickly adapted
accordingly to enable even faster solar growth.
Like in previous years, the scenarios of the Global
Market Outlook 2019 show higher growth than in last
year’s GMO edition. In 2019, we estimate a cumulative
installed capacity of 645 GW for the Medium Scenario
2019, which is about 4% higher than in last year’s GMO
Over 1 TW
(see Fig. 12). The final year 2022 of the 5-year forecast in Solar power by 2022
last year’s GMO 2018 ranged between 824 and 1,290 GW,
with the most likely Medium Scenario resulting in
FIGURE 12 WORLD TOTAL SOLAR PV MARKET SCENARIOS 2019-2023
1,800
1,610.0
1,600
1,400
16%
1,200
18% 1,043.6
1,000
20%
GW
800
692.6
27% 22%
600 509.3
593.9
400
200
0
2014 2015 2016 2017 2018 2019 2020 2021 2022 2023
Historical data Low Scenario High Scenario Medium Scenario
© SOLARPOWER EUROPE 2019
SolarPower Europe / GLOBAL MARKET OUTLOOK FOR SOLAR POWER 2019-2023 / 191 GLOBAL SOLAR MARKET
PROSPECTS 2019 – 2023 / CONTINUED
From today’s perspective, solar PV seems unstoppable; 12 months – and demand decreased by only 16% in
there is no alternative to this low-cost and versatile clean 2018 – disruptions in one of the major markets can send
power source that can be utilised for consumer, shock waves throughout the entire solar sector. While
distributed and utility-scale applications. Still, solar is far in this case the downstream sector and investors
from having a level playing field with optimal market profited as sudden module overcapacities led to
designs to really unleash its cost and technical advantages dramatic price drops, and price elasticity created more
over inflexible power plants. Many obstacles are still in demand, this incident has been hurting many in the
solar’s way – this includes fully functioning emissions upstream production sector, which is very much needed
trading schemes for fossil fuels or CO2 taxes that are to continue investing heavily in solar to enable further
usually missing; investments and operation of inflexible, strong growth. Our Low Scenario until 2023 takes these
centralised power generation technology are often still and other risks into consideration, including interest
being strongly over-subsidised, like any nuclear power rate hikes and severe financial crisis situations, like we
plant; while self-consumed solar power is often being are currently seeing in Turkey. Taking all such risks into
inappropriately highly taxed (although the new EU Market account, our Low Scenario assumes a very unlikely
Design legislation has given the right signals in this regard). development that results in an annual global market of
only 126 GW in 2023, which would mean the same level
Another big issue is solar’s dependency on very few
as expected for 2019, and a total operating solar power
markets: In 2018, China, was responsible for 43% of the
generation capacity of 1,044 GW at the end of 2023.
global demand; the three largest solar markets, China,
the US and India, covered 61%. As China’s feed-in tariff In hindsight, forecasting details about future solar installed
termination for large-scale solar has shown over the last capacities has always been a difficult task for any industry
FIGURE 13 EVOLUTION OF GLOBAL ANNUAL SOLAR PV MARKET SHARES FOR HIGH AND LOW SCENARIOS UNTIL 2023
300
250
200
GW
150
100
50
0
Historical High Low High Low High Low High Low High Low
2018 2019 2020 2021 2022 2023
EUROPE AMERICA APAC CHINA MEA
% 2018 2019 2019 2020 2020 2021 2021 2022 2022 2023 2023
Historical High Low High Low High Low High Low High Low
Europe 11.01 17.18 13.71 17.88 13.17 17.27 12.64 17.94 12.95 18.19 12.94
America 16.24 13.93 15.74 14.78 15.32 14.30 14.74 13.64 13.20 13.30 12.60
APAC 26.35 29.82 32.06 28.27 27.74 26.20 25.78 25.82 25.700 25.75 26.51
China 43.36 32.49 33.06 33.44 39.20 35.28 41.30 35.47 42.21 35.16 41.77
MEA 3.05 6.58 5.43 5.63 4.56 6.95 5.54 7.13 5.94 7.60 6.19
© SOLARPOWER EUROPE 2019
20 / SolarPower Europe / GLOBAL MARKET OUTLOOK FOR SOLAR POWER 2019-2023expert, however, it is very obvious that Asia will continue In the group of the 20 markets with the highest 5-year
to dominate global solar demand, and this will be installation potentials (in the order of Low Scenario
independent from the sector developing more towards assumptions; see Fig. 14) little has changed from last year.
our high or low scenarios (see Fig. 13). Again, we anticipate The top 3 are the same – China, India, the US. The
higher solar shares for Asia-Pacific in the future than in our anticipated installation volumes for both high and low
previous GMO. For 2018, the Asia-Pacific region is assumed scenarios over the next five years are again higher for
to absorb nearly 70% of total installations – and range most markets, with few exceptions like Japan.
between 60 and 68% until 2023. However, when looking Newcomers on this year’s top 20 list are Pakistan, Ukraine
at China alone, the country will continue to lose market and Portugal, while the biggest shooting stars are
shares from 54% in 2017, to 43% in 2018, and depending Australia (ranking fourth, up from sixth place), and the
on the scenario further down, hover mostly in the 30% Netherlands (ranking sixth, up from eleventh place). The
range between 2019 and 2023. pattern of the markets on this list also remains similar:
FIGURE 14 TOP 20 MARKETS' SOLAR PV ADDITIONS FOR HIGH AND LOW SCENARIOS 2019-2023
China 374.1
213.2
India 120.0
65.7
USA 89.4
48.4
Australia 45.7
19.0
Japan 34.8
17.6
Netherlands 24.6
11.3
Spain 26.6
11.3
South Korea 23.5
11.3
Germany 34.2
11.2
France 19.5
9.5
Mexico 21.8
8.8
Brazil 14.0
7.1
Taiwan 13.2
6.5
Italy 15.9
5.2
Saudi Arabia 14.4
4.6
High Scenario
Pakistan 9.4
3.7
Low Scenario
Turkey 7.3
3.4
Ukraine 10.6
3.3
Portugal 9.7
2.1
United Kingdom 4.0
1.1
0 50 100 150 200 250 300 350 400
GW
© SOLARPOWER EUROPE 2019
SolarPower Europe / GLOBAL MARKET OUTLOOK FOR SOLAR POWER 2019-2023 / 211 GLOBAL SOLAR MARKET
PROSPECTS 2019 – 2023 / CONTINUED
few countries will install the bulk of all solar system these are estimated to add 912 GW over the next five
capacity, though diversity is growing. This year, we expect years until 2023 in the High Scenario and 464 GW in the
for the High Scenarios again the same two countries to Low Scenario – that’s 183 GW and 114 GW more than in
install over 100 GW – China (374 GW) and India (120 GW) our 5-year assumptions of the GMO 2018.
– and 10 countries to add around 20 GW or more – China,
The top global PV markets’ prospects are looking very
India, the US, Japan, the Netherlands, Spain, South
good for the coming years and that is also true for solar
Korea, Germany and France (last year it was eight).
heavy weight China (see Fig. 15). Two-thirds of the top
When looking only at the world’s top 5 markets, we 20 markets are expected to install at least 10 GW each
anticipate them to absorb 664 GW altogether until 2023 between 2019 and 2023, according to our Medium
in the High Scenario and 364 GW in the Low Scenario, Scenario, with new capacity additions anticipated to
covering a share of around 61% and 68% of total differ from 273 GW for the first, China, to 4.4 GW for
additions in that period. If compared with the top 20, Egypt, the last on this list.
FIGURE 15 TOP GLOBAL SOLAR PV MARKETS’ PROSPECTS
2018 2023 2019 - 2023 2019 - 2023
Total Capacity Total Capacity Medium New Capacity Compound Annual Political support
(MW) Scenario by 2023 (MW) (MW) Growth Rate (%) prospects
China 175 131 448 131 273 000 21%
India 27 347 116 106 88 759 34%
United States 62 127 132 426 70 299 16%
Australia 12 560 45 236 32 676 29%
Germany 45 920 72 611 26 692 10%
Japan 55 851 82 351 26 500 8%
Spain 5 915 25 367 19 452 34%
South Korea 7 742 24 768 17 026 26%
Netherlands 4 181 20 059 15 878 37%
Mexico 3 580 19 010 15 430 40%
France 8 920 22 259 13 339 20%
Saudi Arabia 19 11 412 11 393 260%
Brazil 2 346 12 505 10 159 40%
Italy 19 877 29 498 9 621 8%
Taiwan 2 739 12 074 9 335 35%
Pakistan 1 720 8 381 6 660 37%
Ukraine 2 004 7 963 5 959 32%
Turkey 5 062 10 562 5 500 16%
United Arab Emirates 720 6 132 5 412 53%
Egypt 661 5 023 4 362 50%
22 / SolarPower Europe / GLOBAL MARKET OUTLOOK FOR SOLAR POWER 2019-2023Even though China had not not published the final course. An attractive investment tax credit (ITC), which
management guideline for the new solar policy was extended in 2015 and is eligible for residential and
framework at the editorial deadline of this report at the commercial systems that start construction by 2021,
end of April, it is certain that the world’s solar state incentives and obligations, as well as increasing
powerhouse will continue to heavily back solar. China corporate renewable power sourcing activities will
was the first country that fully understood the strategic result in 70 GW of new solar power additions, enough to
importance of owning the full production value chain keep the US in the top 3 over the next five years. The US
for its industry and its energy security, in addition to solar sector association SEIA is so upbeat about solar in
solar being the source of the lowest-cost and most the 2020s that it has tagged this period the ‘Solar
flexible clean power generation. Its solar programme Decade.’ Although we expect Japan to add 26.5 GW by
restructuring is an overdue transition effort from too 2023, this is not enough to keep last year’s rank in fourth
generous feed-in tariffs to more cost-efficient incentive place. Unlike for any other country on this list, annual
schemes. In our Medium Scenario, we anticipate China demand is likely to decrease constantly as the country
to add as much as the following six on this top 20 list continues to work on fixing its costly solar feed-in tariff
together until 2023, resulting in a total installed PV incentive scheme and infrastructure. On the other hand,
capacity of 448 GW. India is another solar market where solar shooting star Australia is supposed to install 6 GW
the government has identified solar as a key pillar for its more than Japan in the same period (although that
power supply strategy. Despite the recent growing pains outlook might change depending on the outcome of
resulting in a market contraction last year, India remains upcoming elections in mid-May). While Japan’s
on its growth path and is expected to be the second transformation process is known for years, and the
largest PV market over the next five years, with close to market still installs notable amounts of solar, even if
90 GW of newly installed capacity between 2019 and decreasing year by year, we rate the political support
2023. The US is one example where the head of prospects ‘cloudy.’ Our only ‘rainy’ forecast is for Turkey,
government, known to be a climate change sceptic and where the climate for solar changed completely due to
fossil fuel supporter, has not changed the country’s solar the financial crisis and dwindling political support.
SolarPower Europe / GLOBAL MARKET OUTLOOK FOR SOLAR POWER 2019-2023 / 23You can also read