Global warming and climate change - an experimental approach
←
→
Page content transcription
If your browser does not render page correctly, please read the page content below
Bernd Blume, bernd.blume@web.de
Klaus Morgenstern, klausjums@aol.com

  Global warming and climate change – an experimental approach

In the following twelve experiments, students carry out individual work in order to investigate
aspects of the scientific background to our climate and to climate change. Only qualitative
conclusions are drawn from the experimental results, and these are critically and carefully
applied to climate related issues.

The experiments can be carried out with or without giving any background climate
information. Higher level students may not need any. It is recommended to add a chapter
with scientific keywords in the instructions of the experiments, which will help students to
understand and explain the scientific background of the experimental results. Results and
comments contain additional information for teachers.

In this activity sheet you will find:
- five physics experiments to investigate how radiation determines temperature
- three biological experiments on metabolism (physiology)
- two chemical experiments on the carbon cycle
- one chemical-physiological experiment on combustion and metabolism.

These experiments are presented in the context of the following subject areas:
a.    Proving the greenhouse effect
b.    There is a natural source of atmospheric carbon dioxide, and therefore a natural
      greenhouse effect.
c.    Humans strengthen the natural greenhouse effect.
d.    Possible consequences of the natural greenhouse effect

The aim of the experiments is to acquire well-founded knowledge of the changing impact of
human actions on climate conditions.

Method of working
When carrying out the experiments, the pupils should be encouraged to:
  - ask questions
  - frame a hypothesis
  - look for information (from institutions, research institutes, libraries, internet and
      interviews)
  - design, prepare and carry out their own experiments,
  - put results together and evaluate them
  - explain the scientific background of results
  - illustrate the results of the research
  - communicate the results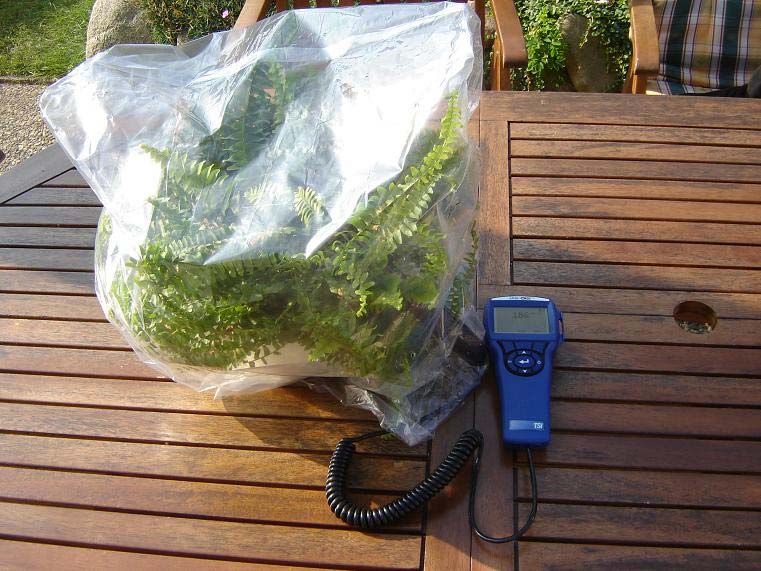
Experimental topics

                Radiation determines temperature (1)
Experiment 1
                Aim: to demonstrate how and why closed (unheated) spaces are basically heat
                traps.

                Radiation determines temperature (2)
Experiment 2
                Aim: to demonstrate how different colours absorb and emit light, and radiate heat
                with varying strengths

                Radiation determines temperature (3)
Experiment 3
                Aim: to demonstrate how CO2 gas absorbs heat rays more than normal "air":
                CO2- gas is "thermally darker" than normal air

                Radiation determines temperature (4)
Experiment 4
                Aim: to demonstrate how the absorption of heat rays by CO2 gas leads to a rise in
                the temperature of the CO2 -gas

                Radiation determines Temperature (5)
Experiment 5
                Aim: to demonstrate that a CO2 -layer closer to the earth is warmed up more than
                higher layers of atmosphere

                Combustion, metabolism and production of carbon dioxide
Experiment 6    Aims: to compare the quantity of CO2 that is released from a car when driven
                with that when it is pushed and to demonstrate how human activities increase
                CO2 in the atmosphere

                Metabolism and Carbon Dioxide (1)
Experiment 7
                Aim: to demonstrate that humans and animals also emit CO2 -gas, therefore also
                contributing to the greenhouse effect

Experiment 8    Metabolism and Carbon Dioxide (2)
                Aim: to demonstrate how plants influence the natural greenhouse effect

Experiment 9    Metabolism and Carbon Dioxide (3)
                Aim: to demonstrate how ecosystems influence the natural greenhouse effect

                Burning of Organic Compounds
Experiment 10
                Aim: to demonstrate that through the burning of fossil fuels (fields as well as
                forests) humans release additional CO2 into the atmosphere

                Plants and Temperature
Experiment 11
                Aim: to demonstrate that storms and temperature changes threaten existing
                vegetation

                Solubility of Carbon Dioxide in Water
Experiment 12
                Aim: to demonstrate that water is a carbon dioxide buffer. The oceans act as a
                "carbon dioxide reducer" because they can absorb the gas from the air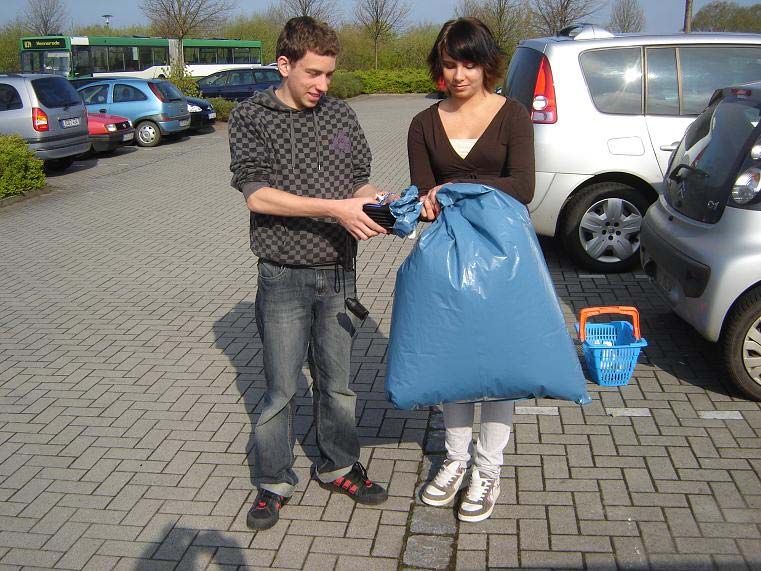
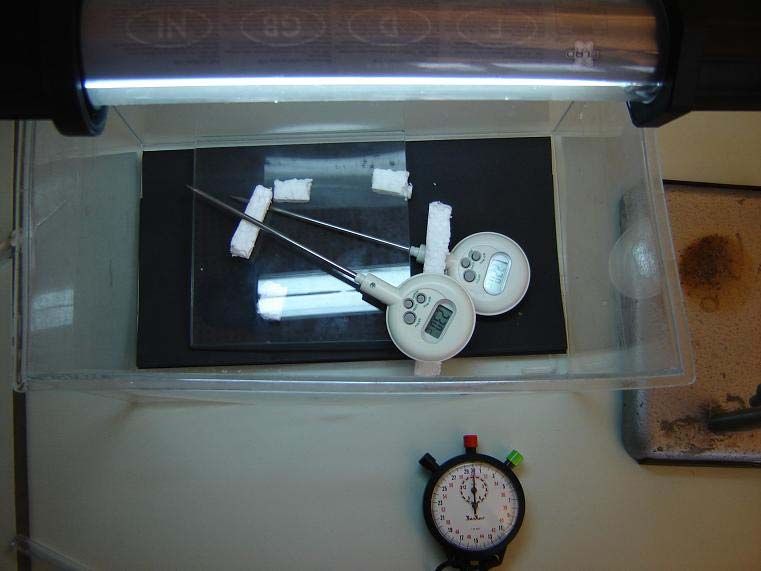
Experiment 1: Radiation determines temperature (1)
Aim
To demonstrate how closed (unheated) spaces are basically heat traps. We can all relate to
the unbearable heat in a car on a hot summer’s day, and we are also aware that a
greenhouse gets very hot inside too. This experiment aims to help pupils to understand the
reasons behind this type of everyday situation.
Materials
• A small glass or perspex tank or aquarium with thin walls,
• 2 digital thermometers, 0.1°-divisions,
• A clock, (stopwatch)
• A dark sheet of cardboard or surface
• Direct sun rays or neon glow lamp as a light source
.
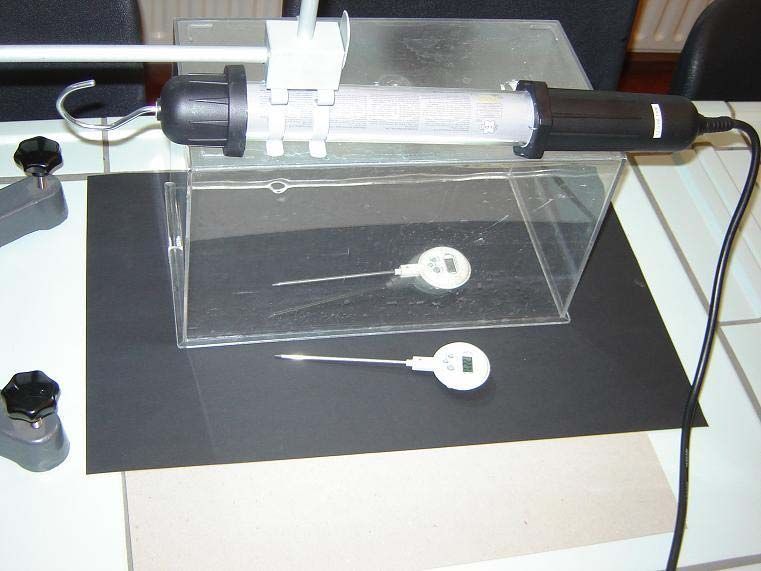
Procedure
1. Place the tank on a dark surface with a thermometer inside as shown in Figure 1.
2. Place a second thermometer on the same dark surface outside the tank. If sunlight is not
available, use a neon glow lamp as a light source.
3. Note the start temperature and then the temperature every 30 seconds for 20 minutes.
4. Plot the results in a graph.
5. Answer the following questions:
- Which thermometer shows a faster rise in temperature?
- How can you explain this?
- How can you apply this to the Earth and the atmosphere?
- Why is a dark background necessary for the experiment?
Figure 1: experimental set-up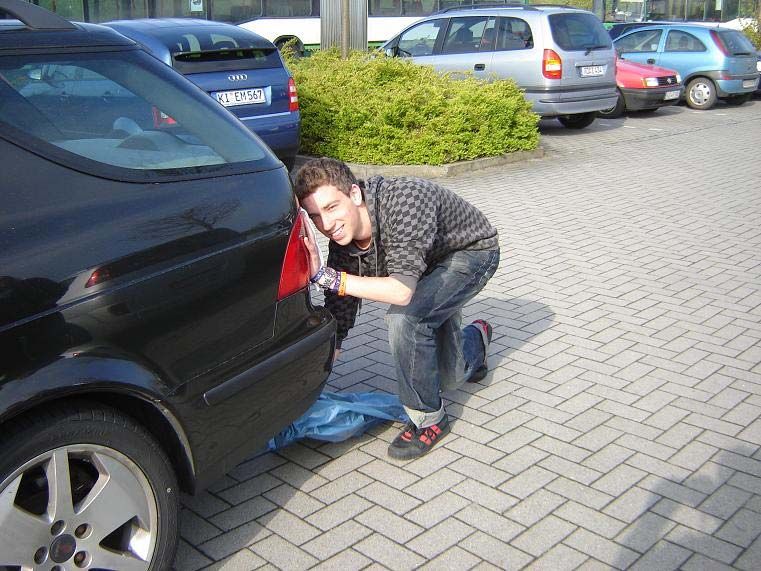
Discussion of results
The temperature in the tank rises faster than outside of the tank. The end temperature in the
tank is considerably higher (Δ T = 2-4 K) than outside of the tank.

The surface beneath the tank absorbs parts of the light spectrum and emits thermal
radiation. This is specially facilitated by the dark background, which imitates the colour of the
land surfaces. The perspex or glass wall absorbs this thermal radiation and emits it in all
directions including partly back into the tank. Since there is no new cool air entering the tank,
the air inside the tank heats up more than outside it.

Sunlight radiation reaching the earth is partly absorbed and changed into thermal radiation
which warms up the atmosphere. Atmospheric gases such as water vapour, carbon dioxide,
methane, and nitrous oxide absorb this thermal radiation and emit it in all directions. Part of
this heat is released into space and a certain part goes back towards the earth, resulting in
the heating up of the atmosphere.

Notes
The thermometers must have the same colour in order to avoid absorption errors.
There are considerable temperature differences depending on the light source.
Some digital thermometers, although identical, show differences in their readings of the
same object. If very precise digital thermometers are not available, it is advised to note the
temperature changes and not the absolute temperature values.
Experiment 2: Radiation determines temperature (2)

Aim
To demonstrate how different colours absorb and emit light and warmth rays with varying
strengths

Materials
• Two different coloured sheets of paper (for example, black and white). Be sure that they
  are the same kind of paper e.g. art paper
• two digital thermometers, 0,1°-divisions,
• Stopwatch
• direct sunight or neon glow lamp

Procedure
1. Place a thermometer on each sheet of paper under a light source as in figure 2. Be sure
that both are the same distance from the light source.
2. Note the start temperature and then the temperature every 30 seconds for 20 minutes
3. Plot the results in a graph. To facilitate comparison, note the temperature change.
4. Answer the following questions:
        - Which thermometer shows a faster rise in temperature?
        - How can you explain this?
        - How can you apply this to the Earth and the atmosphere?

Discussion of results
Due to the different coloured backgrounds, the thermometers show different results. Black
shows a higher, and white shows a lower temperature.

The different coloured sheets absorb different parts of the light spectrum and emit
thermal radiation. The more light energy that is absorbed, the more thermal energy is
emitted.

Sunlight radiation reaching the earth is partly absorbed and changed into thermal radiation
that is emitted and warms up the atmosphere.

Notes
The thermometers must have the same colour in order to avoid absorption errors.
Caution: This experiment can (totally unexpectedly) fail. Not every optical white is a thermal
white. This means that white paper can absorb in the ultraviolet and emit in the infrared
sphere.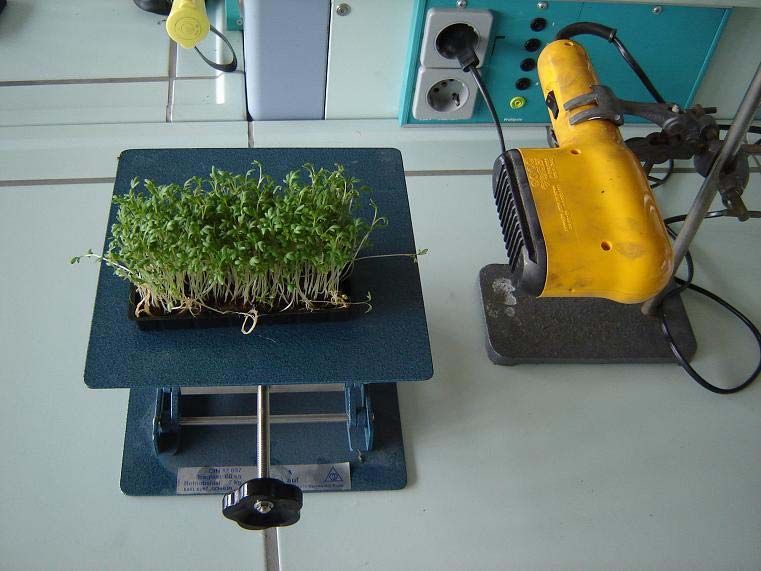
Experiment 3: Radiation determines temperature (3)

Aim
To demonstrate how CO2 gas absorbs heat rays more than normal "air": CO2- gas is
"thermally darker" than normal air

Material
• CO2 gas
• two balloons of the same colour (condoms work well),
• thermopile, power supply, electric measuring instrument.

Procedure
1. Place an air-filled balloon held by hand onto the thermopile. Your hand behind the balloon
is the heating element and should be opposite the thermopile (Figure 3).
2. Note down the values of the connected electric measuring instrument (measure voltage)
3. Place a balloon filled with CO2 in the same way.
4. Note down the values of the connected electric measuring instrument
5. Compare and explain your values for the two balloons

                                 Figure 3: Experimental set-up

Discussion of results
The thermopile is a device which measures thermal energy and converts it to electrical
energy. The readings in the meter (voltage) show how much of the heat which is produced
from the source, your hand, reaches the sensor on the other side. The higher the value, the
more heat is measured. The values are lower for the balloon containing CO2, showing that
something must have happened to the heat from one side of the balloon to the opposite side.
Conversely, higher readings for the balloon filled with air means that the heat can pass
through the balloon unhindered. This can be attributed to two things: 1. The CO2 inside the
balloon absorbed the heat produced by your hand, allowing less heat to pass to the other
side, and 2. CO2 is a poor conductor of heat.

.
Experiment 4: Radiation determines Temperature (4)
Aim
To demonstrate how the absorption of heat rays by CO2 gas leads to a rise in the
temperature of the CO2 gas
Materials
• perspex (acrylic, plexiglass) tank
• digital thermometer with cable connection to a temperature sensor
• cling film
• source of heat
• carbonated mineral water
• hose
• meterstick
• stopwatch
• CO2 gas
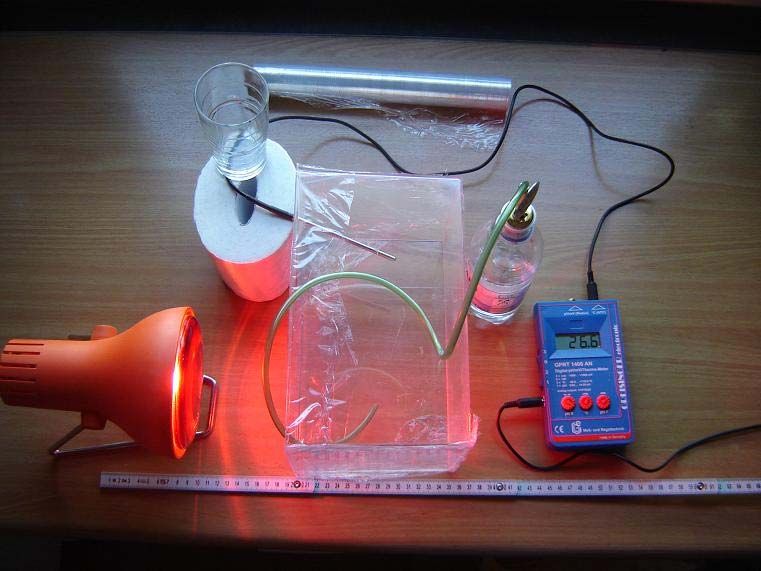
Procedure
Part 1
1. Place the temperature sensor inside the tank, close it with cling film and place it at an
accurately defined distance from the heat source (Figure 4).
2. Note down the initial temperature and the temperature every 30 seconds for twenty
minutes
Part 2
3. Fill the tank with carbon dioxide from the CO2.or by connecting the hose to the mouth of
the mineral water bottle.
4. Place the temperature sensor inside the tank, close it with cling film and place it the same
distance from the heat source as in part 1.
5. Note down the initial temperature, and the temperature every 30 seconds for twenty
minutes
6. Plot your results for both parts of the experiment in one graph
7. Describe and try to explain your results
Note: allow the tank to cool down between the two experiments.
Figure 4: Experimental set up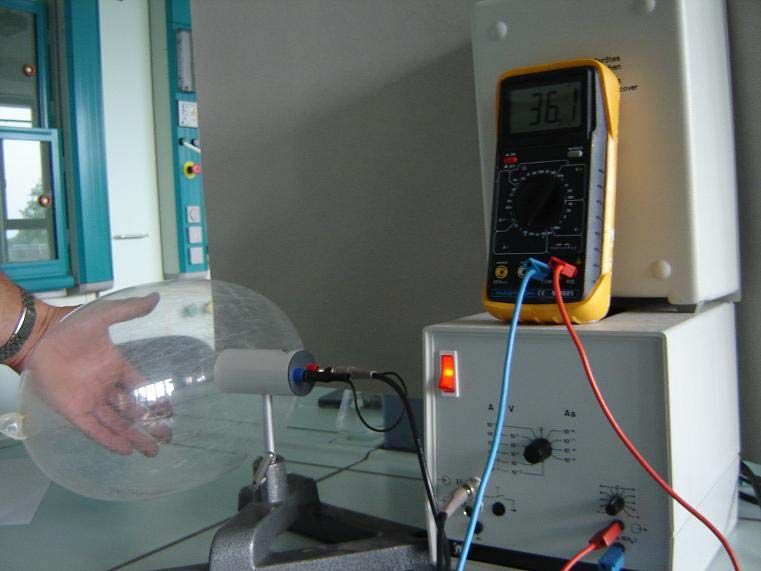
Discussion of results
The temperature increases in both experiments (about 15 K). The increase is higher with
carbon dioxide in the tank. There is a temperature difference of about 2 K after 20 minutes.

We know that infrared rays cannot pass directly through the tank walls. Acrylic glass,
however, absorbs heat. This heat is radiated in all directions including into the tank. The CO2
inside the tank absorbs this heat radiation, and the gas itself is heated. This heat is confined
inside the tank explaining the higher increase in temperature in the tank containing CO2.
Without CO2, air alone cannot absorb heat and is thus not heated. Most of the heat inside the
tank without CO2 is re-emitted back to the outside through the tank walls via conduction.
Experiment 5: Radiation determines Temperature (5)

This experiment concerns the key issue within the entire climate problem: namely that all of
the factors affecting climate are in the area closest to the earth’s surface. It is interesting
because it can be done with simple materials and with a relatively simple explanation, and
yet is very convincing.

Aim
To demonstrate that a CO2 -layer closer to the earth is warmed up more than higher layers of
atmosphere

Materials
•   perspex (acrylic, plexiglass) tank
•   black cardboard (to simulate earth’s surface),
•   5mm thick sheet of perspex 5 mm (simulates CO2-holding air)
•   two digital thermometers
•   fluorescent (white) lamp as cold light source
•   stopwatch

Procedure
1. Place the black cardboard at the bottom of the tank.
2. Place a thermometer on the cardboard. The sensor should not touch the cardboard.
3. Cover the thermometer with the layer of perspex. Place a second thermometer on top of
the sheet of perspex .
4. Place the fluorescent lamp at an adequate distance from the tank, making sure that it is lit
horizontally from above (figure 5).
5. Note the initial temperature, and the temperature every 30 seconds for 20 minutes of both
thermometers
6. Describe your observations and try to explain them
7. How can you put your findings into the context of the climate and atmosphere?

                                  Figure 5: Experimental set up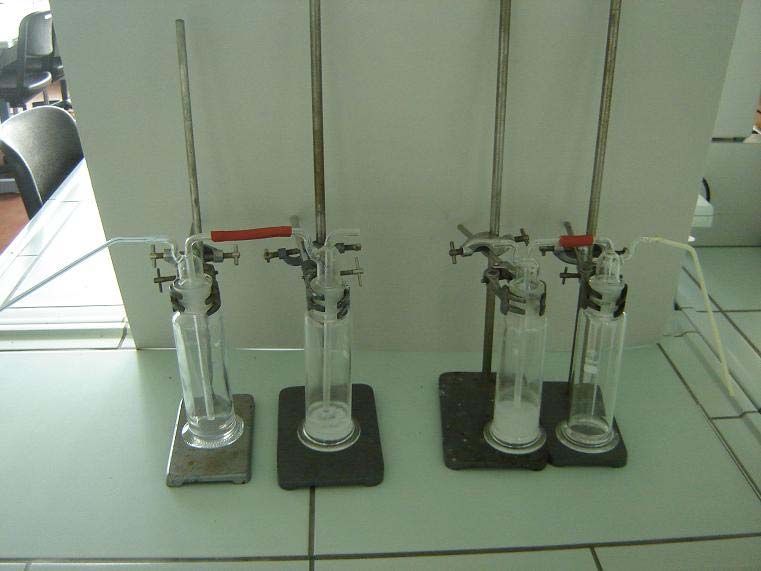
Discussion of results
After about 20 minutes the bottom thermometer shows a 2 to 4 K higher temperature.

Perspex has a good transmittance for light but not for thermal radiation It absorbs thermal
radiation and emits it in all directions, including back to where it came from. You can easyly
test this by putting perspex between a heater (for example electric iron) and the cheek.

Perspex has similar properties to carbon dioxide gas and it can be used in place of the gas in
this experiment.

The atmosphere (the perspex) has a good light transmittance (the visible part). When light
reaches the earth (black cardboard), a part is absorbed and warms the earth’s surface. The
warmed earth surface acts secondarily as a source of thermal radiation. If there were no
climate gases, e.g. carbon dioxide in the air, this thermal radiation would be distributed
throughout the earth’s atmosphere and to outer space. The carbon dioxide layer absorbs the
heat and it heats up too. What does a warm body (even when it is made of gas) do? It sends
heat out in all directions: above to outer space and below into the atmosphere and to the
earth’s surface. The two latter components become even warmer.
It can be seen, that it becomes warmer under the climate gas layer (in the experiment under
the perspex plate), than above this layer (plate).
Experiment 6: Combustion, metabolism and production of carbon dioxide

Aims
• to compare the quantity of CO2 that is released from a car when driven with that released
  when it is pushed
• to demonstrate how human activities increase CO2 in the atmosphere

Previous knowledge required:
The greenhouse effect. The hypothesis of these experiments is: ecosystems produce a
natural carbon dioxide content of the air and human activities increase the CO2 content of air
and strengthen the greenhouse effect.

Materials
• a car
• 4 bin bags (one big (50L), three small (20L))
• gas detector pump accuro from Dräger
• Dräger Short Term Detector Tubes for CO (measuring range 0,3-7Vol.%) and CO2
  (measuring range 1-20Vol%)
• clock/stopwatch
• meterstick
• piece of chalk
• piece of string or alternative for measuring volume of bags (e.g. suction pump)

Procedure
1. The teacher and two students drive a distance of 10 m in the car.
2. The students then push the car over a distance of 10m. Using the stopwatch, time how
long this takes.
3. Use the bin bags to collect the air exhaled by the students and the emissions of the car.
4. Calculate the volume of the closed garbage bags by forming them into cylinders and
measuring their radius and length , or measuring them with a suction pump.
5. Having rested for 5 minutes, the same students who pushed the car, exhale into the two
other bags for the same length of time that they pushed the car.
6. Determine the CO and CO2 content with the detector tubes.

Note: You must be sure that the car is already moving when the experiments begin. (One
detector tube is enough for the two students (you have to divide the measured value by
two)). The temperature of the car emissions must be lower than 40°C.
(see figures 6a,b,and c below)
Figures 6a and 6b:
collecting and measuring CO and CO2 concentrations with the
                     Drägr gas detector
Figure 6c gas detector
Example of Calculations and Results
1. Calculation of the volume of the exhaled air and car emissions:
V = 3.1416 r2h
Results for 10 m distance
Car: 40L emission with 14% CO2 and more than 3000 ppm CO.
Students: about 20L exhaled air with 3% CO2 (without CO) in 8sec
Standing Students: about 17L exhaled air with 2,5% CO2 (without CO) in 8sec
2. Calculation of the mass of CO2
To calculate the approximate mass of CO2, m(CO2), in the bags you may use the Ideal Gas
Equation. In this case you need additional information about pressure and temperature and
the formula Vo/mol(CO2) = 22,26 L.
In the bin bags the temperature and pressures are higher than 0°C and 100 kPa, but for an
approximate calculation you can neglect this piece of information and calculate with
V/mol(CO2) = 22 L
Calculation:
n(CO2) = overall volume x CO2 content /(22L/mol)
m(CO2) = n(CO2) x M(CO2) where M(CO2) is the molar mass of (CO2)
So n(CO2, car emission) = 40 x 0.14/22
= 0.255mol,
and therefore m(CO2) = 0.255 x 44 = 11.2 g
n(CO2, students) = 20 x 0.03/22
= 0.0273moln(CO2, standing students) = 17 x 0.025/22
= 0.0193mol
n(CO2, students) - n(CO2, standing students) = 0.0273mol - 0.0193mol
= 0,00798mol
m(CO2) = 0.00798 x 44 = 0.351g
We thus obtain a ratio of 11.2 : 0.351, in other words 32 times more CO2 is released into the
atmosphere when the car is driven compared with when the car is pushed. In addition, the
students produce no carbon monoxide.
Conclusion
This experiment does not claim exactness of results, but it does show that one should not
use the motor cars so much. Whoever wishes for a stabile climate should push his car!Experiment 7: Metabolism and Carbon Dioxide (1)
Aim
To demonstrate that humans and animals also emit CO2 -gas, therefore also contributing to
the greenhouse effect
Material
• four gas washbottles with small rubber tubings and glass tubes
• four stands with clamps
• fresh calcium hydroxide solution
• ethanol
Procedure
1. connect the gas washbottles to the stands
2. fill two of them 3 cm high with freshly prepared calcium hydroxide solution
Attention! calcium hydroxide is a corrosive solution
3. connect one of the filled bottles to an empty bottle with a hose
5. fit a glass tube previously cleaned with ethanol onto the empty bottles (see figure 7).
6. inhale 5 times through the glass tube (left part of the picture).
7. exhale 5 times through the other glass tube (right part of the picture).
Attention! The position of the glass tube in the bottle with calcium hydroxide solution
varies between inhalation and exhalation
8. Note your observations and try to explain them.
Figure 7: Experimental set-upDiscussion of results
In the right hand washbottle a white, milky precipitation is formed, while in the left hand bottle
only a white opaque substance can be observed.
Calcium hydroxide solution reacts with carbon dioxide to create solid white calcium
carbonate.
Ca2+(aq) + 2OH-(aq) + CO2(g) CaCO3(s) + 2H2O(l)
We exhale more carbon dioxide than we inhale.
There is a natural causal carbon dioxide content in the air, and therefore a natural
greenhouse effect.
Note
When students exhale too much the precipitation redissolves because of the formation of
hydrocarbonate ions. This makes the water acidic and thus dissolves the CaCO3.
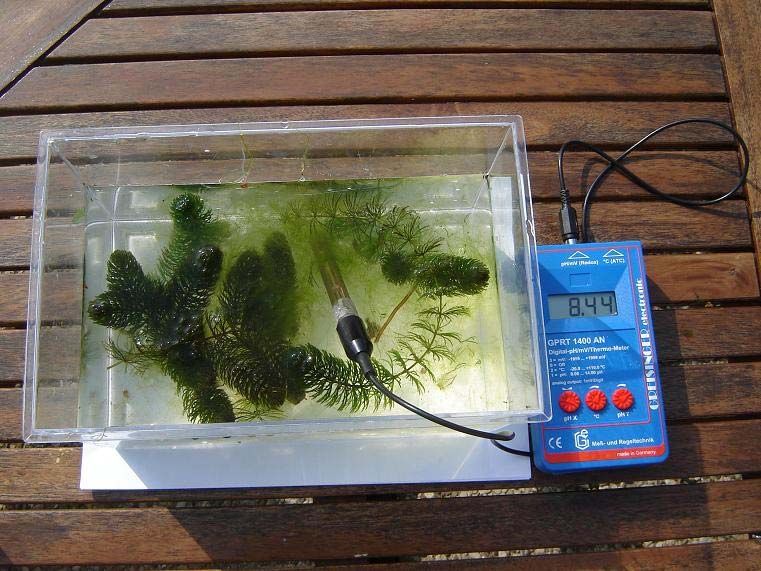
CaCO3(s) + 2H2O(l) + CO2(g) Ca2+(aq) + 2HCO3-(aq)Experiment 8: Metabolism and Carbon Dioxide (2)
Aim
To demonstrate how plants influence the CO2 atmospheric concentration and then the
natural greenhouse effect
Material
1. one fern plant (it has a low compensation point)
2. one dark and one clear plastic bag
3. thin rope
4. one fluorescent lamp, or even better, direct sunlight
5. one carbon dioxide gas detector electrode (TSI IAQ-Calc 7535) or three beakers with fresh
calcium hydroxide solution,
6. three glass tubes with tops
7. one bag for a blind test.
Experimental Procedure
1. Place the plant in a dark plastic bag and close the bag.
2. Through a small gap measure the change in carbon dioxide air content with the CO2
sensor for 20 minutes every minute
3. Place the plant in a clear plastic bag and measure CO2 concentration in the bag every
minute for 20 minutes
4. Create a graph to represent your data
5. Describe the curves in your graph and try to explain them
Note: If you do not have a gas detector you can squeeze the air through gas wash bottles
with calcium hydroxide solution. Fill another bag with air and do the same as a blind test.
This will just show a qualitative result.
Figure 8: Experimental set-upDiscussion of results
In the dark plastic bag, the carbon dioxide concentration increases over time, while in the
clear plastic bag it decreases.
Plants photosynthesise and respire. During photosynthesis they absorb carbon dioxide and
transform it to glucose via “reduction”:
6CO2 + 12H2O → C6H12O6 + 6H2O + 6O2
Plants reduce the CO2 content of air, but when there is lack of light the plants give out CO2
by respiration:
C6H12O6 + 6O2 → 6CO2 + 6H2O
Plants absorb and emit CO2 -gas, therefore also contributing to the greenhouse effect.Experiment 9: Metabolism and Carbon Dioxide (3)
Aim
To demonstrate how ecosystems influence the natural carbon cycle and then the
greenhouse effect
Material
• 2 beakers (500mL)
• 1 opaque plastic bag
• a fluorescent lamp or direct sunlight
• A pH meter
• pond water with living plankton algae and submerged aquatic plants
Procedure
1. Fill a tank with about 1 L of clear pond water and some submerged aquatic plants
2. Place the tank in the sun or under a fluorescent lamp
3. Note the initial pH, the pH change every minute and the final pH after 20 minutes
4. Now place the tank in a dark plastic bag
5. Note the initial pH, the pH change every minute and the final pH after 20 minutes
6. Create a graph to represent your data
7. Describe your curves and try to explain them
Figure 9: Experimental set-up for tank in sunlightDiscussion of results
When the tank is placed in the sun, the pH increases, while when it is in darkness, the pH
decreases.
The organisms in the dark bag released carbon dioxide through respiration. The pH falls
because carbon dioxide reacts with water by forming cabonic acid which undergoes
protolysis:
H2O(l) + CO2(g) H2CO3(aq)
H2CO3(aq) + H2O(l) H3O+(aq) + HCO3-(aq)
HCO3-(aq) + H2O(l) H3O+(aq) + CO32-(aq)
In the clear bag the phytoplankton, other algae and submerged aquatic plants absorb carbon
dioxide from the water. Therefore the pH increases, even in the alkaline area. For example:
CO32-(aq) + H2O(l) CO2(aq, photosynthesis) + 2OH-(aq)
Under these alkaline conditions, carbon dioxide is much more easily taken out of the air
because of a neutralisation reaction.
This demonstrates that aquatic systems influence the "greenhouse effect" and the carbon
dioxide balance can be positive or negativeExperiment 10: Burning of Organic Compounds
Aim
To demonstrate that through the burning of fossil fuels (fields as well as forests) humans
release additional CO2 into the atmosphere
Materials
• 1 glass funnel
• two stands with clamps
• 3 washbottles
• 1 water pump (suction)
• 2 hose connections
• 2 porcelain basins
• 1 stopwatch
• gasoline
• pieces of wood
• calcium hydroxide solution.
Procedure
1. Place the glass funnel upside-down and connect it to the stand
2. Place the porcelain basin underneath the funnel
3. Connect the funnel to the washbottle with a hose which is on another stand
4. Connect the washbottle to the water pump.
5. Burn the gasoline in the porcelain basin and let the gases be sucked through the funnel
and into a washbottle filled three cm high with calcium hydroxide solution.
6.Take note of the time until a precipitation builds up..
7. Do a blind test without burning
8. Take note of the time until a precipitation builds up
9. Compare your observations for the experiment with the wood, gasoline and no burning.
Try to explain your observations
Discussion of results
There is a noticeable faster build up of milky precipitation with burning than in the blind test
without burning. This milky precipitation is the result of the carbon dioxide passing through
the calcium hydroxide solution and the subsequent precipitation of calcium carbonate.
This experiment demonstrates that by burning fossil fuels as well as wood, a great amount of
CO2 is set free into the atmosphere.
This increases the greenhouse effect.
Notes
It is possible that the precipitation redissolves after a time because of forming
hydrocarbonate ions: (see above for explanation)
CaCO3(s) + 2H2O(l) + CO2(g) Ca2+(aq) + 2HCO3-(aq)Experiment 11: Plants and Temperature
Aim
To demonstrate that storms and temperature changes threaten existing vegetation
Material
1. stand with clamps
2. hair dryer
3. a block of cress sprouts about 3 cm wide
Procedure
1. Place a block of cress sprouts in front of the hairdryer. Turn the dryer on. (figure 11)
2. Note down your observations and explain them. How can you relate this experiment
to climate changes?
Figure 11: Experimental setup
Discussion of results
After a short time the plants will be lying irreversibly flat on the ground.
This experiment shows that cress cannot exist in warm, dry air. The plants cannot survive
drastic environmental changes.
Large climate changes are predicted for the future. This experiment shows that climate
changes can possibly change or destroy vegetation.Experiment 12: Solubility of Carbon Dioxide in Water
Aim
To demonstrate that water is a carbon dioxide buffer. The oceans act as a "carbon dioxide
reducer" because they can absorb the gas from the air
Materials
• 250 mL Erlenmeyer flask
• pH-meter,
• CO2 gas or carbonated mineral water
• rubber tubing
• (sea)water
Procedure
1. Fill the flask with water that has a known pH.
2.Add CO2 from the CO2 tank or by shaking the bottle of soda water and transferring the
released CO2 into the flask using the rubber tubing)
3. Measure the pH of the (sea) water continuously.
4. Make a note of your results and try to explain them.
Figure 12: experimental set-upDiscussion of results
The pH of the water falls continuously.
CO2 is dissolved in water. Water is a CO2 buffer:
CO2(g) CO2(aq)
H2O(l) + CO2(g) H2CO3(aq)
This experiment demonstrated that the oceans reduce the CO2 content of the air; because
they can absorb the gas from the air. When the pCO2 in the air is higher than in the water,
CO2 is taken up by the water until equilibrium is attained.
Additional Experiment
Materials
• 1 liter plastic bottle
• CO2 bottle or mineral/soda water
• rubber tubing
• tap water.
Procedure
1. Fill the plastic bottle about a quarter-full with water
2 Add CO2 from the CO2 tank or by shaking the bottle of soda water and transferring the
released CO2 into the flask using the rubber tubing)
3. Put the cap back on the bottle and shake it.
4. Make note of your observations
Discussion of results
The sides of the plastic bottle are sucked inwards.
This happens because shaking causes an increase in the surface area of the water where
gas exchange can take place. Thus CO2 is absorbed more quickly and the gas volume
decreases.
D: Links for material:
http://www.buydraegertubes.com/ca-cy.aspx
http://www.draeger.com/ST/internet/US/en/Products/Detection/Drager-
Tubes/Pumps/accuro/pd_accuro.jsp
http://www.afcintl.com/gasdet/draeger/accuro.htm
http://tsi.com/uploadedFiles/Product_Information/Literature/Application_Notes/TSI-146-Field-
Calibration-5001233-web.pdfYou can also read