Gloucester Shire and Great Lakes Councils - Fit for the Future - Shared Modelling - IPART
←
→
Page content transcription
If your browser does not render page correctly, please read the page content below
Gloucester Shire and
           Great Lakes Councils

 Fit for the Future - Shared Modelling

                                March 2015

SYDNEY    BRISBANE   AUCKLAND     WELLINGTON
TABLE OF CONTENTS
1. INTRODUCTION .................................................................................................................... 1
1.1 Fit for the Future ....................................................................................................... 1
1.2 Shared modelling ...................................................................................................... 1
1.3 Tight timeframes ....................................................................................................... 2
2. SCOPE ............................................................................................................................. 3
2.1 Multiple scenarios ..................................................................................................... 3
2.2 Reporting .................................................................................................................. 3
3. EXECUTIVE SUMMARY........................................................................................................ 4
3.1 Scale and capacity ................................................................................................... 4
3.2 Fit for the Future benchmarks comparison................................................................ 4
3.3 What is required to meet the benchmarks................................................................. 5
3.4 Merged council ......................................................................................................... 5
4. DETAILED ANALYSIS ........................................................................................................ 10
4.1 Status quo .............................................................................................................. 10
4.2 Meeting the benchmarks ........................................................................................ 16
4.3 Merged council ....................................................................................................... 20
5. CONCLUSIONS ................................................................................................................... 50
5.1 Meeting the benchmarks ........................................................................................ 50
5.2 Merged council ....................................................................................................... 51
APPENDIX A Fit for the Future Benchmarks ............................................................................ 56
APPENDIX B Costs and Benefits arising from a merger of the Gloucester Shire and Great
Lakes Councils – Detailed Assumptions............................................................. 61
APPENDIX C Great Lakes and Gloucester - Planning Controls around Natural Environment,
Built Heritage and Approach to Growth and Development.................................. 72
APPENDIX D Comparison of Community Strategic Plans of the two Councils ......................... 74
APPENDIX E Detailed Community Profile ................................................................................ 76
Morrison Low
Ref: 7054: Fit for the Future – Shared Modelling Report for Gloucester Shire and Great Lakes Councils i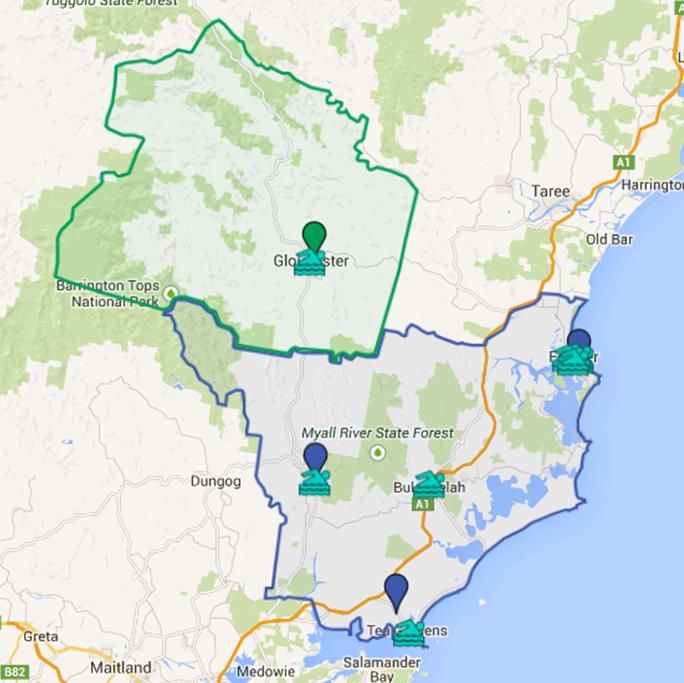
TABLES Table 1 Overall comparson of options against Fit for the Future benchmarks ............................4 Table 2 Summary of infrastructure funding gap..........................................................................5 Table 3 Operating performance funding gap ..............................................................................5 Table 4 Merged council asset funding gap .................................................................................6 Table 5 Comparison of debt .......................................................................................................6 Table 6 Merged council modelled rating impacts........................................................................7 Table 7 Comparison of representation .......................................................................................8 Table 8 Summary of costs and savings ......................................................................................9 Table 9 Fit for the Future benchmarks 2014............................................................................. 11 Table 10 Gloucester Shire Council performance against Fit for the Future benchmarks ............ 12 Table 11 Great Lakes Council performance against Fit for the Future benchmarks ................... 12 Table 12 Operating performance funding gap ............................................................................ 17 Table 13 Asset maintenance funding gap .................................................................................. 17 Table 14 Asset renewal gap....................................................................................................... 18 Table 15 Cost to bring assets to satisfactory .............................................................................. 19 Table 16 Combined asset funding gap ....................................................................................... 20 Table 17 Comparison of proposed merged council and Lisborn Council .................................... 20 Table 18 Comparison of representation ..................................................................................... 24 Table 19 Key differences and similarities between the worksforces ........................................... 27 Table 20 High level description of financial costs and savings arising from merger .................... 29 Table 21 Summary of financial costs and savings ..................................................................... 30 Table 22 Summary of financial costs and savings ...................................................................... 31 Table 23 Summary of financial impacts of merger...................................................................... 32 Table 24 Comparison of total and average rating revenue ......................................................... 33 Table 25 Comparison of proportion of rates ............................................................................... 35 Table 26 Comparison of debt ..................................................................................................... 39 Table 27 Scale and capacity in the merged councils .................................................................. 41 Table 28 Summary of merged council using Fit for the Future indicators ................................... 42 Table 29 Merged council asset maintenance funding gap .......................................................... 46 Table 30 Merged council asset renewal funding gap.................................................................. 47 Table 31 Merged council infrastructure backlog funding gap ...................................................... 47 Table 32 Merged council asset funding gap ............................................................................... 47 Table 33 Operating performance funding gap ............................................................................ 47 Table 34 Summary of infrastructure funding gap ........................................................................ 50 Table 35 Operating performance funding gap ............................................................................ 50 Table 36 Merged council asset funding gap ............................................................................... 51 Table 37 Summary of merged council using Fit for the Future indicators ................................... 52 Table 38 Merged council modelled rating impacts...................................................................... 52 Table 39 Summary of costs and savings .................................................................................... 54 Morrison Low Ref: 7054: Fit for the Future – Shared Modelling Report for Gloucester Shire and Great Lakes Councils ii
FIGURES
Figure 1 Map of Gloucester Shire and Great Lakes Councils .................................................... 10
Figure 2 Operating performance ratio........................................................................................ 13
Figure 3 Own source revenue ................................................................................................... 13
Figure 4 Debt service ratio ........................................................................................................ 14
Figure 5 Asset renewal ratio ...................................................................................................... 14
Figure 6 Infrastructure backlog ratio .......................................................................................... 15
Figure 7 Asset maintenance ratio .............................................................................................. 15
Figure 8 Real operating expenditure ......................................................................................... 16
Figure 9 Infrastructure backlog recalculated using the standard Morrison Low methodology
(2014) ......................................................................................................................... 19
Figure 10 Key services and facilities of the councils .................................................................... 21
Figure 11 Summary of Gloucester Shire Community Strategic Plan ............................................ 25
Figure 12 Summary of Great Lakes Community Strategic Plan ................................................... 26
Figure 13 Average residential rate (2014 - 15) ............................................................................ 33
Figure 14 Average business rate (2014 - 15) .............................................................................. 34
Figure 15 Average farmland rate (2014 -15)................................................................................ 34
Figure 16 Change in residential rate (ad valorem) ....................................................................... 36
Figure 17 Change in residential rate (base rate) ......................................................................... 36
Figure 18 Change in business rate (ad valorem) ......................................................................... 37
Figure 19 Change in business rate (base rate)............................................................................ 37
Figure 20 Change in farmland rate (ad valorem) ......................................................................... 38
Figure 21 Change in farmland rate (base rate) ............................................................................ 38
Figure 22 Scale and capacity ...................................................................................................... 40
Figure 23 Merged council operating performance ratio ............................................................... 43
Figure 24 Merged council own source revenue ........................................................................... 43
Figure 25 Merged council debt service ratio ................................................................................ 44
Figure 26 Merged council asset renewal ratio ............................................................................. 44
Figure 27 Merged council infrastructure backlog ratio ................................................................. 45
Figure 28 Merged council asset maintenance ratio ..................................................................... 45
Figure 29 Merged council real operating expenditure .................................................................. 46
Morrison Low Consultant Pty Ltd
PO Box K451
Haymarket
Sydney 1240
Tel: 02 9211 2991
Fax: 02 9212 0782
www.morrisonlow.com
Document Status
Approving Director: D R Bonifant Date: March 2015
© Morrison Low
Except for all client data and factual information contained herein, this document is the copyright of Morrison Low
Consultants Pty Ltd. All or any part of it may only be used, copied or reproduced for the purpose for which it was
originally intended, except where the prior permission to do otherwise has been sought from and granted by Morrison
Low Consultants Pty Ltd. Prospective users are invited to make enquiries of Morrison Low Consultants Pty Ltd
concerning using all or part of this copyright document for purposes other than that for which it was intended.
Morrison Low
Ref: 7054: Fit for the Future – Shared Modelling Report for Gloucester Shire and Great Lakes Councils iii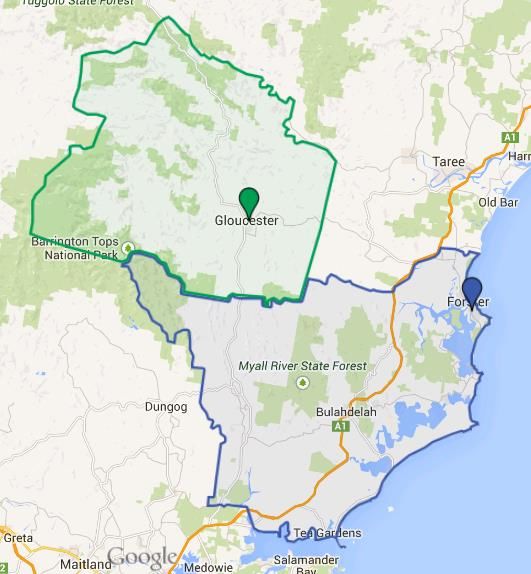
1. INTRODUCTION 1.1 Fit for the Future Three years ago, local councils from throughout NSW gathered for a summit, Destination 2036, to plan how local government could meet the challenges of the future. As a result, councils agreed that change was needed and that they wanted to be strong and sustainable and to make a positive difference in their respective communities. However, there were various views as to how this could be achieved and in April 2012 the State Government appointed an independent expert panel to carry out a review of the sector. That Independent Local Government Review Panel consulted widely in developing its final recommendations which were presented to the Government in late 2013. The panel concluded that for councils to become strong and sustainable, both the NSW Government and the local government sector would have to play a part. The State indicated its preparedness to change the way it works with councils and to support them through meaningful reform. Local councils must also be prepared to consider new ways of working and new structural arrangements. The Fit for the Future program brings these changes together to lay the foundations for a stronger system of local government and stronger local communities. The Fit for the Future program requires councils to actively assess their scale and capacity in achieving long term sustainability and for councils to submit proposals to the Government indicating how they will achieve these objectives. Gloucester Shire Council and Great Lakes Council have commissioned Morrison Low through the Office of Local Government Merger Business Case Panel to undertake a merger business case using a broad range of factors (financial, social, environmental) in order for each council to understand the implications of the merger of the two councils proposed by the Independent Local Government Review Panel. 1.2 Shared modelling The modelling is prepared on the basis of the information publicly available and augmented by the councils. The modelling is provided identically to all of the councils in the project. Where the data is inconsistent or unclear it has not been included and will be recorded as either ‘no data’ or ‘no result’. 1.2.1 Providing information to enable councils to individually make their decisions The modelling is intended to allow the councils to individually and collectively understand what the benefits and dis-benefits of the merger of the councils. It has involved analysing historic, current and forecast performance as well as drawing in information from other jurisdictions in which we have been involved in local government reform (for example, transitional costs). The project is not intended to advise each council of the best option for them (although it may naturally fall out of the modelling. The project simply provides the information that will enable each council to determine its individual course of action, undertake informed consultation with its community, and ultimately form the basis of the council’s submission. Morrison Low Ref: 7054: Fit for the Future – Shared Modelling Report for Gloucester Shire and Great Lakes Councils 1
1.3 Tight timeframes The timeframes for this project have been challenging but we appreciate that the work has been required to allow plenty of time for each council to work through issues with the community or potential merger partners and prepare submissions for 30 June 2015. Notwithstanding that we fully understand the need for those tight timeframes, that understanding is tempered with a recognition that the data available for modelling has some limitations as a result. The standardisation of the data across the two councils has been conducted on a best efforts basis under those particular timing constraints. The data provided within the model is drawn from a variety of sources (including the councils directly) however it is acknowledged that the timeframe limits our capacity to refine both the available data and the model itself to a fine level of detail. For consistency across the councils, publicly available information has formed the basis of the analysis. This has been refined and modified through discussions and workshops with the councils. Notwithstanding these constraints, we have had great support from the staff of each council, providing quick responses to our requests for information and active and knowledgeable participation in the workshops. We thank the executives and staff of the councils for their input and cooperation. Morrison Low Ref: 7054: Fit for the Future – Shared Modelling Report for Gloucester Shire and Great Lakes Councils 2
2. SCOPE
2.1 Multiple scenarios
The shared modelling project was undertaken on the basis of evaluating the following options.
1. Status Quo
The baseline is measured against what each council has reported the current and future
financial position to be. The analysis is based on the published Financial Statements and
Long Term Financial Plans of the councils. Gloucester Shire Council has a Special Rate
Variation and an alternative scenario has been modelled which recognises the impacts of
that.
2. Meeting the Benchmarks
This scenario answers the question as to what each council would need to do to meet the
Fit for the Future benchmarks. It does not address the question of scale and capacity and
concentrates on the seven government benchmarks.
The scenario is built up by separately considering the operating result, asset renewal,
asset maintenance, and the infrastructure backlog. It identifies what, if any, funding gap
exists but it does not identify how the gap is to be resolved as that is a question for each
individual council. In some cases this has required a standardised approach to be used to
provide comparability.
We acknowledge the work each council has done to understand its assets and community
priorities and our analysis and assessment should be understood as applying to the
context.
3. Merged Council
This scenario models a merger of the two councils and assesses the advantages and
disadvantages of this against a series of criteria. The agreed criteria include financial and
non-financial indicators and go beyond the government’s Fit for the Future benchmarks to
incorporate communities of interest and the alignment between the council organisations.
The scenarios assess the advantages and disadvantages of this approach including the financial
costs and benefits.
2.2 Reporting
This report is intended to provide a collective body of information that each council will then use
to determine what is in the best interests of the council and community. As such it does not seek
to recommend any one option over another option for a particular council.
The report compares options and highlights advantages and disadvantages. The relative
weighting that each council then applies will be a matter for each individual council.
Morrison Low
Ref: 7054: Fit for the Future – Shared Modelling Report for Gloucester Shire and Great Lakes Councils 33. EXECUTIVE SUMMARY
This executive summary provides the key outcomes from our analysis. However the full report
needs to be read to provide the context to the analysis and assumptions that underpin the
modelling.
3.1 Scale and capacity
The Government has made it clear that the starting point for every council is scale and capacity.
In the case of Gloucester Shire Council and Great Lakes Council, and based on the Independent
Panel position, it appears that their view was that scale and capacity for each of the two councils
arises through a merger with each other.
While either council could make an argument that they can meet the scale and capacity tests,
councils need to do so recognising the stated government position which runs contrary to that. In
the case of Gloucester Shire Council it may be difficult, given the size of the council and the
population it serves to meet the government’s test around scale and capacity on its own but that
is something for the Council to assess. Great Lakes arguably can make a stronger case as the
merger (which meets scale and capacity) makes much less of an impact for Great Lakes than for
Gloucester when considered against the key aspects of scale and capacity
3.2 Fit for the Future benchmarks comparison
The government has established a set of Fit for the Future Benchmarks which all councils are
being assessed against. We have undertaken a detailed analysis of the financials and asset
management approaches on the following basis:
Gloucester Shire Council: A base case and then with their SRV
Great Lakes Council: A base case and then with their asset update
A Merged Council: Analysed on the base case basis
The table below summarises the results of that analysis.
Table 1 Overall comparison of options against Fit for the Future benchmarks
Great Lakes
Gloucester Shire Council Merged Council
Council
Modelling
Council Base case SRV Base case Day one
period
Operating Performance No No From 2021 No No
Own Source Revenue From 2018 From 2018 Yes Yes Yes
Debt Service Cover Yes Yes Yes Yes Yes
Asset Maintenance No No No No No
Asset Renewal No No From 2022 No No
Partial
Infrastructure Backlog No No No No
2016-2019
Real Operating
Yes Yes Yes Yes Yes
Expenditure
Morrison Low
Ref: 7054: Fit for the Future – Shared Modelling Report for Gloucester Shire and Great Lakes Councils 43.3 What is required to meet the benchmarks
In order for the individual councils to meet the Fit for the Future benchmarks throughout the
period from now until 2023 each council would need to address both an operating performance
funding gap and an asset funding gap.
The table below identifies the extent of the funding gap to address the infrastructure benchmarks
of asset maintenance ratio1, renewal ratio and bringing the infrastructure backlog2 to the
benchmark of 2% within five years.
Table 2 Summary of infrastructure funding gap
Average funding required Average funding required
3
Council per annum (5 years) per annum (5 years+)
($000) ($000)
Gloucester Shire Council -5,458 -3,212
Great Lakes Council -1,020 - 607
The table below identifies the average annual gap between operating revenue and operating
expenditure (as per the operating performance ratio guidelines) over the time period within each
council’s LTFP. Each council will also need to address this in order to meet the benchmark.
Table 3 Operating performance funding gap
Average gap
Council
($000)
Gloucester Shire Council -3,321
Great Lakes Council - 245
While addressing the additional expenditure requirements set out above should assist each
council to achieve the Fit for the Future benchmarks, each council must still address the
government’s starting point of scale and capacity first.
3.4 Merged council
3.4.1 Scale and capacity
On the basis that the independent panel recommendation proposed that either the two councils
merge or that there be a Mid-North Coast JO, it can be assumed that a merged council would
achieve the scale and capacity requirements.
3.4.2 Funding shortfall
The merged council is the sum of its parts. This means that the asset and financial positon of
each council directly contributes to the overall asset and financial position of the merged council.
1
Based on Morrison Low’s assessment of required maintenance
2
Based on condition 3 being satisfactory and as calculated using the Morrison Low methodology
3
Infrastructure funding gap does not take into account any potential SRV applications
Morrison Low
Ref: 7054: Fit for the Future – Shared Modelling Report for Gloucester Shire and Great Lakes Councils 5As with the individual councils, the merged council does not meet the asset related benchmarks.
Therefore a funding gap in order to address the asset maintenance, asset renewal and
infrastructure backlog ratios exists which is set out in the table below.
Table 4 Merged council asset funding gap
Average funding required per Average funding required per
Council annum (5 years) annum (5 years+)
($000) ($000)
Merged Council - 8,200 - 4,880
It is also important to consider that the average operating result of the merged council (calculated
on the same basis as the operating performance ratio and so excluding capital grants and
contributions) over the same period is a deficit of $10.4 million.
3.4.3 Fit for the Future benchmarks
A merged council would meet the benchmarks for the debt service, own source revenue and real
operating expenditure ratios from day one and remain above the benchmarks throughout the
period being modelled. Of the other indicators:
the Operating Performance ratio remains static at an average of around 11.1% of the
benchmark for the duration of the period modelled, well below the break-even requirement
for the benchmark
the Asset Maintenance ratio remains static at around 90% of the benchmark for the
duration of the period modelled, below the required benchmark of 100%
the Asset Renewals ratio falls from above 90% in 2016 substantially by 2019 to remain at
around the 75% mark, well below the required benchmark of 100%
the Infrastructure Backlog rises consistently from 3.6% to over 7% by the end of the
modelling period, remaining above the 2% benchmark.
3.4.4 Debt
Both councils carry debt which would be taken over by a merged council. However, both councils
meet the Fit for the Future benchmarks debt servicing ratios and so does the merged council, It is
recognised that debt is an issue of general concern to communities and the Gloucester
community may have a view about an increase in debt on a per capita basis with a merger,
although this is may be offset by the greater capacity to meet the debt servicing requirements
overall.
4
Table 5 Comparison of debt
Debt Debt Service Debt per Capita
Council
($000) Ratio ($)
Gloucester Shire
$3,696 4.4% $734
Council
4
Based on 2014 Actual
Morrison Low
Ref: 7054: Fit for the Future – Shared Modelling Report for Gloucester Shire and Great Lakes Councils 65
Great Lakes Council $50,174 13.0% $1,365
Combined $53,870 11.8% $1,289
3.4.5 Rates
Modelling the changes in rates in a merger is very difficult to do with any degree of accuracy as
there are a number of significant differences in the rating systems of the two councils which
impact on the rates charged to an individual property. Assuming a single rating system would be
put in place across the two councils, modelling of the impact on rates was carried out. Changes
to the average business, residential and farmland rates have been modelled using an entirely ad
valorem and then a base rate scenario to represent a range of potential impacts that could be
expected, with the results showing the percentage movement for each category shown in the
table below.
Table 6 Merged council modelled rating impacts
Gloucester Gloucester Great Lakes Great Lakes
(ad valorem) (base rate) (ad valorem) (base rate)
Residential - 8% + 19% + 1% - 1%
Business + 3% + 55% 0% - 6%
Farmland + 31% - 16% - 13% + 7%
3.4.6 Environment and community aspirations
Both councils have strongly stated desires to protect their environments with Gloucester looking
to value and protect their environment and Great Lakes having more of an emphasis on the
sustainable management of their environment. One area of difference is in the references each
council makes to infrastructure. The Gloucester Community Strategic Plan includes a key
direction around maintaining core infrastructure which like many areas facing static or declining
population, is a key issue to be addressed. Whereas Great Lakes refers in their vision to
balancing their unique and sustainably managed environment with quality lifestyle opportunities
created through appropriate development, infrastructure and services, which reflects the growth
and development pressures they, like many coastal councils, are facing.
3.4.7 Representation
A merged council with 11 councillors has been assumed, which would be a reduction in overall
councillor numbers from the present seven for Gloucester and nine for Great Lakes, with a
subsequent impact on representation as shown in the table below. It may be possible to put in
place measures to address the loss of representation for the Gloucester Shire Council residents
through local or community boards, but at present the government has not set out in detail any
proposal that the community could consider. Any changes in representation would be most
significantly felt in Gloucester where there are currently very high levels of representation.
5
Great Lakes Coucnil has recently taken advantage of the Office of Local Government Local Infrastrcutrue Renewal Scheme
(subsidised loan program) to borrow $18M
Morrison Low
Ref: 7054: Fit for the Future – Shared Modelling Report for Gloucester Shire and Great Lakes Councils 7Table 7 Comparison of representation
Representation
Council
(population / Councillor)
Gloucester Shire Council 717
Great Lakes Council 4,055
6
Combined 3,773
3.4.8 Community profile and communities of interest
Differences between Gloucester and Great Lakes reflect the different natures of the areas.
Gloucester being a smaller rural shire whereas Great Lakes is a larger and more urbanised area.
Both areas have similar age profiles, similar household types and both areas have low
multicultural diversity, and a lower education profile. While both areas are below the NSW
median for socioeconomic disadvantage, Gloucester has a relatively more socioeconomically
advantaged community, which is reflected in a higher SEIFA score, as well as higher home
purchasing and labour force participation and lower unemployment.
The population of Gloucester is predicted to decrease by 3.35 in the period to 2013 while the
population of Great Lakes is predicted to increase by 7.7%.
Studies of cross-border movements do not reveal high levels of interdependency between
Gloucester and Great Lakes, with Great Lakes linked more closely with Greater Taree.
Gloucester has higher employment containment, both in terms of place of residence of local
workers, and place of work of local residents.
3.4.9 Costs and savings of the merger
The costs and savings of the merger arising throughout the period have been modelled and
should be considered in conjunction with the infrastructure funding gap identified above and the
overall financial performance of the merged council when making a decision.
Transition costs are in the context of the two councils a significant cost in the early and mid-
periods of the newly merged council and arise from costs associated with creating the single
entity (structure, process, policies, systems and branding), redundancy costs and the
implementation of a single IT system. Longer term costs continue to rise as staff numbers
increase, which is typical of merged councils and considered to arise as a result of increased
services and service levels.
Savings initially arise in the short term through the reduction in the number of senior staff and
Councillors. In this case these are minor as only the General Managers are considered senior
staff. Natural attrition is used to reduce staff numbers in the short term with a focus on removing
the duplication of roles across the two councils and creating greater efficiency in operation,
however the overall decrease in staff numbers is small leading to a small saving. Procurement
and operational expenditure savings are also expected due to the size and increased capacity of
the larger council but again these are small given the increase in size is modest. In the medium
and longer term savings continue to arise.
6
Assumes 11 councillors
Morrison Low
Ref: 7054: Fit for the Future – Shared Modelling Report for Gloucester Shire and Great Lakes Councils 8Overall the modelling projects a net cost to the two councils arising from the merger as set out in
the table below.
Table 8 Summary of costs and savings
NPV at 4% NPV at 7% NPV at 10%
- $1.1 million - $1 million - $.96 million
3.4.10 Risks arising from merger
There are a number of significant potential financial and non-financial risks arising from any
merger that will need to be considered, including the following which have been outlined in this
report:
Transitional costs may be more significant than set out in the business case
The efficiencies projected in the business case may not be delivered
The implementation costs maybe higher and the anticipated savings may not be achieved
Decisions subsequent to the merger about the rationalisation of facilities and services may
not reduce the cost base of the merged organisation as originally planned
The cultural integration of the two council organisations may not go well resulting in low
morale, increased staff turnover rate etc, reducing business performance and prolonging
the time it takes for the predicted efficiencies to be achieved
Where two unequal sized councils merge there is a danger it is seen not as a merger but
as a takeover by, in the case Great Lakes, the larger council
Service levels rise across the merged council, standardising on the highest level of those
services that are being integrated
New services are introduced that are not currently delivered in one or more of the former
council areas
The financial performance of the merged council is less than that modelled, resulting in
the need to either reduce services, find further efficiency gains and/or increase rates to
address the operating deficit
Morrison Low
Ref: 7054: Fit for the Future – Shared Modelling Report for Gloucester Shire and Great Lakes Councils 94. DETAILED ANALYSIS
4.1 Status quo
Gloucester Shire Council and Great Lakes Council occupy a large geographic area north of
Newcastle and south of the NSW Mid-Coast. Great Lakes Council borders the sea and
Gloucester being inland of it. A map of the area is set out below and shows each council area
and the current location of the main council offices.
Figure 1 Map of Gloucester Shire and Great Lakes Councils
As a starting point, the Councils’ current performance against the Fit for the Future benchmarks7
has been considered and set out in the table below. We believe it is important to understand the
respective position of each council as it is today and the results are those reported in the 2014
Financial Statements of each council. Figures in red are those where the Council does not meet
the benchmark. We note that previously councils have not been required to report on the real
operating expenditure ratio so these results were not published in the 2014 Financial Statements.
An explanation of each indicator and the basis of the calculation are set out in Appendix A. Each
has been calculated in accordance with the requirements set down by the Office of Local
Government. The ratios are a reduced set of benchmarks drawn from those used by TCorp in its
2013 analysis of the Financial Sustainability of the New South Wales Local Government Sector.
7
Reported in the 2013/14 Financial Statements for the respective councils
Morrison Low
Ref: 7054: Fit for the Future – Shared Modelling Report for Gloucester Shire and Great Lakes Councils 10Table 9 Fit for the Future benchmarks 2014
Operating Debt Asset Infrastructure Asset
Own Source
Council Performance Service Maintenance Backlog Renewal
Revenue (%)
(%) (%) (%) (%) (%)
Gloucester Shire
-83 53.3 123* 31 43 43.99
Council
Great Lakes
-3.52 71.84 1.98 100 6 127.2
Council
* The Gloucester Shire Council 2013-14 Financial statement recorded a -101.38% figure with an explanation that as
the Council had made a loss before capital gains in the FY2014 year, they felt that this ratio had become
redundant. The report noted that the council did not receive the FAG prepayment which it was relying on to sustain
its operating profit for the year. If Council had received the budgeted FAG payment this ratio would have been
around 123% which is below the benchmark, however to better Councils operating position, lessening the debt will
free up vital operating funds.
Based on each council’s reporting in their 2014 Financial Statements, Gloucester meets only one
of the Fit for the Future benchmarks while Great Lakes meets all but two at present.
4.1.1 Fit for the Future indicators
While looking at the 2014 Financial Statements provides a historic view of performance Fit for the
Future concentrates of forecast performance. We have undertaken an analysis of both Council’s
current financial statements, projected financial performance and applied a standardised
approach to the calculation of all infrastructure ratios to provide consistency and comparability for
the purposes of this assessment.8
Based on that modelling, Gloucester Shire Council will meet three of the benchmarks over the
period until 2023, two now (Debt Service and Real Operating Expenditure) and with one further
benchmark attained in 2018 (Own Source Revenue). The addition of the SRV satisfies the
infrastructure backlog ratio between 2016 and 2019.
Great Lakes is projected to meet five benchmarks, three now (Own Source, Debt Service and
Real Operating Expenditure) with two more attained during the modelling period (Operating
Performance in 2021 and Asset Maintenance which is met between 2016 and 2020).
The tables below provide a summary of each council’s performance against the benchmarks.
The figures that follow show the trends of the benchmarks over time for each council. The
government has made it clear that the trend of Councils should be improving against the
benchmarks. Where the results for each council’s two scenarios are the same, it is shown as one
line only.
8
The explanation for each is set out in section 4.2
Morrison Low
Ref: 7054: Fit for the Future – Shared Modelling Report for Gloucester Shire and Great Lakes Councils 11Table 10 Gloucester Shire Council performance against Fit for the Future benchmarks
Modelling Outcome Modelling Outcome
Indicator
(SRV)
Operating Performance Does not meet the benchmark Does not meet the benchmark
Meets the benchmark from Meets the benchmark from
Own Source Revenue
2018 2018
Debt Service Cover Meets the benchmark Meets the benchmark
Asset Maintenance Does not meet the benchmark Does not meet the benchmark
Asset Renewal Does not meet the benchmark Meets the benchmark until 2018
9 Meets the benchmark 2016-
Infrastructure Backlog Does not meet the benchmark
2019
Real Operating Expenditure Meets the benchmark Meets the benchmark
Table 11 Great Lakes Council performance against Fit for the Future benchmarks
Modelling Outcome
Indicator
Operating Performance Meets the benchmark from 2021
Own Source Revenue Meets the benchmark
Debt Service Cover Meets the benchmark
Asset Maintenance Does not meet the benchmark
Asset Renewal Meets the benchmark from 2022
10
Infrastructure Backlog Does not meet the benchmark
Real Operating Expenditure Meets the benchmark
9
The forecast of a councils infrastructure backlog is based on using condition 3 as satisfactory
10
The forecast of a councils infrastructure backlog is based on using condition 3 as satisfactory
Morrison Low
Ref: 7054: Fit for the Future – Shared Modelling Report for Gloucester Shire and Great Lakes Councils 1211
Figure 2 Operating performance ratio
Operating Performance
10.0%
0.0%
2015 2016 2017 2018 2019 2020 2021 2022 2023
-10.0%
Great Lakes
-20.0% Gloucester - Base
Gloucester - SRV
-30.0%
-40.0%
-50.0%
12
Figure 3 Own source revenue
Own Source Revenue
90.0%
80.0%
70.0%
60.0%
50.0% Great Lakes
40.0% Gloucester - Base
Gloucester - SRV
30.0%
20.0%
10.0%
0.0%
2015 2016 2017 2018 2019 2020 2021 2022 2023
11
Benchmark is greater than or equal to break-even
12
Benchmark is greater than 60%
Morrison Low
Ref: 7054: Fit for the Future – Shared Modelling Report for Gloucester Shire and Great Lakes Councils 1313
Figure 4 Debt service ratio
Debt Service
14.0%
12.0%
10.0%
8.0% Great Lakes
Gloucester - Base
6.0%
Gloucester - SRV
4.0%
2.0%
0.0%
2015 2016 2017 2018 2019 2020 2021 2022 2023
14
Figure 5 Asset renewal ratio
Building and Infrastructure Asset Renewal
180.0%
160.0%
140.0%
120.0%
100.0% Great Lakes
80.0% Gloucester - Base
Gloucester - SRV
60.0%
40.0%
20.0%
0.0%
2015 2016 2017 2018 2019 2020 2021 2022 2023
13
Benchmark is greater than 0 or less than 20%
14
Benchmark is equal to or greater than 100%
Morrison Low
Ref: 7054: Fit for the Future – Shared Modelling Report for Gloucester Shire and Great Lakes Councils 1415
Figure 6 Infrastructure backlog ratio
Infrastructure Backlog
25.0%
20.0%
15.0%
Great Lakes
Gloucester - Base
10.0% Gloucester - SRV
5.0%
0.0%
2015 2016 2017 2018 2019 2020 2021 2022 2023
16
Figure 7 Asset maintenance ratio
Asset Maintenance Ratio
120.0%
100.0%
80.0%
60.0% Great Lakes
Gloucester Base & SRV
40.0%
20.0%
0.0%
2015 2016 2017 2018 2019 2020 2021 2022 2023
15
Benchmark is less than 2%
16
Benchmark is equal to or greater than 100%
Morrison Low
Ref: 7054: Fit for the Future – Shared Modelling Report for Gloucester Shire and Great Lakes Councils 1517
Figure 8 Real operating expenditure
Real Operating Expenditure per capita
$3,000
$2,500
$2,000
Great Lakes
$1,500
Gloucester - Base
Gloucester - SRV
$1,000
$500
$0
2015 2016 2017 2018 2019 2020 2021 2022 2023
4.2 Meeting the benchmarks
An analysis of what would need to be done in order for each council to satisfy the Fit for the
Future benchmarks has been undertaken. The analysis is against each council’s base case
scenario. The asset based ratios (asset maintenance, asset renewal and infrastructure backlog)
have been considered as has the operating performance ratio. Each aspect has been separated
out in the following sections before being combined into an overall figure which identifies what, if
any, funding gap exists that if satisfied would enable the council to meet the Fit for the Future
benchmarks.
Where such a gap has been identified and should a council choose to pursue a standalone
response to Fit for the Future, then the council will then need to determine how they best address
that gap. We would expect that this would be either through additional revenue, a reduction in
operating expenses or a combination of both.
4.2.1 Operating performance
The operating result of each council (calculated on the same basis as the operating performance
ratio and so excluding capital grants and contributions) has been reviewed and the gap, if any,
between the operating revenue and operating expenses identified below. For simplicity, this is
presented as an average of the years projected in each council’s LTFP.
17
Benchmark is decreasing over time
Morrison Low
Ref: 7054: Fit for the Future – Shared Modelling Report for Gloucester Shire and Great Lakes Councils 16Table 12 Operating performance funding gap
Gap
Council
($000)
Gloucester Shire Council -3,321
Great Lakes Council - 245
4.2.2 Asset maintenance
The maintenance ratio is based in part on the number each council reports as ‘required
maintenance’. However there are no guidelines on how required maintenance is to be calculated
and when the required maintenance figures from across the councils were considered some
significant variations were identified.
A standardised approach was adopted for the purposes of this project in order to provide a
relative comparison of the two councils and for use when estimating the required annual
maintenance for the merged council.
The approach uses a percentage of the current replacement cost as the basis for required
maintenance. The rates for the different asset classes are based on our knowledge and expertise
as well as consideration of ratios of similar councils as benchmark comparisons.
The table below sets out the gap between the required annual maintenance and projected
maintenance. For simplicity, this is presented as an average of the years projected in each
council’s LTFP. Negative figures are highlighted in red and show the annual additional amount a
council, based on our standardised approach, would need to spend on maintenance to satisfy the
asset maintenance ratio.
Table 13 Asset maintenance funding gap
Actual Annual Estimated Required
Gap
Council Maintenance Maintenance
($000)
($000) ($000)
Gloucester Shire Council 2,922 3,934 -1,012
Great Lakes Council 8,648 8,856 - 208
4.2.3 Asset renewal
The asset renewal ratio is based on each council’s assessment of annual depreciation on
buildings and infrastructure and their actual expenditure on building and infrastructure renewals.
If asset depreciation is calculated appropriately then this represents the loss of value of an asset
on an annual basis and a renewal ratio of 100% reflects (at an overall level) restoring that lost
value.
While the calculation of depreciation varies quite significantly across the two councils it is not
possible to simply standardise depreciation in the same way that the required maintenance
number can be. The assessment of depreciation is integral to the financial management of each
council and their LTFP. Any change requires a proper assessment of the assets, condition, lives
Morrison Low
Ref: 7054: Fit for the Future – Shared Modelling Report for Gloucester Shire and Great Lakes Councils 17and values. The assessment of required asset renewals is therefore based on each council’s own
assessment of depreciation and required renewals.
The table below sets out the gap between the required annual renewals and projected renewals
expenditure. Negative figures are highlighted in red and show the annual additional amount a
council (based on our standardised approach) would need to spend on renewal to satisfy the
asset renewal ratio.
We note that Gloucester Shire Council has made an application for an SRV which will help
address renewal expenditure however in order to be cautious the comparison is against Councils
base case.
Table 14 Asset renewal gap
Average predicted Average required
Gap
Council annual renewals annual renewals
($000)
($000) ($000)
Gloucester Shire Council 2,144 4,344 -2,200
Great Lakes Council 11,665 12,063 -399
4.2.4 Calculating the estimated cost to satisfactory
The estimated cost to satisfactory is the key driver of the infrastructure backlog ratio. However,
there are no clear guidelines as to how the cost to satisfactory has to be calculated and as such
the approach varies significantly across NSW. Across the two councils there are different
methodologies for determining the cost to satisfactory.
Given the variation in methodologies it was considered appropriate that for comparative purposes
and for the assessment of the infrastructure backlog of a merged council a standardised
approach should be adopted. The approach is one that has been adopted by a growing number
of NSW councils as it provides a consistent, repeatable methodology based on asset condition.
Both councils have adopted a similar condition rating system based on a 1 – 5 condition rating
where condition 1 is considered to be excellent and condition 5 being poor or very poor condition.
The standardised approach adopts condition 3 as satisfactory. We do acknowledge that some
councils have considered adopting a lower standard as satisfactory and have engaged with their
communities on this. Our approach looks at the value of asset (Current Replacement Cost) in
condition 4 and 5, and what could be done to ensure these assets are brought up to condition 3
(satisfactory). It should be noted the cost to satisfactory is an indicator of asset condition, and as
such the reality of asset renewals is that those assets in condition 4 and 5 when renewed would
be brought up to condition 1 or 2.
The figure below compares the reported backlogs with those calculated using the Morrison Low
methodology. In both cases the infrastructure backlog reduces considerably.
Morrison Low
Ref: 7054: Fit for the Future – Shared Modelling Report for Gloucester Shire and Great Lakes Councils 18Figure 9 Infrastructure backlog recalculated using the standard Morrison Low methodology (2014)
$80
Millions
$70
$60
$50
$40 Reported
Morrison Low methodology
$30
$20
$10
$-
Great Lakes Gloucester
The table below sets out what each council would need to spend on additional renewals (i.e. over
and above maintaining a 100% asset renewal ratio) to reduce the infrastructure backlog ratio to
the benchmark within five years.
Table 15 Cost to bring assets to satisfactory
Total value of Cost to Reduction Per year
18 Target Backlog
Council assets satisfactory Required (5 years)
($000)
($000) ($000) ($000) ($000)
Gloucester
253,210 14,638 3,411 -11,227 -2,245
Shire Council
Great Lakes
909,402 14,596 12,527 -2,068 -414
Council
4.2.5 Annual funding gap
The table below summarises the expenditure required by each council, based on our
standardised approach, in order to meet all three asset based ratios within five years. Once the
infrastructure backlog is brought to the benchmark then the required expenditure in both councils
falls.
We have not included the funding gap related to the operating performance ratio in this table as
that would not present a realistic picture of the required expenditure. Any increase in expenditure
on maintenance or renewals will flow through to affect the operating revenue and expenses of the
council and therefore the Operating Performance Ratio. Additionally, a council may choose to
address the funding gaps identified in Tables 12 – 16 by increasing revenue, shifting funding from
another service or activity, reducing overall costs or a combination of all the above. This will all
affect the other ratio. It is not therefore considered possible to simply add the Operational
18
Current replacement costs (2014)
Morrison Low
Ref: 7054: Fit for the Future – Shared Modelling Report for Gloucester Shire and Great Lakes Councils 19Funding Gap identified in Table 12 and Asset Funding Gap identified in Table 16 below together
into a single figure.
Table 16 Combined asset funding gap
Average Average
funding funding
Asset Infrastructure
Council Renewals required per required per
Maintenance Backlog
annum annum
(5 years) (5 years+)
Gloucester Shire
-1,012 -2,200 -2,245 -5,458 -3,212
Council
Great Lakes Council - 208 - 399 - 414 -1,020 - 607
4.3 Merged council
4.3.1 Description
The merging of the two councils into one council would create a council of roughly twice the
geographic area serving a reasonably distributed population.
To give some sense of scale to the proposed council organisation, set out below are some broad
indicators of the attributes of a new merged council and a comparison to Lismore Council.
19
Table 17 Comparison of proposed merged council and Lismore Council
Great Lakes Gloucester Council Lismore Council
Full time
282 88 363 400
equivalent staff
2 2 2 2
Geographic area 3,376km 2,952km 6,328 km 2,952 km
Population 35,932 5,016 40,948 44,485
Annual
$67.2 million $16.7 million $83.9 million $102 million
expenditure
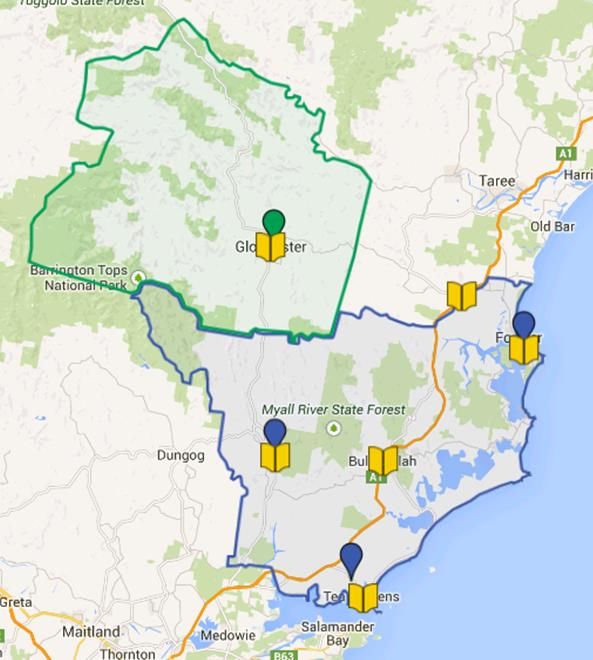
4.3.2 Services
The range of services and facilities provided by any council to its community varies significantly
from place to place. Not only do the types of services vary, but the levels of service will often be
quite different from council to council.
The reasons for these variations are numerous. For many councils the suite of services that they
offer in the present day is a reflection of decisions made by councils past. Those decisions are
generally based on community desires and needs, funding availability or strategic business
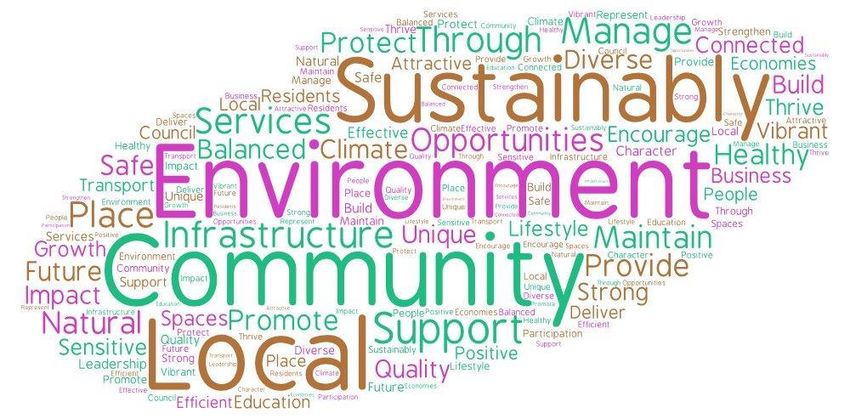
choices. Figure 10 highlights the locations of some key council services including council offices,
libraries and swimming pools.
19
OLG Comparative Performance Data 2012-13
Morrison Low
Ref: 7054: Fit for the Future – Shared Modelling Report for Gloucester Shire and Great Lakes Councils 20Figure 10 Key services and facilities of the councils
Council Offices
Public Libraries
Swimming Pools
Regardless of the original rationale for service types, levels and delivery decisions, councils need
to continue to make regular and structured revisions to their service portfolios in order to meet
emerging or changing community needs, capacity to pay issues or regulatory change.
The two councils are reflective of the broader local government industry and exhibit many
variations on the types and levels of service that they offer to their communities despite their
relative proximity. There are obviously cost implications for the councils providing different
services and levels of service.
There are a range of examples where services vary across council borders and those variations
can be in the form of:
providing a particular service or not doing so
differing methods of delivering services (in house, outsourced, collaborative)
Morrison Low
Ref: 7054: Fit for the Future – Shared Modelling Report for Gloucester Shire and Great Lakes Councils 21 variety in the levels of service delivered (frequency, standard)
pricing.
The purpose of the figures above is to highlight the different challenge that a merged council will
be faced with in regards to the provision and the location of services and facilities. Having
responsibility for a larger area without the existing internal boundaries will require a different
approach and likely lead to changes in services and service delivery.
Establishing a uniform, or at least consistent, service offering through the mechanisms of service
standard setting, pricing and delivery will be a challenging exercise for any merged council
however it does provide opportunities for service review and re-evaluation. Often in a merged
council the desire to ensure an equitable and fair service across the entire local government area
can result in an immediate and sometimes dramatic increase in services, services levels and
therefore costs.
In assessing the advantages and disadvantages of a merger of the two councils the assumption
has been made that current service levels will continue until such time as the merged council
makes a decision otherwise.
4.3.3 Social, environmental and economic
The following is a summary of a detailed communities profile and communities of interest study
that is set out in Appendix E.
This desktop review of the communities of the two councils has been undertaken in order to
understand the current demographic composition of the area, the similarities and differences
between the council areas, and the interrelationships and communities of interest that currently
exist within the area.
Communities of interest and geographic cohesion are considered essential considerations for any
boundary adjustment process (Section 263 of the Local Government Act). The two key reference
points for this review is ABS Census Data taken from the Councils’ Profile ID websites, along with
the analysis contained in the New South Wales Local Government Areas: Similarities and
Differences, A report for the Independent Local Government Review Panel report20.
The Local Government Areas of Gloucester and Great Lakes have some similar features, and
some differences, many of which reflect the different natures of the areas, Gloucester being a
smaller rural shire, with Great Lakes a larger and more urbanised area.
Gloucester has a relatively more socioeconomically advantaged community, which is reflected in
a higher SEIFA score, as well as higher home purchasing and labour force participation and
lower unemployment. The population of Gloucester is predicted to decrease by 3.35 in the period
to 2013 while the Great Lakes population is predicted to increase by 7.7%
Studies of cross-border movements do not reveal high levels of interdependency between
Gloucester and Great Lakes, with Great Lakes linked more closely with Greater Taree.
Gloucester has higher employment containment, both in terms of place of residence of local
workers, and place of work of local residents.
Both areas have similar age profiles, with low adult retention, high proportion of elderly people
and a high ratio of children to adults. There is similarity in household types, with similar
20
National Institute of Economic and Industry Research, March 2013
Morrison Low
Ref: 7054: Fit for the Future – Shared Modelling Report for Gloucester Shire and Great Lakes Councils 22You can also read