Glycan microarray of Globo H and related structures for quantitative analysis of breast cancer
←
→
Page content transcription
If your browser does not render page correctly, please read the page content below

Glycan microarray of Globo H and related structures
for quantitative analysis of breast cancer
Cheng-Chi Wang*†, Yen-Lin Huang*†, Chien-Tai Ren*, Chin-Wei Lin*, Jung-Tung Hung*, Jyh-Cherng Yu‡, Alice L. Yu*§,
Chung-Yi Wu*§, and Chi-Huey Wong*§
*The Genomics Research Center, Academia Sinica, Taipei, Taiwan; †Institute of Biochemical Science, National Taiwan University, Taipei, Taiwan;
and ‡Tri-Service General Hospital, Taipei, Taiwan

Contributed by Chi-Huey Wong, May 23, 2008 (sent for review January 1, 2008)

Cancer-associated carbohydrate antigens are often found on the
surface of cancer cells. Understanding their roles in cancer pro-
gression will lead to the development of new therapeutics and
high-sensitivity diagnostics for cancers. Globo H is a member of this
family, which is highly expressed on breast cancer cells. Here, we
report the development of a glycan microarray of Globo H and its
analogs for measurement of the dissociation constants on surface
(KD,surf) with three different monoclonal antibodies (VK-9, Mbr1,
and anti-SSEA-3), to deduce their binding specificity. The glycan
microarray was also used to detect the amount of antibodies
present in the plasma of breast cancer patients and normal blood

                                                                                                                                                                                  BIOCHEMISTRY
donors. It was shown that the amount of antibodies against Globo
H from breast cancer patients were significantly higher than
normal blood donors, providing a new tool for possible breast
cancer diagnosis. Compared with the traditional ELISA method, this
array method required only atto-mole amounts of materials and is
more effective and more sensitive (5 orders of magnitude). The
glycan microarray thus provides a new platform for use to monitor
the immune response to carbohydrate epitopes after vaccine
therapy or during the course of cancer progression.

array 兩 diagnosis

G     lobo H is a hexasaccharide, which is a member of a family
      of antigenic carbohydrates that are highly expressed on a
various types of cancers, especially cancers of breast, prostate
and lung (1–4). It is expressed on the cancer cell surface as a
glycolipid and possibly as a glycoprotein (5, 6). Furthermore, it
has been established that the serum of breast cancer patients
contains high levels of antibodies against the Globo H epitope,
and this epitope is also targeted by the monoclonal antibodies                 Fig. 1.   Chemical structure of Globo H and abbreviations of Globo H analogs.
Mbr1 (5, 7–8) and VK9 (9) in immunohistochemistry studies.
Although certain normal tissues also react with Mbr1, including
normal breast, pancreas, small bowel, and prostate tissue (2, 6,               (i) Are Globo H and Gb5 differentially expressed in disease stages?
10), the antigen in these tissues is predominantly localized at the            (ii) Can the glycan array be used for the quantitative and high-
secretary borders where access to the immune system is re-                     sensitivity detection of anti-Globo H antibody present in the serum
stricted. These two findings provide the rationale for evaluating              as an indication of cancer? (iii) Can the array be used to measure
human antibody against Globo H as a diagnosis for breast cancer.               the activity of fucosyltransferase in breast cancer cells at different
   Glycan microarray is a very powerful tool for glycobiological               stages, to screen inhibitors of the enzyme and to monitor the
study (11–36). It may effectively mimic the presentation of glycans            immune response to the Globo H-based vaccine?
on the cell membrane to exhibit multivalent interactions with
                                                                               Results and Discussion
receptors with high affinity and specificity (37). In addition, only a
very small amount of material is required for arraying. Thus, the              Specificities of Antibodies. The Globo H and its analogs (Fig. 1)
microarray may provide a more appropriate and more sensitive                   were prepared according to the one-pot programmable protocol
system for studying protein–carbohydrate interactions than the                 (38) and were covalently attached onto NHS-coated glass slides
traditional solution-phase ELISA analysis. Recently, our group has
used Globo H and its truncated analog microarrays to profile the
                                                                               Author contributions: A.L.Y., C.-Y.W., and C.-H.W. designed research; C.-C.W., Y.-L.H.,
binding specificity of its monoclonal and polyclonal antibodies in a           C.-T.R., C.-W.L., J.-T.H., and J.-C.Y. performed research; C.-C.W., Y.-L.H., J.-T.H., and A.L.Y.
qualitative manner (38). In that preliminary study, we found that              analyzed data; and C.-C.W., A.L.Y., C.-Y.W., and C.-H.W. wrote the paper.
the polyclonal antibodies from a breast cancer patient can bind both           The authors declare no conflict of interest.
Globo H and its truncated analog without fucose (Gb5), whereas                 §To  whom correspondence may be addressed. E-mail: ayu@gate.sinica.edu.tw,
Mbr1 is specific for Globo H (38). The binding specificity studies of           cyiwu@gate.sinica.edu.tw, or chwong@gate.sinica.edu.tw.
monoclonal antibodies and human polyclonal antibodies associated               This article contains supporting information online at www.pnas.org/cgi/content/full/
with Globo H have prompted us to further investigate the following             0804923105/DCSupplemental.
questions:                                                                     © 2008 by The National Academy of Sciences of the USA

www.pnas.org兾cgi兾doi兾10.1073兾pnas.0804923105                                                   PNAS 兩 August 19, 2008 兩 vol. 105 兩 no. 33 兩 11661–11666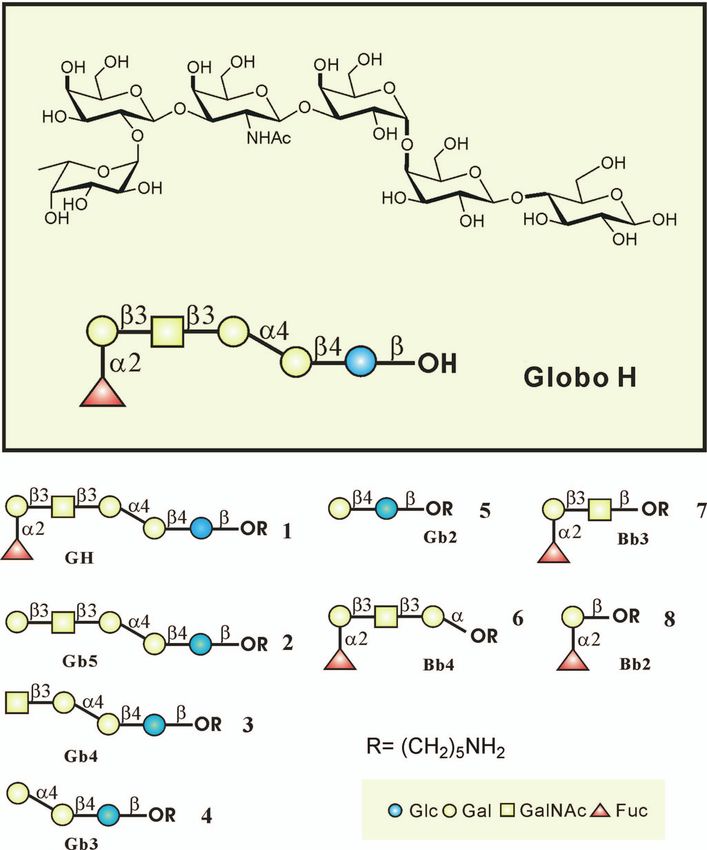
Table 1. Surface dissociation constants (KD,surf) of antibody VK9
and Globo H on microarray
Printing concentration
Globo H, M Fmax KD,surf, nM
100 64,018 1.198
80 61,517 1.152
50 61,988 0.9587
40 54,623 0.8694
20 57,157 0.9561
10 46,473 0.8951
5 41,029 1.004
Shown are KD,surf values (nM) and the corresponding fluorescence intinsi-
ties (Fmax) under different printing concentrations.
fluorophore-tagged secondary antibody against its primary an-
tibody. After washing, scanning the slide for fluorescence yielded
images as shown in Fig. 2, which reflect the extent of binding of
the antibody to printed oligosaccharides. VK9 and Mbr1 recog-
nize Globo H and Bb4 specifically (Fig. 2 A and B), indicating
that both IgG and IgM of anti-Globo H antibodies (5, 7–9)
recognize the outer tetrasaccharide of Globo H, and the pres-
ence of the fucose moiety is required for binding, consistent with
previous solution phase assays (9). The other antibody, anti-
mouse/human SSEA-3 (stage-specific embryonic antigen-3) rec-
ognizes Gb5 (SSEA-3 antigen) without any cross-reactivity to
other Globo H analogs.
Determination of Surface Dissociation Constants (KD,surf). Both pro-
Fig. 2. Binding of monoclonal antibodies to Globo H and its analogues. (A)
tein and carbohydrate microarrays have been used to investigate the
Slide image obtained from fluorescence scan after antibody incubation assay kinetics and thermodynamics of the interactions between biomol-
with VK-9. The grid contain sugars 1–8 printed at an 80 M concentration. (B ecules in solution phase and solid phase (40–42). To determine the
and C) Slide images obtained by assay with MBr1 (B) and anti-SSEA-3 mono- dissociation constants of Globo H and truncated analogs on surface
clonal antibody (C). interacting with antibodies in a multivalent manner, we adopted the
direct measurement method reported by our group in ref. 42, using
different concentrations of antibodies and printed sugars. The
based on the standard microarray robotic printing technology, as Langmuir isotherm was then used for analyzing the binding curves
reported in refs. 38 and 39. In addition, two more glycans (lactose to generate the dissociation constants on surface (KD,surf). At the
and Gb3) were included to give a complete array of Globo H and equilibrium conditions during incubation, the mean fluorescence of
truncated structures. These glycans were printed on the glass the replicate spots (Fobs) can be described by
slide by taking an aliquot from a stock solution of sugar at a fixed
concentration (80 M). The array was designed in a 16-row slide Fobs ⫽ Fmax[P]/(KD,sur f ⫹ [P]) [1]
format for development of high-throughput screening. We
where Fmax is the maximum fluorescence intensity, a measure of the
printed two rows for every glycan (their structure are shown in amount of active carbohydrate on the surface, [P] is the total
Fig. 1), and the array was used for binding experiments with antibody concentration, and KD,surf is the equilibrium dissociation
Mbr1 (a mouse IgM anti-Globo H monoclonal antibody), VK9 constant for surface carbohydrate and the antibody. The anti-Globo
(a mouse IgG anti-Globo H monoclonal antibody), and anti- H antibody VK9 was diluted to different concentrations from 3.3 to
mouse/human SSEA-3 (stage-specific embryonic antigen-3) 0.08 nM and incubated in each array with different concentrations
monoclonal antibody. Briefly, these primary antibodies were of printed sugars ranging from 100 M to 0.01 M (100, 80, 50, 40,
incubated in a well on the slide, followed by incubation with a 20, 10, 5, 1, 0.1, and 0.01 M). This was followed by incubation with
the Cy3-labeled goat anti-mouse IgG secondary antibody. After
washing, the slide was scanned to measure the fluorescence inten-
sities to generate the saturated curve for dissociation constant
(KD,surf) determination. We found that the binding curve reached
Table 2. KD,surf (nM) values of different antibodies and different
Globo H analogs
KD, surf (nM) ⫾ SD(nM)
Tetrasaccharide, gal-globoside,
Antibodies Globo H 6 2
VK9 1 ⫾ 0.116 2.192 ⫾ 0.567 —
Fig. 3. Binding curves for Globo H printed at different concentrations (100, Mbr1 0.56 ⫾ 0.129 4.287 ⫾ 0.59 —
80, 50, 40, 20, 10, and 5 M) are shown. The curves were obtained by using anti- SSEA-3 — — 15.723 ⫾ 3.896
Cy3-labeled goat anti mouse IgG secondary antibodies.
11662 兩 www.pnas.org兾cgi兾doi兾10.1073兾pnas.0804923105 Wang et al.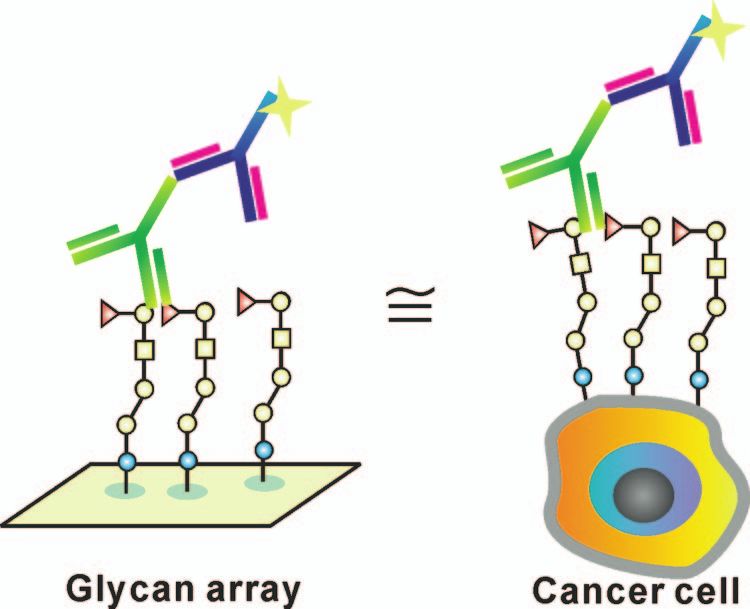
lower printing concentrations did not converge to the binding
curves generated by the Langmuir isotherm. This result illustrates
that at the printing concentrations ⬍5 M, the sugar density on
surface is too low to exhibit a multivalent interaction.
Using the same method, the KD,surf values were measured for the
truncated Globo H analogs interacting with antibodies [see the
supporting information (SI), Fig. 2, and Table 2]. The relative
binding specificity of both VK9 and Mbr1 for the sugar epitopes was
Globo H ⬎ tetrasacchride Bb4. In addition, we observed that the
relative binding affinity of antibodies for Globo H was Mbr1⬎ VK9
but that for Bb4 was in an opposite order. This study indicates that
the glycan microarray is a good mimic of cell surface expressing
multiple glycans and is thus useful for the study of multivalent
interaction (Fig. 4).
Fig. 4. Glycan array is a mimic of cell surface expressing glycans for study of Detection of Serum Antibody Against Globo H. The binding intensities
multivalent interaction.
in a range of Globo H and tetrasaccharide Bb4 concentration
(5–100 M) for the two antibodies (VK-9 and Mbr1), as measured
saturation at 5 M printing concentration. To determine the by the Cy3-labeled secondary antibody were relatively high and
dissociation constant on surface, we plotted VK9 concentrations similar, whereas the binding to other truncated sequences is very
against the fluorescence intensity at different concentrations of weak. This result provides a rationale for development of a glycan
printed sugar. At the printing concentrations from 100 M to 5 M, microarray to detect the presence of anti-Globo H antibody in the
serum of patients. Because we only loaded 0.7 nL to each spot, the
BIOCHEMISTRY
the KD,surf values determined were narrowly distributed from the
individual curves (Fig. 3 and Table 1). However, if the printing minimum amount of sugar required for detection was 10⫺15 mol per
concentration was ⬍5 M, the fluorescence intensity of each spot spot if a 50 M solution is used (Table 2 and Fig. 3). For the purpose
was too weak to be detected with a significant signal-to-noise (S/N) of detection only, the concentration can further be reduced to 10⫺18
ratio (data not shown). In addition, the intensities of those spots at mol per spot, as shown in the study in ref. 42. This is indeed a highly
Fig. 5. Ratios of IgG levels against Globo H analogs in sera from breast cancer Fig. 6. Ratios of IgM levels against Globo H analogs in sera from breast
patients and normal blood donors. The relative fluorescence ratios were cancer patients and normal blood donors. The relative fluorescence ratios
obtained from fluorescence intensity of Globo H or Globo H analogs divided were obtained from fluorescence intensity of Globo H or Globo H analogs/
by fluorescence intensity of Gb5. The mean of Globo H/Gb5 IgG ratios was fluorescence intensity of Gb5. The mean of Globo H/Gb5 IgM ratios was
significantly higher in sera of breast cancer patients. significantly higher in sera of breast cancer patients.
Wang et al. PNAS 兩 August 19, 2008 兩 vol. 105 兩 no. 33 兩 11663Table 3. IgG ratios of Globo H analogs to Gb5 from breast cancer patients (n ⴝ 58) and healthy individuals (n ⴝ 47)
GH/Gb5 Bb4/Gb5 Bb3/Gb5 Bb2/Gb5
IgG ratio,
% Healthy Cancer Healthy Cancer Healthy Cancer Healthy Cancer
Mean 26.92 58.31 11.91 17.84 15.22 22.54 78.02 120.8
SD 18.49 31.14 20.54 19.60 23.12 23.22 63.63 92.26
P P ⬍ 0.0001*** 0.1360 (ns) 0.1106 (ns) 0.0063**
***, P ⬍ 0.001, extremely significant; **, P ⫽ 0.001– 0.01, very significant; ns, P ⬍ 0.05, not significant.
sensitive method and the sensitivity could be further improved with method was lower than the ELISA method. Therefore, we decided
the use of more effective fluorescent probes. to compare our glycan microarray system with routine ELISA
again.
Glycan Microarray of Globo H and Its Truncated Analogs as a Tool for Mice were immunized with KLH conjugated Globo H once
Breast Cancer Diagnosis. Breast cancer is the most common malig- weekly for 3 weeks, and sera were collected 10 days after third
nancy in many parts of the world for women, with an increase in immunization. Anti-Globo H antibodies were tested at serial
mortality of ⬇33% in the past 10 years (43). Development of a rapid dilutions from 30- to 1,920-fold, on the Globo H microarray chip
and reliable method for use to diagnose breast cancer at an early (3.5 ⫻ 10⫺14 mol per spot) or on Globo H coated ELISA plate
stage should lead to the reduction of mortality rate. To take (1.28 ⫻ 10⫺10 mol per well). A significant rise in anti-Globo H
advantage of our highly sensitive Globo H microarray (38), we specific IgG antibody was observed in Globo H-KLH treated
examined the plasma samples of 58 breast cancer patients and 47 mice compared with the preimmune sera. As shown in Fig. 7 and
healthy blood donors for antibodies that bound to Globo H and its Table 5, using glycan microarray, the intensity of positive signal
truncated fragments on glycan microarrays. Microarrays of Globo (postimmune–preimmune) for anti-Globo H was 374.7 ⫾ 87.8-
H and its truncated fragments were treated with the plasma of fold over the background signal at 1:30 serum dilution and 3.2 ⫾
patients or healthy donors, and the bound antibodies, after washing, 1.0-fold at 1:1,920 dilution. By ELISA method, the signal was
were detected with Cy3-labeled goat anti-human IgM or IgG only 4.0 ⫾ 1.6-fold at 1: 30 dilution and dropped to near
secondary antibody. As shown in Figs. 5 and 6, the presence of background level at 1:240 dilution (Fig. 7). Additionally, given
antibodies that bound to Gb5 was high in patients and normal that the working concentration of Globo H in array is 4 orders
donors, but the number of antibodies bound to Globo H was less in of magnitude lower than ELISA, the overall sensitivity of Globo
normal donors when compared with breast cancer patients. The
H microarray is 5 orders of magnitude higher than the routine
levels of antibodies bound to other glycans were much lower than
ELISA. As a result, minimal amounts of serum samples, reagents
Globo H or Gb5 in patients or healthy donors. The fluorescence
and Globo H antigens were necessary for glyan microarray
data reflecting the antibody reactivity to each glycan was normal-
analysis compared with ELISA. Based on these findings, we
ized to Gb5 for each sample, and the relative fluorescence inten-
believe that the glycan microarray method may be developed as
sities for IgG and IgM antibodies from patients and normal subjects
are presented in Fig. 5 and Fig. 6, respectively. It was evident that a sensitive rapid device for screening of breast cancer and other
both the levels of IgG and IgM against Globo H were significantly applications.
higher in breast cancer patients than in normal individuals (P ⬍ Conclusion
0.0001) (Table 3 and 4). However, the normalized antibody levels
for Bb4 displayed no significant differences between patients and In this study, we have shown that the glycan microarray can be
normal donors and those for Bb3 and Bb2 showed a trend of higher used for quantitative analysis of the breast cancer-associated
levels in cancer patients with borderline significance (P ⫽ 0.1106 carbohydrate Globo H interacting with monoclonal antibodies
and 0.0063 for IgG; P ⫽ 0.0043 and 0.0105 for IgM, respectively) Mbr1 and VK-9 and the anti-Globo H polyclonal antibodies
(Tables 3 and 4). It is noted that the background intensities of Globo present in the serum of breast cancer patients with the sensitivity
H binding from normal subject could be the result of nonselective down to the atto-mol level. Our results showed a very significant
binding. difference in anti-Globo H levels between patient and normal
plasma, suggesting that the Globo H microarray may be devel-
Monitoring the Immune Response to Globo H Vaccine by Using Globo oped as a new method for breast cancer diagnosis. In other
H Microarray. Traditionally, the immune response to carbohydrate research (45), we found the level of Globo H on the breast cancer
based vaccine was evaluated by ELISA method. Recently, Bovin stem cells is relatively low as stained with the monoclonal
and coworkers (44) compared carbohydrate microarray and ELISA antibody and increases when the disease progresses. We also
methods for the assessment of carbohydrate–protein interaction. demonstrated the superiority of our glycan microarray over
They used biotinylated glycoconjugates attached to streptavidin conventional ELISA for evaluation of immune responses to
coated on gold as glycan microarray and 96-well plates coated with carbohydrates, which thereby minimizing the amount of serum
sugar-polyacrylamide (Sug-PAA) for the ELISA assy. In their and carbohydrate required for the assay. Furthermore, this
comparative assays, they found that the sensitivity of the array highly sensitive glycan microarray may offer a new platform for
Table 4. IgM ratios of Globo H analogs to Gb5 from breast cancer patients (n ⴝ 57) and healthy individuals (n ⴝ 47)
GH/Gb5 Bb4/Gb5 Bb3/Gb5 Bb2/Gb5
IgM ratio,
% Healthy Cancer Healthy Cancer Healthy Cancer Healthy Cancer
Mean 27.82 53.98 15.73 22.74 15.36 40.51 16.19 30.36
SD 23.42 35.41 21.60 23.98 23.30 59.76 18.83 35.44
P P ⬍ 0.0001*** 0.1259* 0.0043** 0.0105*
***, P ⬍ 0.001, extremely significant; **, P ⫽ 0.001– 0.01, very significant; *, P ⫽ 0.01– 0.05, significant.
11664 兩 www.pnas.org兾cgi兾doi兾10.1073兾pnas.0804923105 Wang et al.Table 5. The comparison of sensitivity of glycan microarray
and ELISA
Increase fold of signal
Dilution Glycan microarray ELISA
30 374.7 ⫾ 87.83 4.01 ⫾ 1.58
120 188.4 ⫾ 78.93 1.92 ⫾ 0.75
240 102.2 ⫾ 44.21 1.08 ⫾ 0.48
480 44.86 ⫾ 17.05 0.20 ⫾ 0.10
960 12.13 ⫾ 4.08 0.30 ⫾ 0.14
Fig. 7. The comparison of glycan microarray and ELISA for mornitoring 1,920 3.203 ⫾ 1.048 ND
anti-Globo H response. Sera from immunized mice were serially diluted and
analyzed for anti-Globo H specific IgG antibody on glycan microarray and Glycan microarray showed much higher sensitivity than ELISA. The increase
ELISA plates. The fold level of signal over background was calculated as (mean fold of signal defined as (signal intensity of post-immune ⫺ pre-immune)/
of fluorescence of postserum ⫺ preserum)/background intensity in glycan background intensity. Values are mean ⫾ SEM. ND, not detectable.
micorarray or (OD value of postserum ⫺ preserum)/background in ELISA. The
antibody levels were detectable up to 1:1,920 dilution method (3.2 ⫾ 1.0-fold
of background signal), but only 1:240 dilution in ELISA (1.08 ⫾ 0.48-fold of Microarray Analysis of Cancer Patient Plasma. The plasma samples from breast
background OD). Values shown were mean ⫾ SD of four mice. cancer patients and healthy individuals were diluted 1:20 with 0.05% Tween
20/3% BSA/PBS buffer (pH 7.4), and applied to the grids on the Globo H analogs
microarrays and then incubated in a humidifying chamber with shaking for 1 h.
the analysis of fucosyltransferase activity and identification of Then the slides were washed three times each with 0.05% Tween 20/PBS buffer
fucosyltransferase inhibitors (21) as possible therapeutics. (pH 7.4), PBS buffer (pH 7.4), and water. Next, Cy3-conjugated goat anti-human
IgM or IgG antibody was added to the slide as described above and incubated in
a humidifying chamber incubation with shaking under a coverlid for 1 h. The slide
Materials and Methods
BIOCHEMISTRY
was washed three times each with 0.05% Tween20/PBS buffer (pH 7.4), PBS buffer
General. NHS-coated glass slides were purchased from Nexterion H slide (SCHOTT (pH7.4), and H2O and dried. The slide was scanned at 532 nm (for Cy3-conjugated
North America). Primary antibodies used were mouse anti-Globo H monoclonal secondary antibody) with a microarray fluorescence chip reader (ArrayWorx
antibodies Mbr1 (IgM; Alexis Biochemicals), VK-9 [IgG; a gift from Philip Living- microarray reader).
ston (Memorial Sloan-Kettering Cancer Center, New York)], and A488 anti-
mouse/human SSEA-3 (stage-specific embryonic antigen-3) (eBioscience). The
Immunization. Groups of three mice (6-week-old female C57BL/6 mice; Bio-
secondary antibodies used were Cy3-conjuagted Goat anti-mouse IgG, goat
LASCO) were immunized s.c. with Globo H-KLH (Optimer) once weekly for 3
anti-mouse IgM, goat anti-human IgG, and goat anti-human IgM (Jackson Im- weeks. Each vaccination contained 0.6 g of Globo H with 2 g of ␣-galactosyl-
munoResearch). Human plasma samples from healthy individuals and caner ceramide as an adjuvant. Control mice were injected with PBS. The mouse sera
patients were obtained from the Genomics Research Center; Academia Sinica; were obtained before 1st immunization and 10 days after the third immuniza-
and the Tri-Service General Hospital, Taipei, Taiwan, respectively. Samples were tion. The serological responses were analyzed by glycan microarray with the same
fully encoded to protect patient confidentiality and were used under a protocol method as described for human plasma except that Cy3-conjugated goat anti-
approved by the Institutional Review Board of Human Subjects Research Ethics mouse IgG antibody was used as a secondary antibody. 0.2 g of Globo H– cer-
Committee of Academia Sinica, Taipei, Taiwan. Globo H and its truncated analogs amide in 100 l of carbonate bicarbonate buffer (pH 10) were coated in 96-well
were synthesized as in ref. 38. plate (NUNC) at 4°C for overnight, washed with PBS, and blocked with 3% BSA for
30 min at room temperature. Serial dilutions of mice sera were added into each
Glycan Microarray Fabrication. Microarrays were printed (BioDot; Cartesian well and incubated for 1 h at room temperature, followed by washing with
Technologies) by robotic pin (SMP3; TeleChem International) deposition of ⬇0.7 Dulbecco’s phosphate buffered saline (DPBST) and 0.05% Tween 20. Goat anti-
nL of various concentrations of amine-containing glycans in printing buffer [300 mouse IgG-AP (1:200, Southern Biotech.) was added and incubated for 45 min at
mM phosphate buffer (pH 8.5), containing 0.005% Tween-20] from a 96-well room temperature. The plates were washed with PBST five times and then
microtiter plate onto NHS-coated glass slides. The slides for Globo H analogs were incubated with an alkaline phosphates substrate, p-nitrophenyl phosphate
spotted with solutions of Globo H analogs 1–8 with concentrations 50 ⌴ every (Sigma), for 8 min at 37°C. After incubation, the reaction was stopped by adding
two rows for one glycan from bottom to top with 15 replicates horizontally 3 M NaOH, and the plates were read at 405 nm on the ELISA reader (SpectraMax;
placed in each subarray, and each slide was designed for 16 grids for further Molecular Devices).
incubation experiments. Printed slides were allowed to react in an atmosphere of
80% humidity for an hour followed by desiccation overnight. These slides were Data Analysis. The software GenePix Pro (Axon Instruments) was used for the
designed for 16 grids in one slides, and stored at room temperature in a desiccator fluorescence analysis of the extracted data. The local background was sub-
until use. Before the binding assay, these slides were blocked with ethanolamine tracted from the signal at each antibody spot. The spots with obvious defects,
[50 mM ethanolamine in 50 mM borate buffer (pH 9.2)] and then washed with no detectable signal, or a net fluorescence of ⬍100 were removed from the
water and PBS buffer (pH 7.4) twice. analysis. The ‘‘medians of ratios’’ from replicate spots were averaged in the
same array.
Antibody Binding Assay. Mbr1, a mouse IgM anti-Globo H monoclonal antibody, To determine the KD,surf value, the equilibrium binding data were analyzed by
VK-9, a mouse IgG anti-Globo H monoclonal antibody, or A488 anti-mouse/ fitting the data to the appropriate equation (1), assuming that ligands bound to
human SSEA-3 were prepared in 0.05% Tween 20/PBS buffer (pH 7.4) and added one or two independent sites, using the commercial nonlinear regression pro-
to cover the grid with application of a coverlip. After incubation in a humidifying gram GradPad PRISM (GraphPad). To obtain the relative binding intensities of
chamber with shaking for 1 h, the slides were washed three times each with Globo H analogs in human plasma, we used the binding intensity to Bg5 as 100%,
0.05% Tween 20/PBS buffer (pH 7.4), PBS buffer (pH 7.4), and water. Next, and normalized the relative binding intensities of Globo H analogs in each plasma
Cy3-conjugated goat anti-mouse IgM (for MBr1) or IgG (for VK-9) antibody was sample. For example, the ratio of GH/Gb5 in sera was calculated by dividing mean
added to the slide and incubated in a humidifying chamber with shaking under of Globo H replicates by mean of Gb5 replicates. Finally, the statistical analysis of
cover lip for 1 h. The slide was washed three times each with 0.05% Tween20/PBS IgG or IgM levels in breast cancer patients and normal individuals was performed
buffer (pH 7.4), PBS buffer (pH 7.4), and H2O and dried. The slide was scanned at with an unpaired t test, using the program GraphPad Prism (GraphPad).
532 nm (for Cy3-conjugated secondary antibody) and 488 nm (for A488 anti-
SSEA-3 antigen antibody) with a microarray fluorescence chip reader (ArrayWorx ACKNOWLEDGMENTS. We thank Ms. Pei-Lan Hsu, a registered nurse in the
microarray reader). management of clinical samples. This work was supported by Academia Sinica.
1. Kannagi R, et al. (1983) New globo series glycospingolipids in human tetraocarcinoma 2. Zhang SL, et al. (1997) Selection of tumor antigens as targets for immune
reactive with the monoclonal-antibody directed to a developmentally regulated an- attack using immunohistochemistry. 1. Focus on gangliosides. Int J Cancer 73:
tigen, stage-specific embryonic antigen-3. J Biol Chem 258:8934 – 8942. 42– 49.
Wang et al. PNAS 兩 August 19, 2008 兩 vol. 105 兩 no. 33 兩 116653. Hakomori S, Zhang YM (1997) Glycosphingolipid antigens and cancer therapy. Chem Biol 25. Bochner BS, et al. (2005) Glycan array screening reveals a candidate ligand for Siglect-8.
4:97–104. J Biol Chem 280:4307– 4312.
4. Dube DH, Bertozzi CR (2005) Glycans in cancer and inflammation. Potential for ther- 26. Calarese DA, et al. (2005) Dissection of the carbohydrate specificity of the broadly
apeutics and diagnostics. Nat Rev Drug Discov 4:477– 488. neutralizing anti-HIV-1 antibody 2G12. Proc Natl Acad Sci USA 102:13372–13377.
5. Menard S, Tagliabue E, Canevari S, Fossati G, Colnaghi MI (l983) Generation of 27. Manimala JC, Roach TA, Li Z, Gildersleeve JC (2006) High-Throughput carbohydrate
monoclonal-antibodies reacting with normal and cancer-cells of human-breast. Cancer microarray analysis of 24 lectins. Angew Chem Int Ed 45:3507–3610.
Res 43:1295–1300. 28. Dotan N, Altstock RT, Schwarz M, Dukler A (2006) Anti-glycan antibodies as biomarkers
6. Livingston PO (l995) Augmenting the immunogenicity of carbohydrate tumor anti- for diagnosis and prognosis. Lupus 15:442– 450.
gens. Cancer Biol 6:357–366. 29. Lee JC, Wu CY, Apon JV, Siuzdak G, Wong CH (2006) Reactivity-based one-pot synthesis
7. Canevari S, Fossati G, Balsari A, Sonnino S, Colnaghi MI Immunochemical analysis
of the tumor-associated antigen N3 minor octasaccharide for the development of a
of the determinant recognized by a monoclonal-antibody (Mbr1) which
photo cleavable DIOS-MS sugar array. Angew Chem Int Ed 45:2753–2757.
specifically binds to human mammary epithelial-cells. Cancer Res 43:1301–1305, 1983.
30. Lawrie CH, et al. (2006) Cancer-associated carbohydrate identification in Hodgkin’s
8. Bremer EG, et al. (1984) Characterization of a glycosphinolipid antigen defined by the
lymphotna by carbohydrate array profiling. Int J Cancer 118:3161–3166.
monoclonal-antibody Mbr1 expressed in normal and neoplastic epithelial-cells of
31. Paulson JC, Blixt O, Collins BE (2006) Nat Chem Biol 2:238 –248.
human mammary-gland. J Biol Chem 259:14773–14777.
32. Stevens J, et al. (2006) Structure and receptor specificity of the hemagglutinin from an
9. Kudryashov V, et al. (1998) Characterization of a mouse monoclonal IgG3 antibody to
the tumor-associated globo H structure produced by immunization with a synthetic H5N1 influenza virus. Science 312:404 – 410.
glycoconjugate. Glycoconjugate J 15:243–249. 33. Stevens J, Blixt O, Paulson JC, Wilson IA (2006) Glycan microarray technologies: Tools
10. Zhang S, et al. (1998) Expression of potential target antigens for immunotherapy on to survey host specificity of influenza viruses. Nat Rev Microbiol 4:857– 864.
primary and metastatic prostate cancers. Clin Cancer Res 4:295–302. 34. Stevens J, et al. (2006) Glycan microarray analysis of the hemagglutinins from modern
11. Park S, Shin I (2002) Fabrication of carbohydrate chips for studying protein– and pandemic influenza viruses reveals different receptor specificities. J Mol Biol
carbohydrate interactions. Angew Chem Int Ed 41:3180 –3182. 355:1143–1155.
12. Houseman BT, Mrksich M (2002) Carbohydrate arrays for the evaluation of protein 35. Manimala JC, Roach TA, Li ZT, Gildersleeve JC High-throughput carbohydrate microar-
binding and enzymatic modification. Chem Biol 9:443– 454. ray profiling of 27 antibodies demonstrates widespread specificity problems. Glycobi-
13. Fazio F, Bryan MC, Blixt O, Paulson JC, Wong CH (2002) Synthesis of sugar arrays in ology 17:17C–23C, 2007.
microtiter plate. J Am Chem Soc 124:14397–14402. 36. Ratner DM, Seeberger PH (2007) Carbohydrate microarrays as tools in HIV glycobiol-
14. Bryan MC, et al. (2002) Saccharide display on microtiter plates. Chem Biol 9:713–720. ogy. Curr Pharm Des 13:173–183.
15. Fukui S, Feizi T, Galustian C, Lawson AM, Chai W (2002) Oligosaccharide microarrays for 37. Mammen M, Choi SK, Whitesides GM (1998) Polyvalent interactions in biological
high-throughput detection and specificity assignments of carbohydrate–protein in- systems: Implications for design and use of multivalent ligands and inhibitors. Angew
teractions. Nat Biotechnol 20:1011–1017. Chem Int Ed 37:2755–2794.
16. Wang DN, Liu SY, Trummer BJ, Deng C, Wang AL (2002) Carbohydrate microarrays for 38. Hung CY, et al. (2006) Carbohydrate microarray for profiling the antibodies interacting
the recognition of cross-reactive molecular markers of microbes and host cells. Nat with Globo H tumor antigen. Proc Natl Acad Sci USA 103:15–20.
Biotechnol 20:275–281. 39. Blixt O, et al. (2004) Printed covalent glycan array for ligand profiling of diverse glycan
17. Mellet CO, Garcia Fernandez JM (2002) Carbohydrate microarrays. Chembiochem
binding proteins. Proc Natl Acad Sci USA 101:17033–17038.
3:819 – 822.
40. Jones RB, Gordus A, Krall JA, MacBeath G (2006) A quantitative protein interaction
18. Feizi T, Fazio F, Chai W, Wong CH (2003) Carbohydrate microarrays-a new set of
network for the ErbB receptors using protein microarrays. Nature 439:168 –174.
technologies at the frontiers of glycomics. Curr Opin Struct Biol 13:637– 645.
41. Gordus A, MacBeath G (2006) Circumventing the problems caused by protein diversity
19. Disney MD, Magnet S, Blanchard JS, Seeberger PH (2004) Aminoglycoside microarrays
in microarrays: Implications for protein interaction networks. J Am Chem Soc (2006)
to study antibiotic resistance. Angew Chem Int Ed 43:1591–1594.
28:13668 –13669.
20. Ratner DM, et al. (2004) Probing protein– carbohydrate interactions with microarrays
of synthetic oligosaccharides. ChemBioChem 5:379 –382. 42. Liang PH, Wang SK, Wong CH (2007) Quantitative analysis of carbohydrate–protein
21. Bryan MC, et al. (2004) Covalent display of oligosaccharide arrays in microtiter plates. interactions using glycan microarrays: Determination of surface and solution dissoci-
J Am Chem Soc 126:8640 – 8641. ation constants. J Am Chem Soc 129:11177–11184.
22. Disney MD, Seeberger PH (2004) Aminoglycoside microarrays to explore interactions of 43. Boyle P (1997) Global burden of cancer. Lancet 349:S23–S26.
antibiotics with RNAs and proteins. Chem Eur J 10:3308 –3314. 44. Galanina OE, Mecklenburg M, Nifantiev NE, Pazynina GV, Bovin NV (2003) GlycoChip:
23. Adams EW, et al. (2004) Oligosaccharide and glycoprotein Microarrays as tools in HIV Multiarray for the study of carbohydrate-binding proteins. Lab Chip 3:260 –265.
glycobiology: Glycan-dependent gp120/protein interactions. Chem Biol 11:875– 881. 45. Chang WW, et al. (2008) Expression of Globo H and SSEA3 in breast cancer stem cells
24. Shin I, Park S, Lee MR (2005) Carbohydrate microarrays: An advanced technology for and the involvement of fucosyl transferase 1 & 2 in Globo H synthesis. Proc Natl Acad
functional studies of glycans. Chem Eur J 11:2894 –2901. Sci USA 105:11667–11672.
11666 兩 www.pnas.org兾cgi兾doi兾10.1073兾pnas.0804923105 Wang et al.You can also read