Glycation of benign meningioma cells leads to increased invasion
←
→
Page content transcription
If your browser does not render page correctly, please read the page content below
Biol. Chem. 2021; 402(7): 849–859

Philipp Selke, Philip Rosenstock, Kaya Bork, Christian Strauss, Rüdiger Horstkorte*
and Maximilian Scheer

Glycation of benign meningioma cells leads to
increased invasion
https://doi.org/10.1515/hsz-2020-0376                                    Introduction
Received November 25, 2020; accepted February 26, 2021;
published online March 17, 2021
                                                                         Meningioma represents the most common non-malignant
                                                                         intracranial tumor (Goldbrunner et al. 2016; Holleczek et al.
Abstract: Meningiomas are the most common non-
                                                                         2019; Ostrom et al. 2018, 2019).
malignant intracranial tumors. Like most tumors, menin-
                                                                              Like many tumors, meningiomas need large amounts of
giomas prefer anaerobic glycolysis for energy production
                                                                         glucose as primary energy source, because they mainly
(Warburg effect). This leads to an increased synthesis of the
                                                                         metabolize glucose to lactate during anaerobic glycolysis
metabolite methylglyoxal (MGO). This metabolite is known
                                                                         (Warburg effect) (Bharadwaj et al. 2015), which generates
to react with amino groups of proteins. This reaction is
                                                                         only low amounts of adenosine triphosphate (ATP). This
called glycation, thereby building advanced glycation
                                                                         changed (anaerobic) energy metabolism is one of the
endproducts (AGEs). In this study, we investigated the in-
                                                                         “hallmarks of cancer” (Gill et al. 2016). In line with this, there
fluence of glycation on two meningioma cell lines, repre-
                                                                         is a correlation between serum glucose levels and menin-
senting the WHO grade I (BEN-MEN-1) and the WHO grade
                                                                         gioma risk (Edlinger et al. 2012; Michaud et al. 2011; Nie-
III (IOMM-Lee). Increasing MGO concentrations led to the
                                                                         dermaier et al. 2015; Wiedmann et al. 2013). However, there
formation of AGEs and decreased growth in both cell lines.
                                                                         are many inconsistent data suggesting a positive (Schneider
When analyzing the influence of glycation on adhesion,
                                                                         et al. 2005; Schwartzbaum et al. 2005) or inverse (Bernardo
chemotaxis and invasion, we could show that the glycation
                                                                         et al. 2016) relationship between diabetes and serum glucose
of meningioma cells resulted in increased invasive poten-
                                                                         levels and the risk of meningioma. Patients with type 2
tial of the benign meningioma cell line, whereas the inva-
                                                                         diabetes have a decreased survival after surgical resection of
sive potential of the malignant cell line was reduced. In
                                                                         a WHO grade I meningioma (Nayeri et al. 2016).
addition, glycation increased the E-cadherin- and
                                                                              Methylglyoxal (MGO) has been discussed as a possible
decreased the N-cadherin-expression in BEN-MEN-1 cells,
                                                                         linker between diabetes and serum glucose levels and
but did not affect the cadherin-expression in IOMM-Lee
                                                                         cancer (Bellier et al. 2019), since diabetic patients and aged
cells.
                                                                         individuals have elevated MGO concentrations (Rabbani
Keywords: glycation; intracranial tumor; invasion; me-                   and Thornalley 2015). Some authors even propose MGO as
ningioma; methylglyoxal; MGO.                                            a tumor promoting agent (Antognelli et al. 2019; Bellah-
                                                                         cène et al. 2018). Approximately 0.1–0.4% of the glucose is
                                                                         transformed to MGO during glycolysis as a regular side
                                                                         product from dihydroxyacetone phosphate or glyceralde-
*Corresponding author: Rüdiger Horstkorte, Medical Faculty,              hyde-3-phosphate (Allaman et al. 2015). Importantly, MGO
Institute for Physiological Chemistry, Martin-Luther-University Halle-   is 20,000 times more reactive than glucose and reacts
Wittenberg, D-06114 Halle/Saale, Germany,                                mainly with proteins (through arginine, lysine, and
E-mail: ruediger.horstkorte@medizin.uni-halle.de                         cysteine residues) or to a lower degree also with DNA or
Philipp Selke, Philip Rosenstock and Kaya Bork, Medical Faculty,
                                                                         lipids, thereby forming advanced glycation endproducts
Institute for Physiological Chemistry, Martin-Luther-University Halle-
Wittenberg, D-06114 Halle/Saale, Germany. https://orcid.org/0000-        (AGEs) (Falone et al. 2012; Kalapos 2008; Schalkwijk 2015).
0001-7862-2713 (P. Selke)                                                This non-enzymatic reaction between the carbonyl groups
Christian Strauss, Department for Neurosurgery, University Hospital      of dicarbonyls (like MGO or glyoxal) or sugars (like glucose
Halle, D-06120 Halle/Saale, Germany                                      or fructose) and the amino groups of proteins is called
Maximilian Scheer, Medical Faculty, Institute for Physiological
                                                                         glycation (Ahmed 2005; Rabbani and Thornalley 2008).
Chemistry, Martin-Luther-University Halle-Wittenberg, D-06114 Halle/
Saale, Germany; and Department for Neurosurgery, University
                                                                         Electrophilic carbonyl groups of glucose or other reactive
Hospital Halle, D-06120 Halle/Saale, Germany. https://orcid.org/         sugars react with free amino groups of amino acids and
0000-0003-3149-0797                                                      forming a non-stable Schiff base. This reaction is called
  Open Access. © 2021 Philipp Selke et al., published by De Gruyter.      This work is licensed under the Creative Commons Attribution 4.0
International License.
850         P. Selke et al.: Glycation of meningioma cells

classical Maillard reaction. Further rearrangement leads to      presence of MGO for 24 h. Representative micrographs for
formation of a more stable ketosamine (Amadori product).         the benign BEN-MEN-1 cells are shown in Figure 1A and for
The formation of Schiff bases and Amadori products are           the malignant IOMM-Lee cells in Figure 1B. When cells
reversible reactions. In later reactions, they form irrevers-    were cultured in the presence of 0.1 or 0.3 mM MGO, we
ible adducts or protein crosslinks (Ahmed 2005; Paul and         could not observe any changes in the morphology
Bailey 1996). The process of producing AGEs affects all          compared with untreated control cells. BEN-MEN-1 cells
proteins including cell adhesion molecules or receptors          had a typical meningothelial shape and grew in mono-
and proteins of the extracellular matrix (Pedchenko et al.       layers. IOMM-Lee cells were more epithelial-like and grew
2005; Rabbani and Thornalley 2012).                              as multilayers. After treatment with 0.6 mM MGO, we
      It was previously suggested that application of MGO        observed less cells and morphological differences
lead to altered adhesion and migration (Antognelli et al.        compared with the controls. When culturing cells in pres-
2019; Loarca et al. 2013; Nokin et al. 2019).                    ence of 1.0 mM MGO, cells became round and we observed
      Cadherins represent cell adhesion molecules that mediate   less cells and less spreading in both cultures.
   2+
Ca -dependent homophilic interaction with cadherin mole-
cules on the surface of neighboring cells. The cytoplasmic
domain binds downstream to members of the catenin protein        High concentrations of MGO interfere with
family and regulates functions like cell–cell interactions       the cell viability of meningioma cells
(Harrison et al. 2011; Mège and Ishiyama 2017). Cadherins also
play an important role in the epithelial–mesenchymal-tran-       Since morphology was changed in presence of 0.6 mM MGO
sition (EMT). The EMT describes the change of epithelial         or more, we examined the cell viability of both meningioma
markers like E-cadherin to mesenchymal markers like              cell lines, after culturing in absence or presence of different
N-cadherin or Vimentin and can promote migration of trans-
formed cells (Gloushankova et al. 2017; Mendonsa et al. 2018).
Decreasing E-cadherin expression is mostly associated with
weakening of cell–cell adhesion in tumor progression
(Rodriguez et al. 2012). Expression of N-cadherin is closely
related to tumor invasion and metastasis (Cao et al. 2019).
      In the present study, we analyzed differences between
benign and malignant meningioma cell lines before and
after glycation using MGO. We could show that physiolog-
ical MGO concentrations had no effect on cell morphology,
metabolic activity, chemotaxis and adhesion. However, the
invasiveness of the benign meningioma cells was increased
whereas the invasiveness of the malignant meningioma
cells was reduced in the presence of MGO, which means that
glycation resulted in a switch of benign tumor to a more
aggressive tumor cell. Furthermore, glycation led to
increased E-cadherin and reduced N-cadherin-expression in
the benign meningioma cells.

Results
MGO-treatment of meningioma cells
interferes with their morphology
                                                                 Figure 1: Micrographs of meningioma cells after 24 h
                                                                 MGO-treatment.
First of all, we analyzed whether treatment with MGO             Cells (A = BEN-MEN-1 and B = IOMM-Lee) were cultured in the
affects meningioma cells by comparing their morphology.          absence (control) or presence of different concentrations (0.1, 0.3,
Therefore, we cultured both cell lines in absence or             0.6 and 1.0 mM) of MGO. Scale bar in white: 50 µm.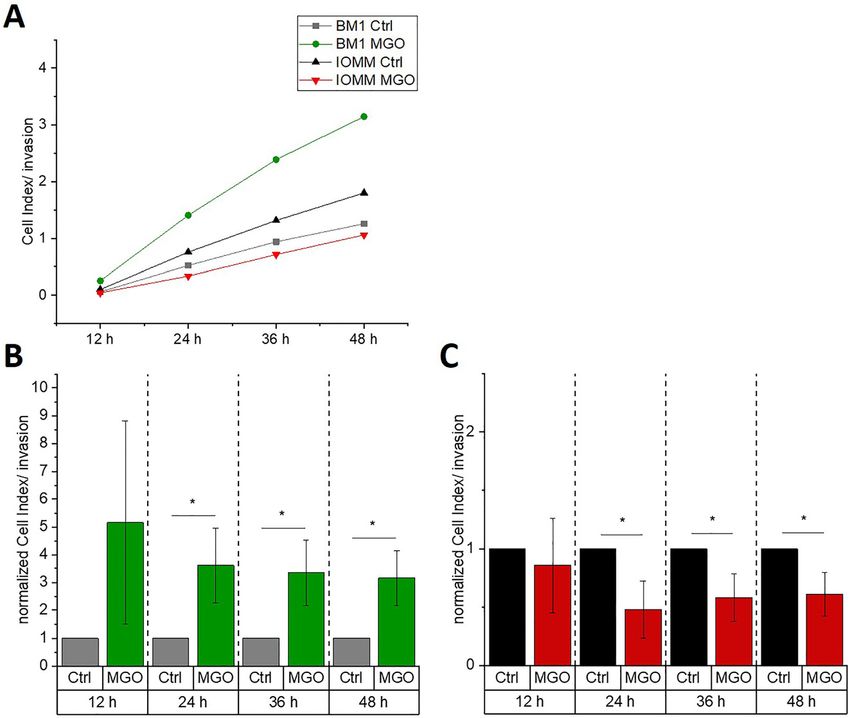
P. Selke et al.: Glycation of meningioma cells 851
Figure 2: Cell viability of meningioma cell lines after 24 h MGO-treatment.
Cell viability was analyzed using an MTT-assay for BEN-MEN-1 (A) and IOMM–Lee cells (B). Cells were seeded in absence (Ctrl) or presence of
MGO (0.1, 0.3, 0.6 and 1.0 mM). Both cell lines showed a decreasing metabolic activity with increasing concentration of MGO. Statistical
analysis was performed using t-test and error bars represent SD (n = 7; ***p < 0.005; (BEN-MEN-1: p = 0.0027; IOMM-Lee: p = 0.00045)).
concentrations of MGO (Figure 2). We measured decreased MGO has no effect on the adhesion of
cell viability after incubation with high concentrations of meningioma cells to ECM components
MGO. For the benign cell line, we could not show significant
differences at MGO concentrations up to 0.6 mM. Only at We then analyzed the effect of glycation on adhesion of the
1.0 mM MGO, cell viability was significantly reduced two meningioma cell lines. Since 0.3 mM MGO had no ef-
compared with untreated controls (BEN-MEN-1; Figure 2A). fect on the cell viability of both meningioma cell lines and
For the malignant cell line (IOMM-Lee; Figure 2B), we led to significant formation of AGEs, we decided to use
observed similar effects. Only at 1.0 mM MGO, there was a 0.3 mM MGO for all further experiments. To quantify
significant difference compared with control, which adhesion, we cultured both meningioma cell lines in
confirmed our microscopic observations presented in E-plates. Cells were seeded in absence or presence of MGO
Figure 1A and B. Furthermore, we analyzed caspase 3 on two different matrices (collagen IV or fibronectin) which
expression by Western blot analysis. Caspase 3 was only were in addition preincubated with or without MGO.
expressed in cultures treated with 1.0 mM MGO and not in Figure 4A and B shows the adhesion of both meningioma
cultures treated with 0.1, 0.3 or 0.6 mM MGO (data not cell lines on the two different matrices. No significant dif-
shown), indicating that only very high concentrations of ference in adhesion could be detected in both cell lines
MGO induce apoptosis in our experiments. after MGO treatment. Please note, that we observed that
BEN-MEN-1 cells adhere much better on both substrates
compared to IOMM-Lee cells and that both cancer cells
Increased glycation with increasing prefer fibronectin to collagen IV as substrate.
concentrations of MGO
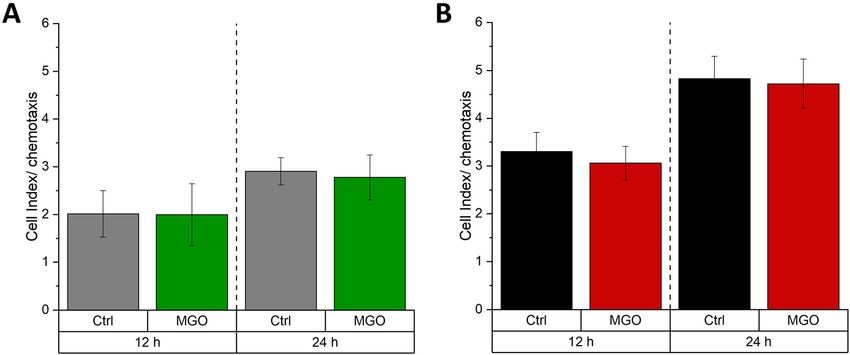
Next, we wanted to examine whether treatment of menin- MGO has no effect on chemotaxis of
gioma cells with MGO led to glycation. For this, we cultured meningioma cells
both meningioma cell lines in the presence (0.1, 0.3, 0.6
and 1.0 mM) or absence of MGO for 24 h. To verify the effect Since MGO leads to glycation of almost all cellular proteins,
of the treatment, we performed immunoblotting using anti- we next wanted to analyze whether cell surface receptors are
AGE antibodies. We could show that increasing MGO in general inactivated after glycation. We therefore investi-
concentrations led to increasing AGE-signals, which is gated the impact of glycation on the chemotaxis, which is
shown in Figure 3A and C for BEN-MEN-1 and in Figure 3B mediated by cell surface receptors. We cultured both me-
and D for IOMM-Lee cells. Glycation is quantified in ningioma cell lines in CIM-plates for 24 h. Cells were
Figure 3B and D. We found significant increase of glycation cultured again in the absence or presence of 0.3 mM MGO.
already at concentrations of 0.3 mM MGO (Figure 3E). Figure 5A and B shows the chemotactic cell migration after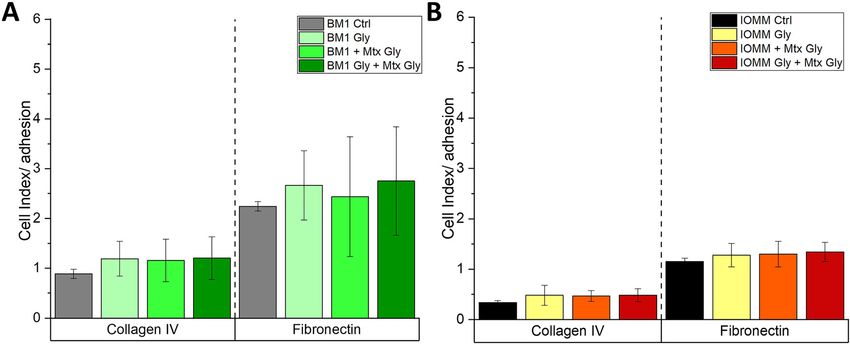
852           P. Selke et al.: Glycation of meningioma cells

Figure 3: Glycation of meningioma cells.
(A) Ponceau S staining of the total proteins (left side) and immunoblot (right side) of BEN-MEN-1 with different MGO concentrations. Controls
(Ctrl) were cells without MGO treatment. We used an anti-AGE antibody to verify cellular glycation. (B) Ponceau S staining of the total proteins
(left side) and immunoblot (right side) of IOMM-Lee cells with different MGO concentrations. Controls (Ctrl) were cells without MGO treatment.
We used an anti-AGE antibody to verify cellular glycation (C) Representative quantification of the blot of BEN-MEN-1 cells shown in panel (A). (D)
Representative quantification of the blot of IOMM-Lee cells shown in panel (B). (E) Quantification of glycation of BEN-MEN-1 and IOMM-Lee
after treatment with 0.3 mM MGO. Non-glycated cells were used as controls (Ctrl). Statistical analysis was performed using t-test and error
bars represent SD (n = 4; (BEN-MEN-1: p = 0.0452; IOMM-Lee: p = 0.0143)).

Figure 4: Adhesion of meningioma cells with MGO-treatment.
BEN-MEN-1 (BM1) (A) and IOMM-Lee (IOMM) (B) cells were seeded in absence (Ctrl) or presence of 0.3 mM MGO on collagen IV (left) or
fibronectin (right). Graphs display adhesion on collagen IV and fibronectin with or without treatment with untreated or treated cells after 2 h.
Gray and black bars in (A) and (B) represent the untreated matrix with untreated cells as control. Untreated matrix and treated BEN-MEN-1 cells
(BM1 Gly; light green bar) or treated IOMM cells (IOMM Gly; yellow bar). The green (BM1 + Mtx Gly) and orange (IOMM + Mtx Gly) bars show cell
adhesion of treated matrix with untreated BEN-MEN-1 and IOMM-Lee cells. Dark green (BM1 Gly + Mtx Gly) and red (IOMM Gly + Mtx Gly) bars
represent treated matrix with treated BEN-MEN-1 and IOMM-Lee cells. Error bars represent SD (n = 4), (Mtx = Matrix; Gly = MGO treatment).
P. Selke et al.: Glycation of meningioma cells 853
Figure 5: Chemotaxis of meningioma cells.
BEN-MEN-1 (A) and IOMM-Lee (B) were cultured for 24 h in the absence (Ctrl) or presence of 0.3 mM MGO. Graphs display relative chemotaxis
(presented as cell indices) with treatment (MGO) or without treatment (Ctrl) for 12 and 24 h. Error bars represent SD (n = 4).
12 h or 24 h. Treatment with MGO had no effect, neither on family, which are involved in epithelial-mesenchymal or
BEN-MEN-1 (Figure 5A) nor on IOMM-Lee cells (Figure 5B). mesenchymal-epithelial-transition. Therefore, we cultured
Please note that chemotaxis of malignant IOMM-Lee cells is meningioma cells in absence or presence of 0.3 mM MGO
higher in contrast to benign BEN-MEN-1 cells. for 24 h and performed immunoblotting using anti-E- and
N-cadherin antibodies (Figure 7). The expression of E- and
N-cadherin in IOMM-Lee was not changed after glycation
Glycation increases invasiveness of the (Figure 7A–D). However, glycation of BEN-MEN-1 cell line
benign cell line and decreases the resulted in increasing expression of E-cadherin (Figure 7A
and B) and decreasing expression of N-cadherin (Figure 7C
invasiveness of malignant cell line
and D).
Since invasiveness is the most important parameter in most
tumors, we finally wanted to examine whether there are
changes in invasiveness due to glycation. From our chemo- Discussion
taxis experiments, we knew already that glycation does not
interfere with the function of cellular receptors in general. Little is known about the role of MGO and glycation on
We therefore cultured meningioma cell lines in CIM-plates meningioma cells. In this study, we analyzed the effect of
for 48 h on matrigel in absence or presence of 0.3 mM MGO. MGO-treatment and glycation on two meningioma cell
Figure 6A displays the invasion over 48 h for both cell lines. lines, representing the WHO grade I (BEN-MEN1) and the
Untreated IOMM-Lee cells are more invasive compared with WHO grade III (IOMM-Lee). We could show that treatment
BEN-MEN-1 cells. BEN-MEN-1 (Figure 6B) cells had a signif- with MGO led to glycation and modulated the invasiveness
icantly increased invasion after MGO-treatment after 24, 36 of both meningioma cell lines. However, glycation did not
and 48 h compared with the untreated controls. This effect affect cell adhesion and chemotaxis of these cell lines.
could be also observed in another benign meningioma cell Up to 90–99% of cellular MGO is bound in vivo to
line (HBL-52) (data not shown). Interestingly, the malignant macromolecules; however, cellular concentrations up to
cell line (IOMM-Lee, Figure 6C) showed a significant reduc- 0.3 mM have been reported (Chaplen 1998; Chaplen et al.
tion in their invasiveness over 48 h. 1998; Thornalley 1996). Our data on cell viability using the
methylthiazolyldiphenyl-tetrazolium bromide (MTT) assay
showed that meningioma cells have no significantly
Glycation influences the expression of E- and reduced metabolism at physiological concentration of
N-cadherin in benign meningioma cells 0.3 mM MGO, but are influenced by MGO at high non-
physiological concentrations. This could be confirmed via
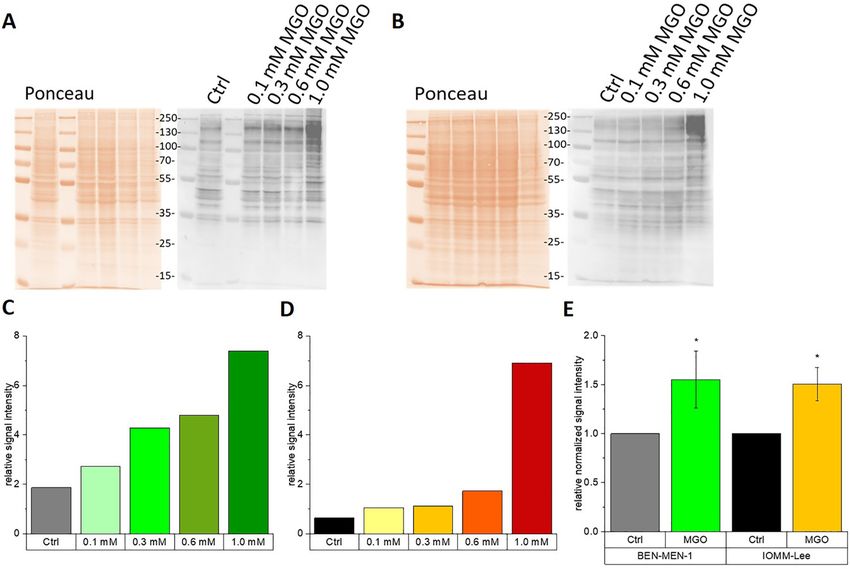
Finally, we wanted to investigate whether MGO treatment microscopy, where fewer cells and less cell spreading were
influences the expression of members of the cadherin observed and in immunoblotting in high concentrations,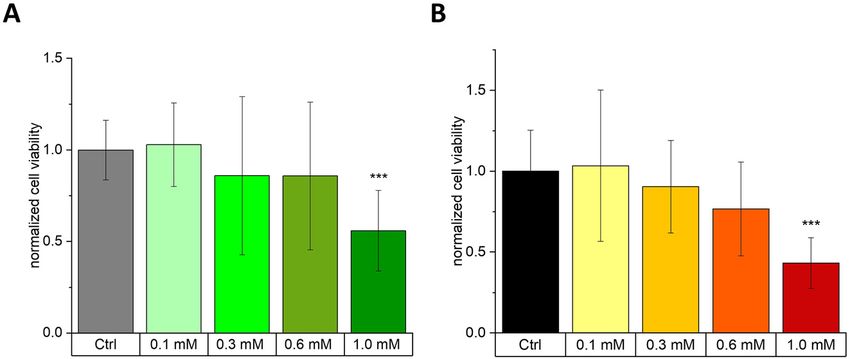
854          P. Selke et al.: Glycation of meningioma cells

Figure 6: Invasion of meningioma cells.
BEN-MEN-1 (A, B) and IOMM-Lee (A, C) were cultivated for 48 h in absence (Ctrl) or presence of 0.3 mM MGO. Graphs display invasion
(presented as cell indices) with treatment (MGO) or without treatment (Ctrl) for 12 h, 24 h (BEN-MEN-1: p = 0.012; IOMM-Lee: p = 0.0347), 36 h
(BEN-MEN-1: p = 0.0112; IOMM-Lee: p = 0.0377) and 48 h (BEN-MEN-1: p = 0.0324; IOMM-Lee: p = 0.0374). In the graphs (B) and (C) normalized
cell indices were shown for both cell lines relative to the controls. Statistical analysis was performed using t-test. Error bars represent SD
(n = 4; *p < 0.05).

                                                                                                  Figure 7: Cadherin expression of
                                                                                                  meningioma cells with and without
                                                                                                  MGO-treatment.
                                                                                                  (A) BEN-MEN-1 and IOMM-Lee were cultured
                                                                                                  in the absence or presence of 0.3 mM MGO
                                                                                                  and E-cadherin was analyzed by Western
                                                                                                  blotting. (B) Quantification of E-cadherin
                                                                                                  expression in BEN-MEN-1 (p = 0.0406) and
                                                                                                  IOMM-Lee cells before (Ctrl) and after
                                                                                                  treatment with 0.3 mM MGO (n = 3). (C)
                                                                                                  BEN-MEN-1 and IOMM-Lee were cultured in
                                                                                                  the absence or presence of 0.3 mM MGO
                                                                                                  and N-cadherin was analyzed by Western
                                                                                                  blotting. (D) Quantification of N-cadherin
                                                                                                  expression in BEN-MEN-1 (p = 0.0276) and
                                                                                                  IOMM-Lee cells before (Ctrl) and after
                                                                                                  treatment with 0.3 mM MGO (n = 7). All
                                                                                                  statistical analysis (B, D) were performed
                                                                                                  using t-test. Error bars represent SD
                                                                                                  (*p < 0.05).
P. Selke et al.: Glycation of meningioma cells 855
we could detect the cleaved- caspase-3 activity, which is meningioma (Utsuki et al. 2005), we found high expression
one of the key player of programmed cell death (i.e. of E-cadherin in the malignant grade III IOMM-Lee cells
apoptosis) (data not shown). Similar observations have and low expression in the benign grade I BEN-MEN-1 cells
been shown in human glioblastoma multiforme T98G, (see blots in Figure 7). Glycation led to increased expres-
U87MG cells and SH-SY5Y neuroblastoma cells, where sion of E-cadherin in BEN-MEN-1 cells, which fits nicely to
MGO interfered with proliferation (Paul-Samojedny et al. the increased invasiveness after glycation. On the other
2016; Yin et al. 2012). Another study showed that MGO af- hand, we found decreased expression of N-cadherin in
fects rat schwannoma RT4 cells, PC12 cells and U87 glioma BEN-MEN-1 cells. Asano and colleagues reported for gli-
cells in cell viability by decreasing of the key signaling omas, that an increased expression of N-cadherin corre-
pathway for cell survival (gp130/STAT3 signaling) and as a lated with a decreased invasiveness (Asano et al. 2004).
consequence promotes cytotoxicity (Lee et al. 2009). Another study has shown that a decreased expression of
MGO led in our hands to detectable glycation of me- N-cadherin resulted in a faster and less-directed migration
ningioma cell proteins. The influence of glycation on of tumor cells (Camand et al. 2012). In our model, it appears
adhesion, migration, invasion and apoptosis of cancer that increased expression of E-cadherin and a decreased
cells could be demonstrated in several recent studies (He expression of N-cadherin are associated with a more inva-
et al. 2016; Loarca et al. 2013; Scheer et al. 2020). Our data sive behavior. Many studies suggest a correlation between
show that cell adhesion of meningioma cells is not altered N-cadherin expression and matrix metalloproteinase-9
at physiological relevant MGO concentrations. Meningi- (MMP-9) (Hsu et al. 2016; Suyama et al. 2002; Walker et al.
oma cells prefer fibronectin as substrate, what is in line 2014). Preliminary data suggest an up-regulation of MMP-9
with their integrin expression (α4, 5, 6 and β1, 3, 4) (pre- in BEN-MEN-1 cells after treatment with 0.3 mM MGO (data
liminary data not shown), which are also known to be not shown). Although this has to be validated, one could
involved in proliferation, adhesion, migration and inva- speculate this as one reason for the increased invasion of
sion in meningiomas (Bello et al. 2000; Chen et al. 2009; this cell line.
Gogineni et al. 2011; Nigim et al. 2019). Further studies should include expression analysis of
Our data on chemotaxis indicate that glycation of the receptor of advanced glycation endproducts (RAGE),
meningioma cells does not lead to a general loss of func- since Dai and colleagues showed that the AGE-induced
tion. MGO-treatment seems to have cell-specific effects on RAGE-signaling pathways promotes development and pro-
behavior, since migration was reduced in liver and colon gression of meningiomas (Dai et al. 2018) and several other
cancer cells and increased in neuroblastoma cells (He et al. studies suggested also an involvement of RAGE in tumor
2016; Loarca et al. 2013; Scheer et al. 2020). progression (Abe and Yamagishi 2008; Ahmad et al. 2018;
However, our results from the invasion of the menin- Takino et al. 2010). In our hands, RAGE expression was
gioma cells indicate that MGO-treatment leads to a higher increased in both cell lines after glycation (data not shown).
degree of invasiveness in benign meningioma cells, In summary, we propose that glycation has a specific
consequently to increased aggressiveness of meningioma effect on different cancer cells. Glycation promotes inva-
cells. Antognelli et al. have shown that MGO treatment siveness of a WHO grade I meningioma cell line in vitro, but
increases the invasion in anaplastic thyroid cancer (ATC) decreases invasive behavior in a WHO grade III meningi-
cells (Antognelli et al. 2019). This observation was also oma cell line. Further studies are necessary, which could
confirmed in neuroblastoma cells (Scheer et al. 2020). In include strategies for “de-glycation”, which may be
liver cancer, it has been shown that invasion was inhibited important for future cancer treatment.
by MGO treatment (Loarca et al. 2013). However, one has to
keep in mind that the concentrations of MGO treatments
were different in most studies. Low concentration of 5 µM
MGO resulted in an increased invasion in ATC cells and a Materials and methods
decreased invasion in liver cancer cells (Antognelli et al.
2019; Loarca et al. 2013). In neuroblastoma cells, increased Cell culture
invasiveness occurred after treatment with 0.1 mM MGO
(Scheer et al. 2020). The human benign meningioma cell line BEN-MEN-1 was obtained
from Leibniz-Institute DSMZ (Deutsche Sammlung von Mikroorga-
Canel et al. proposed an E-cadherin–integrin crosstalk
nismen und Zellkulturen GmbH, Braunschweig, Germany) and the
during cancer invasion and metastasis (Canel et al. 2013). human malignant meningioma cell line IOMM-Lee (ATCC®
Although Utsuki and colleagues have shown that low CRL-3370™) was obtained from American Type Culture Collection
expression of E-cadherin is associated with invasive (ATCC, Manassas, USA). Both cell lines were cultured in Dulbecco’s856 P. Selke et al.: Glycation of meningioma cells
modified Eagle’s medium (DMEM) supplemented with 100 μg/mL of Examination of adhesion with real time cell analysis
streptomycin, 100 U/mL of penicillin, 4 mM glutamine and 10% fetal
bovine serum (FBS, Sigma Aldrich, St. Louis, MO, USA) at 37 °C in a 5%
Fibronectin and collagen IV at a concentration of 10 μg/mL were used
CO2 incubator. The cell lines were split every 2–3 days with 0.1%
for each experiment and were added to the wells of the 96X E-plates®
Trypsin-ethylenediaminetetraacetic acid (EDTA) solution for 2 min.
(ACEA Biosciences, San Diego, USA) and incubated for 1 h at 37 °C.
E-plates® have gold microelectrode biosensors in each well of ACEA’s
Cell viability and cell morphology assays electronic microtiter plates. After a washing step with PBS, the wells
were incubated with 0.5% BSA solution in PBS for 20 min. Before the
cells and media were added, the wells were washed with PBS. The cells
The cell viability of glycated BEN-MEN-1 and IOMM-Lee cells was
were trypsinized and detached. The reaction was stopped and the cells
measured using an MTT (Sigma Aldrich) assay. Both cell lines were were resuspended in media with 1% FBS. 50 µL serum-free media was
seeded into 96-well plates at a density of 7.8 × 10⁴/cm2 cells per well in
added to every well in order to measure the background signal. Cells
DMEM with 1% FBS. After 2 h of attachment, cells were treated with
were added in density of 1.5625 × 10⁴/cm2. The adhesion of cell lines
different concentrations of MGO (Sigma Aldrich, 40% aqueous solu- was measured as changes in impedance with the Real Time cell
tion; diluted in 1× PBS; 0.1, 0.3, 0.6 and 1.0 mM). Controls (Ctrl) were electronic sensing (RT-CES®) system (ACEA Biosciences) and moni-
cells (BEN-MEN-1, IOMM-Lee) without MGO treatment. Cell lines were
tored every 15 min for a period of 4 h. The measurement was done with
cultivated for 24 h. Morphology of the cells was acquired with bright the Real Time Cell Analyzer dual purpose (RTCA DP) Analyzer (ACEA
field microscopy (Axiovert 100, Carl Zeiss AG, Oberkochen, Germany). Biosciences,) and displayed with the Real Time Cell Analyzer (RTCA)
MTT was diluted to a final concentration of 0.5 mg/mL in normal
program 2.0 (ACEA Biosciences,) as Cell Index (CI). The index is
growth medium and cells were incubated for 2 h with 100 μL MTT calculated as follows: CI = (impedance at time point n − impedance in
solution per well. After elimination of MTT-containing medium, re- the absence of cells)/nominal impedance value.
sidual formazan crystals were dissolved in 150 μL dimethyl sulfoxide
(DMSO). The absorption values were measured (Plate-Reader, Clar-
iostar, BMG Labtech GmbH, Ortenberg, Germany) at a wavelength of Examination of chemotaxis with real time cell analysis
570 nm (background 630 nm). The untreated control cells were set to 1
of cell viability. The changes in cell viability of the treated cells were Chemotaxis was analyzed in 96X Cellular invasion and migration
calculated in relation to the untreated control. (CIM)-plates (ACEA Biosciences). The CIM-plates are composed of an
upper and a lower chamber. The bottom surface of the upper chamber
consists of a microporous membrane where cells can migrate through.
Glycation and immunoblotting
Underneath the membrane, a gold electrode detects the presence of
adherent cells. 160 µL DMEM with 20% FBS were added in the lower
Cells were seeded in 12-well plates at a density of 3.95 × 10⁴/cm2 in chamber. 50 µL DMEM with 1% FBS were added in the upper chamber.
DMEM with 1% FBS. After 2 h of attachment, the cells were treated with CIM-plates were incubated for 1 h at 37 °C, followed by background
different concentrations of MGO (0.1, 0.3, 0.6 and 1.0 mM). Controls measurement. Cells were trypsinized, detached, the reaction was
(Ctrl) were cells (BEN-MEN-1, IOMM-Lee) without MGO treatment. The stopped and the cells were resuspended in media with 1% FBS. Cells
cell lines were cultivated for 24 h. Cells were directly lysed in hot were added to the upper chamber in density of 7.8 × 10⁴/cm2. The
SDS-sample buffer (2.5% sodium dodecyl sulfate, 0.06 M TRIS chemotaxis on every label was measured as changes in impedance
(tris(hydroxymethyl)aminomethane) pH 6.8, 10% glycerin, 0.01% with the RT-CES® system and monitored every 15 min for a period of
bromophenol blue, 10 mM dithiothreitol in TBS-T (TRIS-buffered sa- 24 h. The measurement was conducted with the RTCA DP Analyzer
line/0.1% Tween)) to isolate the total protein. Proteins were separated (ACEA Biosciences) and displayed with the RTCA program 2.0 (ACEA
by sodium dodecyl sulfate polyacrylamide gel electrophoresis Biosciences).
(SDS-PAGE, 10%) and transferred to a nitrocellulose membrane using
Western blot techniques. The monoclonal anti-AGE antibody Car-
boxymethyllysine (CML)-26 (0.05 μg/mL, Abcam, Cambridge, UK) Examination of invasion with real time cell analysis
together with the secondary peroxidase-coupled antibody (Immu-
noResearch Inc., Eagan, USA) was used to detect the glycation. Invasion was analyzed in 96X CIM-plates (ACEA Biosciences). The
Detection of E- and N-cadherin expression were done with monoclonal CIM-plates are composed of an upper and a lower chamber. The bot-
anti-E-cadherin antibody (0.05 μg/mL, Abcam, Cambridge, UK) and tom surface of the upper chamber consists of a microporous mem-
with monoclonal anti-N-cadherin antibody (0.0483 μg/mL, Abcam, brane where cells can migrate through. On the underside of this
Cambridge, UK) and a secondary peroxidase-coupled antibody membrane a gold electrode detects the presence of adherent cells. To
(ImmunoResearch Inc., Eagan, USA). Images were taken using investigate the invasion, 800 μg/mL Basement Membrane Matrix,
Chemidoc MP imaging system (Bio-Rad Laboratories, Hercules, USA). lactose dehydrogenase-elevating virus (LDEV)-free Matrigel® (Corn-
Ponceau S staining (0.1% Ponceau S, 3% trichloroacetic acid and 3% ing, Minneapolis, MN, USA) were added in the upper chamber. After
sulfosalicylic acid) of total loaded protein and glyceraldehyde an incubation for 4 h at 37 °C, 160 µL DMEM with 20% FBS were added
3-phosphate dehydrogenase (GAPDH) (0.04 μg/mL, Santa Cruz in the lower chamber and 50 µL DMEM with 1% FBS were added in the
Biotechnology Inc., Dallas, USA) were used as loading controls. Band upper chamber. The CIM-plates were incubated for 1 h at 37 °C. Af-
intensity of proteins of interest were transformed into numeric values terwards, the background signal was measured. Cells were trypsinized
using Image lab software (Bio-Rad Laboratories, Hercules) and and detached. The reaction was stopped by adding media with 1% FBS
normalized to the corresponding ponceau S staining to quantify the and the cells were resuspended. Cells were added to the upper
results. chamber in density of 1.1 × 10⁵/cm2. Invasion was measured asP. Selke et al.: Glycation of meningioma cells 857
changes in impedance with the RT-CES® system and monitored every AGEs, connects between diabetes and cancer. Diabetes Res. Clin.
15 min for a period of 48 h. The measurement was carried out with the Pract. 148: 200–211.
RTCA DP Analyzer (ACEA Biosciences) and displayed with the RTCA Bello, L., Zhang, J., Nikas, D.C., Strasser, J.F., Villani, R.M., Cheresh,
program 2.0 (ACEA Biosciences). D.A., Carroll, R.S., and Black, P.M. (2000). Alpha(v)beta3 and
alpha(v)beta5 integrin expression in meningiomas.
Neurosurgery 47: 1185–1195.
Statistical analysis Bernardo, B.M., Orellana, R.C., Weisband, Y.L., Hammar, N., Walldius,
G., Malmstrom, H., Ahlbom, A., Feychting, M., and
All analyses and visualizations were performed using OriginPro 2019 Schwartzbaum, J. (2016). Association between prediagnostic
software (OriginLab Corporation, Northampton, USA). Paired stu- glucose, triglycerides, cholesterol and meningioma, and reverse
dent’s t-test against the control group, both cell lines or a theoretical causality. Br. J. Cancer 115: 108–114.
value of 1 (due to data normalization) were executed. Figures show the Bharadwaj, S., Venkatraghavan, L., Mariappan, R., Ebinu, J., Meng, Y.,
average mean with standard deviation (SD) and levels of significance Khan, O., Tung, T., Reyhani, S., Bernstein, M., and Zadeh, G.
are represented within the Figures. (2015). Serum lactate as a potential biomarker of non-glial brain
tumors. J. Clin. Neurosci. 22: 1625–1627.
Camand, E., Peglion, F., Osmani, N., Sanson, M., and Etienne-
Acknowledgment: Special thanks to Dr. Heidi Olzscha for Manneville, S. (2012). N-cadherin expression level modulates
critical reading of the manuscript. integrin-mediated polarity and strongly impacts on the speed
and directionality of glial cell migration. J. Cell Sci. 125: 844–857.
Author contributions: All the authors have accepted
Canel, M., Serrels, A., Frame, M.C., and Brunton, V.G. (2013).
responsibility for the entire content of this submitted E-cadherin-integrin crosstalk in cancer invasion and metastasis.
manuscript and approved submission. J. Cell Sci. 126: 393–401.
Research funding: This research was funded by Cao, Z.-Q., Wang, Z., and Leng, P. (2019). Aberrant N-cadherin
Wilhelm Roux-program, FKZ 31/21 and Deutsche expression in cancer. Biomed. Pharmacother. 118: 109320.
Forschungsgemeinschaft (DFG, ProMoAge RTG 2155). Chaplen, F.W. (1998). Incidence and potential implications of the toxic
metabolite methylglyoxal in cell culture: a review.
Conflict of interest statement: The authors declare no
Cytotechnology 26: 173–183.
conflict of interest. The funders had no role in the design of Chaplen, F.W., Fahl, W.E., and Cameron, D.C. (1998). Evidence of high
the study; in the collection, analyses, or interpretation of levels of methylglyoxal in cultured Chinese hamster ovary cells.
data; in the writing of the manuscript, or in the decision to Proc. Natl. Acad. Sci. U. S. A. 95: 5533–5538.
publish the results. Chen, J., Xu, X., and Wang, H. (2009). Expression of integrin-alpha(3)
mRNA in meningiomas and its correlation with proliferation and
invasion. J. Huazhong Univ. Sci. Technol. 29: 94–96.
Dai, J., Ma, Y., Chu, S., Le, N., Cao, J., and Wang, Y. (2018).
References Identification of key genes and pathways in meningioma by
bioinformatics analysis. Oncol. Lett. 15: 8245–8252.
Abe, R. and Yamagishi, S.-i. (2008). AGE-RAGE system and Edlinger, M., Strohmaier, S., Jonsson, H., Bjørge, T., Manjer, J.,
carcinogenesis. Curr. Pharmaceut. Des. 14: 940–945. Borena, W.T., Häggström, C., Engeland, A., Tretli, S., Concin, H.,
Ahmad, S., Khan, H., Siddiqui, Z., Khan, M.Y., Rehman, S., Shahab, U., et al. (2012). Blood pressure and other metabolic syndrome
Godovikova, T., Silnikov, V., and Moinuddin (2018). AGEs, RAGEs factors and risk of brain tumour in the large population-based
and s-RAGE; friend or foe for cancer. Semin. Cancer Biol. 49: Me-Can cohort study. J. Hypertens. 30: 290–296.
44–55. Falone, S., D’Alessandro, A., Mirabilio, A., Petruccelli, G., Cacchio, M.,
Ahmed, N. (2005). Advanced glycation endproducts–role in pathology Di Ilio, C., Di Loreto, S., and Amicarelli, F. (2012). Long term
of diabetic complications. Diabetes Res. Clin. Pract. 67: 3–21. running biphasically improves methylglyoxal-related
Allaman, I., Bélanger, M., and Magistretti, P.J. (2015). Methylglyoxal, metabolism, redox homeostasis and neurotrophic support
the dark side of glycolysis. Front. Neurosci. 9: 23. within adult mouse brain cortex. PLoS One 7: e31401.
Antognelli, C., Moretti, S., Frosini, R., Puxeddu, E., Sidoni, A., and Gill, K.S., Fernandes, P., O’Donovan, T.R., McKenna, S.L., Doddakula,
Talesa, V.N. (2019). Methylglyoxal acts as a tumor-promoting K.K., Power, D.G., Soden, D.M., and Forde, P.F. (2016). Glycolysis
factor in anaplastic thyroid cancer. Cells 8. https://doi.org/10. inhibition as a cancer treatment and its role in an anti-tumour
3390/cells8060547. immune response. Biochim. Biophys. Acta 1866: 87–105.
Asano, K., Duntsch, C.D., Zhou, Q., Weimar, J.D., Bordelon, D., Gloushankova, N.A., Rubtsova, S.N., and Zhitnyak, I.Y. (2017).
Robertson, J.H., and Pourmotabbed, T. (2004). Correlation of Cadherin-mediated cell-cell interactions in normal and cancer
N-cadherin expression in high grade gliomas with tissue cells. Tissue Barriers 5: e1356900.
invasion. J. Neurooncol. 70: 3–15. Gogineni, V.R., Nalla, A.K., Gupta, R., Gujrati, M., Klopfenstein, J.D.,
Bellahcène, A., Nokin, M.-J., Castronovo, V., and Schalkwijk, C. (2018). Mohanam, S., and Rao, J.S. (2011). α3β1 integrin promotes
Methylglyoxal-derived stress: an emerging biological factor radiation-induced migration of meningioma cells. Int. J. Oncol.
involved in the onset and progression of cancer. Semin. Cancer 38: 1615–1624.
Biol. 49: 64–74. Goldbrunner, R., Minniti, G., Preusser, M., Jenkinson, M.D.,
Bellier, J., Nokin, M.-J., Lardé, E., Karoyan, P., Peulen, O., Castronovo, Sallabanda, K., Houdart, E., von Deimling, A., Stavrinou, P.,
V., and Bellahcène, A. (2019). Methylglyoxal, a potent inducer of Lefranc, F., Lund-Johansen, M., et al. (2016). EANO guidelines for858 P. Selke et al.: Glycation of meningioma cells
the diagnosis and treatment of meningiomas. Lancet Oncol. 17: Ostrom, Q.T., Cioffi, G., Gittleman, H., Patil, N., Waite, K., Kruchko, C.,
e383–e391. and Barnholtz-Sloan, J.S. (2019). CBTRUS statistical report:
Harrison, O.J., Jin, X., Hong, S., Bahna, F., Ahlsen, G., Brasch, J., Wu, Y., primary brain and other central nervous system tumors
Vendome, J., Felsovalyi, K., Hampton, C.M., et al. (2011). The diagnosed in the United States in 2012-2016. Neuro Oncol 21:
extracellular architecture of adherens junctions revealed by v1–v100.
crystal structures of type I cadherins. Structure 19: 244–256. Ostrom, Q.T., Gittleman, H., Truitt, G., Boscia, A., Kruchko, C., and
He, T., Zhou, H., Li, C., Chen, Y., Chen, X., Li, C., Mao, J., Lyu, J., and Barnholtz-Sloan, J.S. (2018). CBTRUS statistical report: primary
Meng, Q.H. (2016). Methylglyoxal suppresses human colon brain and other central nervous system tumors diagnosed in the
cancer cell lines and tumor growth in a mouse model by United States in 2011-2015. Neuro Oncol. 20: iv1–iv86.
impairing glycolytic metabolism of cancer cells associated with Paul, R.G. and Bailey, A.J. (1996). Glycation of collagen: the basis of its
down-regulation of c-Myc expression. Cancer Biol. Ther. 17: central role in the late complications of ageing and diabetes. Int.
955–965. J. Biochem. Cell Biol. 28: 1297–1310.
Holleczek, B., Zampella, D., Urbschat, S., Sahm, F., von Deimling, A., Paul-Samojedny, M., Łasut, B., Pudełko, A., Fila-Daniłow, A.,
Oertel, J., and Ketter, R. (2019). Incidence, mortality and outcome Kowalczyk, M., Suchanek-Raif, R., Zieliński, M., Borkowska, P.,
of meningiomas: a population-based study from Germany. and Kowalski, J. (2016). Methylglyoxal (MGO) inhibits
Cancer Epidemiol. 62: 101562. proliferation and induces cell death of human glioblastoma
Hsu, C.-C., Huang, S.-F., Wang, J.-S., Chu, W.-K., Nien, J.-E., Chen, W.- multiforme T98G and U87MG cells. Biomed. Pharmacother. 80:
S., and Chow, S.-E. (2016). Interplay of N-cadherin and matrix 236–243.
metalloproteinase 9 enhances human nasopharyngeal Pedchenko, V.K., Chetyrkin, S.V., Chuang, P., Ham, A.-J.L., Saleem,
carcinoma cell invasion. BMC Cancer 16: 800. M.A., Mathieson, P.W., Hudson, B.G., and Voziyan, P.A. (2005).
Kalapos, M.P. (2008). Methylglyoxal and glucose metabolism: a Mechanism of perturbation of integrin-mediated cell-matrix
historical perspective and future avenues for research. Drug interactions by reactive carbonyl compounds and its implication
Metabol. Drug Interact. 23: 69–91. for pathogenesis of diabetic nephropathy. Diabetes 54:
Lee, H.K., Seo, I.A., Suh, D.J., Lee, H.J., and Park, H.T. (2009). A novel 2952–2960.
mechanism of methylglyoxal cytotoxicity in neuroglial cells. Rabbani, N. and Thornalley, P.J. (2008). The dicarbonyl proteome:
J. Neurochem. 108: 273–284. proteins susceptible to dicarbonyl glycation at functional sites in
Loarca, L., Sassi-Gaha, S., and Artlett, C.M. (2013). Two α-dicarbonyls health, aging, and disease. Ann. N. Y. Acad. Sci. 1126: 124–127.
downregulate migration, invasion, and adhesion of liver cancer Rabbani, N. and Thornalley, P.J. (2012). Methylglyoxal, glyoxalase 1
cells in a p53-dependent manner. Dig. Liver Dis. 45: 938–946. and the dicarbonyl proteome. Amino Acids 42: 1133–1142.
Mège, R.M. and Ishiyama, N. (2017). Integration of cadherin adhesion Rabbani, N. and Thornalley, P.J. (2015). Dicarbonyl stress in cell and
and cytoskeleton at adherens junctions. Cold Spring Harb. tissue dysfunction contributing to ageing and disease. Biochem.
Perspect. Biol. 9. https://doi.org/10.1101/cshperspect. Biophys. Res. Commun. 458: 221–226.
a028738. Rodriguez, F.J., Lewis-Tuffin, L.J., and Anastasiadis, P.Z. (2012).
Mendonsa, A.M., Na, T.-Y., and Gumbiner, B.M. (2018). E-cadherin in E-cadherin’s dark side: possible role in tumor progression.
contact inhibition and cancer. Oncogene 37: 4769–4780. Biochim. Biophys. Acta 1826: 23–31.
Michaud, D.S., Bové, G., Gallo, V., Schlehofer, B., Tjønneland, A., Schalkwijk, C.G. (2015). Vascular AGE-ing by methylglyoxal: the past,
Olsen, A., Overvad, K., Dahm, C.C., Teucher, B., Boeing, H., et al. the present and the future. Diabetologia 58: 1715–1719.
(2011). Anthropometric measures, physical activity, and risk of Scheer, M., Bork, K., Simon, F., Nagasundaram, M., Horstkorte, R., and
glioma and meningioma in a large prospective cohort study. Gnanapragassam, V.S. (2020). Glycation leads to increased
Cancer Prev. Res. 4: 1385–1392. polysialylation and promotes the metastatic potential of
Nayeri, A., Chotai, S., Prablek, M.A., Brinson, P.R., Douleh, D.G., neuroblastoma cells. Cells 9. https://doi.org/10.3390/
Weaver, K.D., Thompson, R.C., and Chambless, L. (2016). Type 2 cells9040868.
diabetes is an independent negative prognostic factor in Schneider, B., Pülhorn, H., Röhrig, B., and Rainov, N.G. (2005).
patients undergoing surgical resection of a WHO grade I Predisposing conditions and risk factors for development of
meningioma. Clin. Neurol. Neurosurg. 149: 6–10. symptomatic meningioma in adults. Cancer Detect. Prev. 29:
Niedermaier, T., Behrens, G., Schmid, D., Schlecht, I., Fischer, B., and 440–447.
Leitzmann, M.F. (2015). Body mass index, physical activity, and Schwartzbaum, J., Jonsson, F., Ahlbom, A., Preston-Martin, S.,
risk of adult meningioma and glioma: a meta-analysis. Neurology Malmer, B., Lönn, S., Söderberg, K., and Feychting, M. (2005).
85: 1342–1350. Prior hospitalization for epilepsy, diabetes, and stroke and
Nigim, F., Kiyokawa, J., Gurtner, A., Kawamura, Y., Hua, L., Kasper, subsequent glioma and meningioma risk. Cancer Epidemiol.
E.M., Brastianos, P.K., Cahill, D.P., Rabkin, S.D., Martuza, R.L., Biomarkers Prev. 14: 643–650.
et al. (2019). A monoclonal antibody against β1 integrin inhibits Suyama, K., Shapiro, I., Guttman, M., and Hazan, R.B. (2002). A
proliferation and increases survival in an orthotopic model of signaling pathway leading to metastasis is controlled by
high-grade meningioma. Target. Oncol. 14: 479–489. N-cadherin and the FGF receptor. Cancer Cell 2: 301–314.
Nokin, M.-J., Bellier, J., Durieux, F., Peulen, O., Rademaker, G., Gabriel, Takino, J.-I., Yamagishi, S.-i., and Takeuchi, M. (2010). Cancer
M., Monseur, C., Charloteaux, B., Verbeke, L., van Laere, S., et al. malignancy is enhanced by glyceraldehyde-derived advanced
(2019). Methylglyoxal, a glycolysis metabolite, triggers glycation end-products. J. Oncol. 2010: 739852.
metastasis through MEK/ERK/SMAD1 pathway activation in Thornalley, P.J. (1996). Pharmacology of methylglyoxal: formation,
breast cancer. Breast Cancer Res. 21: 11. modification of proteins and nucleic acids, and enzymaticP. Selke et al.: Glycation of meningioma cells 859
detoxification - a role in pathogenesis and antiproliferative Wiedmann, M., Brunborg, C., Lindemann, K., Johannesen, T.B., Vatten,
chemotherapy. Gen. Pharmacol. Vasc. Syst. 27: 565–573. L., Helseth, E., and Zwart, J.A. (2013). Body mass index and the risk
Utsuki, S., Oka, H., Sato, Y., Kawano, N., Tsuchiya, B., Kobayashi, I., of meningioma, glioma and schwannoma in a large prospective
and Fujii, K. (2005). Invasive meningioma is associated with a low cohort study (The HUNT Study). Br. J. Cancer 109: 289–294.
expression of E-cadherin and beta-catenin. Clin. Neuropathol. Yin, Q.-Q., Dong, C.-F., Dong, S.-Q., Dong, X.-L., Hong, Y., Hou, X.-Y.,
24: 8–12. Luo, D.-Z., Pei, J.-J., and Liu, X.-P. (2012). AGEs induce cell death
Walker, A., Frei, R., and Lawson, K.R. (2014). The cytoplasmic domain via oxidative and endoplasmic reticulum stresses in both human
of N-cadherin modulates MMP-9 induction in oral squamous SH-SY5Y neuroblastoma cells and rat cortical neurons. Cell. Mol.
carcinoma cells. Int. J. Oncol. 45: 1699–1706. Neurobiol. 32: 1299–1309.You can also read