Going universal - The impact of free school lunches on child body weight outcomes1
←
→
Page content transcription
If your browser does not render page correctly, please read the page content below
Going universal - The impact of free school lunches on
 child body weight outcomes1
 Angus Holford

 Birgitta Rabe2
 Institute for Social and Economic Research,

 University of Essex

 Draft: this version: 6 March 2020

 Abstract
Since September 2014 school lunches – previously free for very low income students - are
available to all children in England in their first three years in school free of charge. We draw
on data from the National Child Measurement Program (NCMP) to evaluate the effect of
switching from targeted to universal free lunch provision on the body weight outcomes of
children aged 4-5, showing how the treatment effect evolves over the school year as the
cumulative dosage of exposure to free meals increases. By the end of the school year, on
average a child exposed to free lunches is 1.2 percentage point more likely to be of ‘healthy
weight’ and 0.7 percentage points less likely to be obese, and has body mass index (BMI) that
is 4.3% of a standard deviation lower than one who is not. This effect seems driven by children
not previously eligible for free meals taking them up, suggesting that the diets of relatively
well-off pupils can be improved.

1
 This paper uses data from the National Child Measurement Programme, supplied by NHS Digital, also known
as the Health and Social Care Information Centre, part of the Government Statistical Service.
This project was funded by the Nuffield Foundation (Grant EDO/43224), but the views expressed are those of
the authors and not necessarily those of the Foundation.
2
 Corresponding author. Institute for Social and Economic Research, University of Essex, Wivenhoe Park,
Colchester, CO4 3SQ. T: 01206 874594, E: brabe@essex.ac.uk

 1
1. Introduction

Childhood overweight and obesity is one of the most serious worldwide public health
problems, known to have serious implications for children’s health which carry on into
adulthood and cause significant healthcare and indirect productivity costs. Worldwide, 41
million children under the age of 5 and over 340 million children and adolescents aged 5-19
are estimated to be overweight and obese (WHO, 2018), a tenfold rise in the past four
decades (Ezzati et al., 2017). Childhood Body Mass Index (BMI) and obesity have been shown
to be strongly persistent into adulthood (Singh et al, 2008). This has made it difficult to
identify the long-term effects of child obesity independently from the effects of their
bodyweight as an adult, though individual studies have indeed shown such an effect:
Fagherazzi et al, (2013) showed obesity among prepubescent girls to be associated with an
increased risk of breast cancer post-menopause, and Tirosh et al (2011) found higher BMI
among adolescents to be associated with greater risk of coronary heart disease as an adult.
Nevertheless, whether the effects are direct or indirect, adult obesity is well understood to
be a risk factor for a wide range of diseases (OECD, 2019). Moreover, the duration of obesity
over a lifetime has been clearly shown to increase the risk of cardio-vascular disease and
cancer-related mortality (Abdullah et al, 2011). Addressing the determinants of childhood
obesity is therefore a policy priority for many governments worldwide. Because children
consume a large fraction of their food energy at school, school meal provision is an obvious
policy lever to increase rates of healthy weight among children.
This paper investigates whether providing free, high quality lunches to children in school can
contribute to tackling childhood obesity. We study the Universal Infant Free School Meal
(UIFSM) policy, implemented in England from September 2014, under which all children in
state schools are eligible to receive a free lunch during their first 3 years of schooling, at age
4-7. Before 2014, about 18% of children in these year groups were already eligible for free
lunches under a means-tested program while children who were not eligible could purchase
the same meal at cost. This setting allows us to study what happens to children’s body weight
outcomes when a means-tested school food programme is made universal across the whole
country.
Traditionally, school food programmes use means-testing to target the children most in need
of a free meal and to avoid the deadweight implied in subsidising meals for families who could
afford to pay for them. However, in recent years there has been a move towards universal
provision of free meals. The English policy is a point in case, and further examples can be
found in the US, where Obama’s 2010 Healthy Hunger-Free Kids Act allowed schools to
provide free meals to all children in high poverty areas. Several large urban school districts
have made school breakfasts and lunches free for all students (Leos-Urbel et al., 2013). These
policies often aim to raise educational attainment, social skills and behaviour, and to ensure
healthy eating in contexts where not all students take up school meals, including those eligible
to receive them for free.

 2
Making school meals universally available has been shown to address the potential stigma
attached to receiving a free meal, and to send a signal that the school lunch is a desirable
good , thereby raising participation amongst all students, not just those facing a change in
price (Holford, 2015). There may also be economies of scale in lunch provision when
participation increases under a universal scheme, and a reduction in the burden of
administering mean-testing. Further, if the meals provided in school are of high nutritional
quality and appropriate energy content, they should be of benefit to all children whose
counter-factual meal (that provided from home) is of lesser quality and of higher calorie
content. It may be reasonable to assume that the poorest families have the least means to
provide a nutritional home meal. However, means-tested targeting works with essentially
arbitrary threshold measures and is likely to miss children who would benefit from a free meal
at the margin of eligibility.3 Moreover, it has been shown that the rise in female employment
in the last few decades is associated with less time spent on home food preparation, lower
levels of fruit and vegetable consumption and consequently higher childhood obesity rates
(Caeley and Liu, 2012; Bauer et al., 2012; Moser et al., 2012; Datar et al., 2014), suggesting
that meal quality may be low even in high-income families. Based on this, we may expect
benefits from extending free meals from low income groups to all students.
Our analysis is based on anonymised school-level data from the National Child Measurement
Programme (NCMP) from the 2008/09 to 2017/18 academic years. The NCMP was set up to
monitor trends in growth patterns and obesity in England. It involves trained nurses collecting
data on the heights and weights of children in primary school, at ages 4-5 and 10-11. Every
primary school in England (approximately 16,000 in total) is visited once every academic year,
and we have data on the timing of each school visit, school-level weight outcomes and a
number of control variables for the whole country, avoiding issues of external validity.
Using these data, we use the conditionally exogenous timing of the school visit to measure
height and weight as a source of variation in duration of exposure to UIFSM among children
in their first year of primary school (aged 4-5). Those children weighed and measured early in
the school year will have had little exposure to free meals while those whose school was
visited later in the year will have had access to a larger number of free lunches, allowing us to
assess the impact of different lengths of exposure within the first school year, assuming that
the timing of the measurement is conditionally exogenous. We compare the change in
bodyweight outcomes of children throughout the school year in a difference-in-difference
framework, where children observed in the years before the introduction of UIFSM in
academic year 2014/15 serve as our control group and those observed after its introduction
are treated for varying lengths of time.4

3
 Hobbs and Vignoles (2010) document that eligibility for free school meals is not a precise proxy for family
income. While eligible children are on average in households with much lower incomes than not eligible
children, many eligible children are not in the lowest income households and many children in lowest income
households are not eligible.
4
 The existing literature suggests that exposure to school is likely to be beneficial to bodyweight outcomes. Von Hippel et
al. (2007) show that BMI of American schoolchildren increases more slowly during Kindergarten and First Grade than

 3
We find that a larger ‘dose’, or longer exposure to UIFSM, has a beneficial impact on
bodyweight outcomes. By the end of the school year (190 school days), on average a child
exposed to UIFSM is 1.2 percentage points more likely to be of ‘healthy weight’, 0.7
percentage points less likely to be obese, and has body mass index (BMI) that is 4.3% of a
standard deviation lower than a child not exposed to the policy. These are the intention-to-
treat effects of UIFSM which suggest that expanding availability of free meals in school from
about 18% of children to all children lead to modest improvements of bodyweight outcomes
in the short term.
We study the mechanisms driving these improvements by using school census and survey
data to describe changes in take-up induced by the policy. We find that children who were
always eligible for free meals increased take-up by about 2 percentage points and newly
eligible children increased it by about 50 percentage points. This indicates that while the
policy may have reduced some of the barriers to taking up free meals for always eligible
children, the impact on body weight outcomes is likely driven by changes in the diets of
children that were not eligible for free meals before they were made universally available.
This is supported by heterogeneity analysis which shows that the impact of the policy is
concentrated in schools with a low proportion (but not the very lowest) of children eligible
for FSM pre policy, and suggests that the diets of relatively well-off pupils can still be
improved. We also test whether the program improved household finances through reduced
food expenditure but find that the savings were small and therefore unlikely to generate
income effects on weight outcomes.
Most of the existing evidence on the effect of free school lunches on bodyweight outcomes
suggests that these raise the prevalence of obesity, but this is almost exclusively identified
from the effects on a small group of marginal recipients in the United States’ National School
Lunch and School Breakfast Programmes (Frisvold, 2015; Hinrichs, 2010; Dunifon and
Kowaleski-Jones, 2004; Schanzenbach, 2009; Millimet et al., 2010). For the UK, von Hinke
Kessler Scholder (2013) shows no effects of means-tested free school meal provision on child
bodyweight outcomes, but this study on the 1980s significantly predates the current policy,
and the enforcement in 2008 of improvement food and nutrient-based standards for school
lunches (see Spence et al, 2013). Alex-Petersen et al. (2017) investigate the long-run effects
of introducing free and nutritious school lunches in Swedish primary schools on a range of
outcomes. They find no effect on the probability of being overweight or obese at age 18. Our
first contribution is specifically in relation to this literature: To evaluate the move from a high
quality means-tested school meal programme to a free, universal school-based nutrition
programme.

during the summer vacation between them. Anderson et al (2011) show that after accounting for endogeneity in school
starting age, children of the same age with a year more schooling have (marginally) healthier body weight outcomes,
conducting robustness checks to demonstrate that this treatment effect is strongest for those experiencing the biggest
change in environment. Based on the data used in this paper Holford and Rabe (2019) show that pre UIFSM introduction
children’s bodyweight improved over the course of their first year in school.

 4
While several European countries provide free milk and/or fruit at school to some age-groups
on a universal basis, very few offer a full meal (Polish Eurydice Unit, 2016). Besides England,
Scotland also provides free lunch to children aged 4-7, and only Sweden and Finland provide
this throughout the whole of school. A switch to universal provision for some age groups is a
relevant policy option for the many countries that already serve meals at school and provide
these free or at reduced cost on a means-tested basis, including major economies such as the
United States, France, and Germany.
Our analysis contributes to the wider literature on the relative advantages of means-testing
vs universalism which has gained importance in policy areas such as early years policy. For
example, the provision of free early childhood education and care started out in the 1980’s
as a policy directed to families on low incomes but has in the last 20 years been expanded
substantially with many countries now offering universal childcare support (OECD, 2001),
essentially extending schooling universally provided in primary and secondary school to the
earlier years.
We also contribute to the larger debate on the role of in-kind transfers in promoting child
welfare. Since in-kind transfers constrain household consumption choices, these are generally
held to be weakly inferior to cash transfers (Currie and Gahvari, 2008), unless there is a
specific justification for supporting the consumption of certain goods by vulnerable groups.
Currie’s (1994) survey shows that narrowly targeted in-kind transfers, such as the United
States National School Lunch Program (or indeed the UK’s pre-existing means-tested Free
School Meals programme) can better serve the dietary intake (and other outcomes) of
children from low-income families than cash or broad transfers of purchasing power such as
Food Stamps. Our finding of an improvement in bodyweight outcomes for treated cohorts
show that UIFSM represents an occasion in which universal in-kind transfer can be supported
on these grounds. Parents of all socio-economic backgrounds appear to face either a time or
an information constraint (Bhattacharya and Currie, 2001) in constructing their children’s
diets that would prevent the same gains being realised were cash of equivalent value
transferred instead. Finally, we conduct cost-benefit analyses of this intervention in the
context of school-based health and bodyweight-reduction initiatives, and the value of
reduced prevalence for healthcare spending and productivity. We conclude that UIFSM has a
larger treatment effect but poorer cost-effectiveness than the physical activity or information
programmes surveyed.
The paper proceeds follows. Section 2 describes the free school meal policy and the UK
context; Section 3 presents the NCMP dataset and provides descriptive evidence on
bodyweight outcomes of children in England. Section 4 describes how we identify the
treatment effect of UIFSM, and Section 5 presents the results we obtain using this method,
heterogeneity analysis as well as a number of robustness checks. Section 6 concludes.

 5
2. Background to Universal Infant Free School Meals (UIFSM)
The Free School Meal (FSM) policy in England has historically been means-tested, with a free
meal being made available at lunch time to children of parents receiving certain qualifying
out-of-work benefits (welfare payments) or with a sufficiently low household income.
Running in parallel, the School Fruit and Vegetable Scheme has entitled every primary-school
age child to a free piece of fruit or vegetable, outside of lunch time, every school day since
2004.
Children not meeting the criteria for FSM may purchase a school meal at cost (around £2.30
per meal). Although some food-based standards for school meals have been in place since
2001, from September 2008, school meals were required to comply with both food-based
standards, determining portion sizes and the frequency with which different types of food
may be served; and with nutrient-based standards, which specify maximum and minimum
levels of intake of different nutrients, averaged over a three-week period (Spence et al, 2013,
2014). In January 2015, updated food-based standards came into force, which were designed
to embed the existing nutrient-based standards (Department for Education, 2014b).
Compliance with school food standards is assessed as part of the short-notice inspections
made by the Office for Standards in Education (Ofsted), which in England is the main
mechanism other than academic performance tables through which information about school
quality is communicate to parents and prospective parents, and head teachers and governors
are held accountable.
Students not having a school meal may bring a packed lunch from home. These lunches are
not required to comply with school food standards, though individual schools may implement
their own restrictions on what children are allowed to bring. The content of packed lunches,
being the counterfactual to school meal consumption for those induced to switch by the
UIFSM policy, are an important determinant of the effect of UIFSM on bodyweight outcomes.
While a programme of school lunches complying with the standards should average 530
calories per day, the audit study by Evans et al, (2018) found 89% of packed lunches to exceed
this level, averaging 624 calories, and only 1% of packed lunches meeting food school
standards in terms of energy and nutrients.5 Our prior is therefore that, other things equal,
we would expect a reduction in children’s bodyweight outcomes as a result of the UIFSM
policy.
The means-tested FSM system remains in place for children who are in their fourth year of
school or beyond. However, since September 2014 all infants (comprising the first three years
in school, i.e. children aged 4-7) in about 26,000 state-funded schools in England have been
eligible to receive a free school meal at lunchtime under the Universal Infant Free School
Meals (UIFSM) policy. The policy’s stated aims are to improve children’s educational
attainment; to help families with the cost of living; and to ensure children have access to a

5
 Moreover, one-third of packed lunches surveyed contained a sweet snack, processed savoury snack and
sweetened drink.

 6
healthy meal a day and develop long-term healthy eating habits (Department for Education,
2013; Cabinet Office, 2013). The policy was announced in September 2013. Capital funding
for necessary enhancements to kitchen and dining facilities, totalling £150m, was allocated
to Local Education Authorities (LEAs) in December 2013, with a further opportunity for
schools to bid, through their LEA, for a share of a further £15m in October 2014; and a further
£10m allocated (£8.5m through LEAs, the rest directly to schools) ahead of the 2015-16
academic year. Revenue funding of £2.30 per universal infant free school meal served (£437
per year) is provided to schools, calculated based on take-up on a census day in January each
academic year. 7/12ths of a projected allocation is provided in July of the preceding year, and
the remaining balance in July of the current academic year. This figure of £2.30 per meal has
remained constant in nominal terms since the policy’s introduction.
 The then-government’s case for UIFSM was largely based on evaluations carried out of earlier
pilot schemes for universal FSM entitlement in three local education authorities (LEAs) in
2009/10 and 2010/11 academic years, with Brown et al. (2012) showing a significantly faster
improvement in educational attainment for pupils exposed to free lunches in these pilots.
While children were more likely to eat vegetables at lunchtime there were no significant net
changes in consumption of any types of food or drink over the whole day, with the exception
of those exposed to free lunches becoming less likely to eat crisps. The authors found no
evidence of changes in Body Mass Index for children exposed to free lunches. However, the
authors caution that it was not clear that the positive outcomes of the pilot (such as were
found) would be repeated in the roll out of free school meals to all infant pupils across the
country. This is because the pilot took place in two relatively deprived local authorities and
the benefits might be lower in more affluent areas, and because the pilot included a host of
supporting activities around awareness and encouragement of take-up. These are not
included in the UIFSM policy, so the impact of offering universal free meals may be
dampened. Conversely however, it is also possible that by implementing a universal policy
that parents know their child will be entitled to for three years, parents and children will be
more likely to see participation as the social norm. If a habit is formed, parents may be less
likely to see UIFSM as a marginal input that is a substitute for their own effort in providing
healthy food during the rest of the day (see examples of substitution of effort in De Fraja et
al, 2010).

 3. Data

The National Child Measurement Programme has collected data on the heights and weights
of children in all 16,000 primary schools in England each academic year since the 2005/06
school year. The programme was set up in line with the government's strategy to tackle
obesity, and aims to gather population-level data to allow analysis of trends in growth
patterns and obesity, inform local planning and delivery of services for children of the NCMP
and to be a vehicle for engaging with children and families about healthy lifestyles and weight
issues (NHS Digital, 2018a). Prior to September 2013 commissioning and implementing NCMP

 7
measurements was the responsibility of the local NHS Primary Care Trust (PCT), but after this
it became the responsibility of Local Education Authorities (LEAs). (Later in our analysis we
will use this legislation change both as a placebo and to evaluate any change in measurement
quality).

The bodies implementing the NCMP visits receive a detailed level of operational guidance
both for arranging the visits and communicating with parents, and for taking the
measurements themselves. They are also advised of the data quality checks that will take
place, such as whether an unexpectedly large proportion of children are recorded with whole
or half-kilogram weights, or whole-centimetre heights (see operational guidance in NHS
Digital, 2018a). There were no restrictions on the timing of visits during the school year, save
for the need agree a mutually convenient day with the school, to notify parents in advance,
and to have filed all results with the NHS by August following the end of the school year.
Parents did not need to consent to their child’s participation, but did have the opportunity to
opt their child out of measurement. Participation rates among Reception children rose from
approximately 83% in 2006/07 to 90% in 2009/10, and have been stable between 93% and
95% since.6

Each visit entailed recording the height and weight of each pupil in their first and last year of
primary school (at ages 4-5 and 10-11), in order to derive their body mass index and classify
them as underweight, healthy, overweight or obese. These classifications are calculated
according to the British 1990 growth reference charts for their age and sex, with
‘underweight’ corresponding to the 2nd percentile and below, ‘overweight’ to the 85th
percentile up to less than the 95th, and obese to the 95 th percentile and above. Schools and
Local Authorities are encouraged to inform parents of their child’s measurements in a
confidential manner, but any treatment effect of this information will not be observed in our
data. We do not expect any anticipation effects to vary with the timing of the school visit.

Our NCMP data extract covers academic years 2007/08 to 2017/18 and focuses on children
in their first year in school, aged 4-5 (the UIFSM policy only covers children aged 4-7). The
data is anonymised at the school level, documenting the date (week-commencing) of the visit,
the percentage of children measured who fall in each weight category and the mean BMI ‘z-
score’. This reports the standard deviations above or below the British 1990 growth reference
charts mean, adjusted by age in months and sex among the children measured. In what
follows ‘standard deviations’ refer to the 1990 age-adjusted distribution. We will use the BMI
z-score as well as the percentage of children who are obese and normal weight as our main

6
 The NHS was concerned that selective non-participation would cause bias in estimates of bodyweight outcomes, so until
2011 reported on the relationship between participation rates and obesity prevalence. They concluded that while non-
participation did result in underestimates of the obesity rate for students aged 10-11, it had a negligible relationship for
children in their first year of school. From the 2011/12 academic year onwards, this analysis has not been conducted,
because the response rate is considered sufficiently high. (Historical NCMP reports, including information on participation
rates and national and local authority trends, can be found at NHS Digital, 2018b).

 8
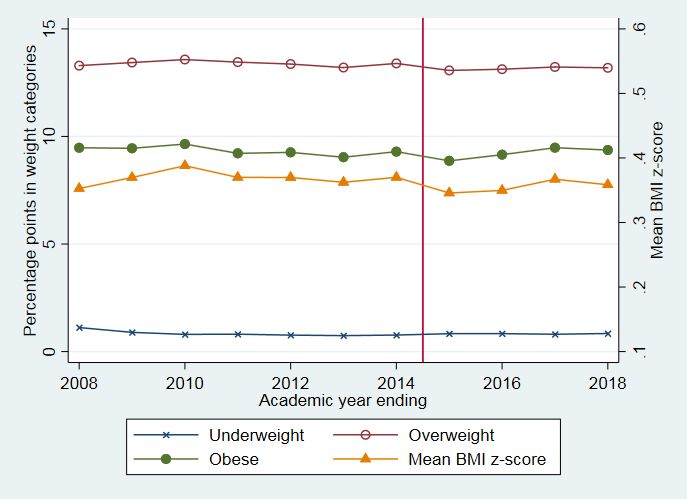
outcomes.7 Our data also include the percentage of children who are female and who are of
black ethnicity, but not any cross-tabulations of these characteristics.

We additionally supplied publicly available data on the characteristics of each school to NHS
Digital, who linked these to the NCMP data before releasing the extract. Those characteristics
we use in our analysis are the school’s involvement in a pilot scheme for universal or extended
Free School Meals that year; and the Income Deprivation Affecting Children Index (IDACI) for
the neighbourhood where the school is situated, the rate of means-tested eligibility to free
school meals and take-up of by FSM-eligible students across the whole school for all years8 all
converted into quintiles (across school-year points) to maintain anonymity of the schools in
question. Our data does not enable us to weight schools in our analysis in proportion to their
size. Using data on school size and its variation across primary schools in England we perform
simulations which show that omission of weights is unlikely to lead to sizeable biases of our
results (see Section 5).

We exclude school-years with missing data or for which the timing of the visit by half-term
cannot be established, but include schools that closed or first opened during this 11 year
period. In our final analysis sample we use only measurements taken in academic year ending
2009 and onwards, once the enhanced school food standards were fully in force, leaving us
with 17,776 different schools and 154,169 visits.

In Figure 1 we show the mean across schools of the proportion of students aged 4-5 in each
weight category, and the mean BMI z-score, for each academic year ending 2008-2018. Figure
1 shows that overall, the proportion of children measured as being underweight, overweight
or obese remains fairly constant over the period of the data, with 1-2% underweight (the
relative drop between 2008 and 2010 is large, but small on the scale of this graph), 13%
overweight and just under 10% obese (so 23% ‘at least overweight’). The remainder are
‘healthy weight’, not shown due to the different scale. There is no discernible jump in any of
these outcomes for the academic year-ending-2015 when UIFSM was introduced, or
subsequently. The secondary axis in Figure 1 shows children’s BMI z-score, which varies within
the narrow range of only 4% of a standard deviation between its peak in 2010 and lowest
point in 2015. There is a substantial drop in mean BMI for the first year of UIFSM, but a
subsequent rise.

Our focus in this paper is on the development of bodyweight outcomes within the first school
year. The school year in England comprises 190 teaching days spread over 39 weeks between
early September and late July.9 The school year is divided into three terms, the autumn term
starting in September and ending at Christmas, the spring term from January to Easter and

7
 Underweight has a very low prevalence in the population of 1-2% and overweight mostly mirrors healthy weight
prevalence, since this is the main discrete margin affected by underlying changes in the distribution of BMI.
8
 About 16% of school students have been eligible for free meals based on a means test throughout our period of
observation. This means that 84% of students were newly eligible under the UIFSM policy.
9
 There are 5 ‘inset days’ usually for teaching training, and usually timed at the start or end of a holiday.

 9
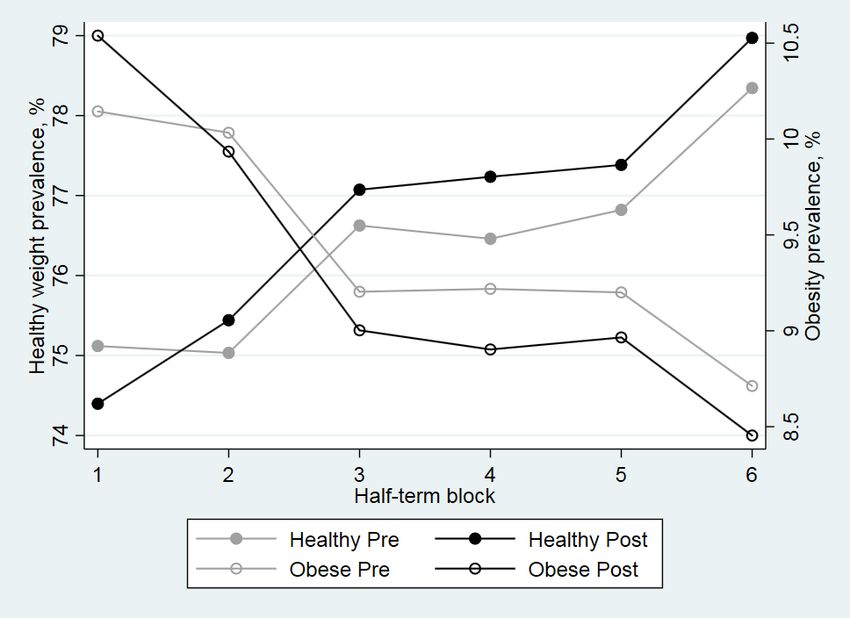
the summer term from after the Easter holiday to the third week of July. Each of these three
terms is broken up by a one week “half-term” holiday in October, February and May so that
the school year consists of six half terms each of roughly 6-7 week length, depending on where
Easter falls in each year. We assign all measurements to half-term blocks. However, not all
schools have exactly the same holidays; this depends on the policy of the local authority (LA)
and can vary especially around the Easter holidays. Because we do not have an LA identifier
that would allow us correctly to assign every school visit to the correct half-term block, we
assume that the Easter weekend is always incorporated into a school holiday. We allow Easter
to be at the beginning, middle or end, and drop all the school weeks for which we cannot be
sure whether the visits made should be assigned to the preceding or the subsequent half-
term.

Figure 2 presents descriptive evidence of the development of BMI across the six half terms of
the school year, separately for the pre- and post-implementation years. Based on the raw
data we see that overall children tend to become lighter (for their height) over the course of
the academic year, suggesting that the school (versus home) environment is relatively
beneficial for bodyweight outcomes. Moreover, while BMI was higher for the cohorts that
benefited from UIFSM in the first half term block, from the second half term block onwards
BMI is consistently lower for children in receipt of UIFSM, in the post-period, by around 1-4%
of a standard deviation. Figure 3 shows that similar relationships hold for our threshold
measures, the percentage of children who are obese and who are healthy weight, with
obesity rates being lower and healthy weight rates higher for children under UIFSM that pre-
UIFSM. This indicates that the policy may have improved bodyweight outcomes for children
in their first year in school. Of course the associations shown are not causal relationships and
the next section will discuss how we go about identifying an effect that comes as close as
possible to a causal one.

 4. Identification strategy

The UIFSM programme was introduced simultaneously across the whole of England in
September 2014. Because the NCMP is only conducted in England there is no experimental
variation in exposure to UIFSM across schools, or ‘control group’ of similar schools recorded
in our data which were not exposed to UIFSM. However, we do have information on the date
schools were visited for height and weight measurement both before and after UIFSM was
introduced, and this allows us to compare children who were exposed to the policy for
different durations at the time they were weighed and measured with children who were not
exposed to the policy but weighed and measured at the same time of the year. We expect
the impact of UIFSM to depend on the ‘dose’ of free meals received, so that a greater effect
should be observed for children at the end of the first year in school (after up to 190 meals)
than for children just starting school for the first time. That is, for a school visited at the start
of the school year in September, once accounting for other underlying trends there should be

 10
little difference in the BMI between a cohort of children entering reception in 2013-14 (pre-
implementation) and 2014-15 (post-implementation), while if exposure to UIFSM does affect
this outcome, the difference should be progressively larger in a school visited, say, in the
spring and summer.

Using this set-up and the six half-term blocks described earlier to measure duration of
exposure we formulate a difference-in-difference model as follows:

 = ∑6ℎ=1 ℎ + + ∑6ℎ=1 ℎ ( × ) + + + , (1)

where is the mean of the outcome recorded in school in year , is the half-
term of NCMP visit in school s in school year t and can take a value from 1 to 6, is a
dummy variable that switches on for the UIFSM policy years, is a vector of controls that
varies across school and time, is a school fixed-effect, and a normally distributed error
term. The intention-to-treat effect for each half-term block in this equation is given by +
 ℎ . We estimate equation (1) using linear models on our school-level data.

The direction of the expected effect is indeterminate. Children’s BMI will increase if their
energy intake relative to expenditure increases, and vice versa. Assuming no change in energy
expenditure, the effect will depend on how calories consumed in meals prepared in school
compare to those provided from home, usually in the form of a packed lunch. If the energy
intake from a school lunch is higher than what children would otherwise have consumed in a
packed lunch, net of any crowding out of calories provided by parents or in childcare at other
times of the day, their BMI will increase, and vice-versa. Secondly, the effect will depend on
the number and composition of children induced by the policy to eat a school lunch, rather
than a packed lunch from home. We describe changes in take-up rates below.

Identifying assumptions

In order for our difference-in-difference regression to yield causal estimates of the impact of
the UIFSM policy on bodyweight outcomes we need to make two identifying assumptions.
These are (1) that conditional on the controls included in our model, bodyweight outcomes
would have evolved in the same way over the school year in the post-UIFSM as pre-UIFSM
years, had the policy not been introduced (parallel trend assumption), and (2) that the timing
of NCMP visits to schools did not change between the pre-and post-UIFSM period in a way
that was related to any unobserved factors affecting bodyweight outcomes. We discuss the
steps we take to defend these assumptions in turn.

The parallel trend assumption could be violated if there were other policies introduced during
the period of our analysis, which had an effect on bodyweight outcomes that are not
otherwise accounted for. As discussed in the introduction, there were Department for
Education pilot schemes for universal or extended means-tested entitlement to Free School
Meals, and a number of other pilots run at the initiative of local authorities over the years

 11
preceding UIFSM. We capture and control for these using six dummy variable categories, also
interacted with half-term block, in all our regression specifications.

Another potential policy is the pupil premium, extra funding made available to schools for
each student eligible for free lunches plus a small number of other pupil groups (e.g. children
adopted from care) which could potentially affect children’s bodyweight. The funding per
student increased uniformly across the country, but non-linearly year-by-year from £430 in
the academic year 2012/13 to £1320 in 2017/18. We approximate the premium available to
schools as the average across all the pupils in the school in each year, calculated using the
mean proportion of free lunch eligible children in each of the quintile bands and the size of
the pupil premium amount, allowing this to have differential effects pre-and post-UIFSM.

Moreover, we control for the percentage of children measured at each visit who were girls
and who were of black ethnicity, since these groups are expected to exhibit lower and higher
prevalence of overweight or obesity than boys and non-black pupils respectively, and school
level outcomes will therefore be sensitive to changes in proportions of these variables. (This
is despite sex directly being accounted for in defining the threshold measures. Ethnicity is
not.) We also include a cubic-time-trend interacted with both these variables to discount any
differential growth in the prevalence of obesity or overweight between years by sex or by
ethnic group, that may arise from these groups’ different metabolic response to the same
prevailing environmental changes. Likewise, we include a cubic time-trend specific to the
neighbourhood ‘Income Deprivation Affecting Children Index’ (IDACI) quintile, to
accommodate the widening of the gap in outcomes between schools in the most and least
deprived neighbourhoods. (The IDACI is time invariant within schools, so cannot be included
as an independent regressor). We also include the means-tested FSM eligibility rate of the
school (in quintiles), and a school fixed effect in our model to control for time-invariant school
factors affecting outcomes.

Because all schools received the UIFSM treatment from academic year-ending 2015 onwards,
we cannot perform a conventional test of the assumption of parallel trends between a treated
and control group in the pre-treatment period. Instead, the relevant test is for parallel trends
over time between ‘low-dose’ schools, visited in the first half-term of the school year, and
‘high-dose’ schools, visited later in the school year.

We know from Figures 2 and 3 that children in schools visited later in the school year tended
to have better bodyweight outcomes even in the pre-treatment period. We would be
concerned for our identification strategy if we were also to see a systematic relative
improvement in bodyweight outcomes for ‘high-dose’ schools over ‘low-dose’ schools
beginning in the pre-treatment period. This would suggest there is another unobserved time-
varying factor serving to increase the beneficial effect of the school environment on child
bodyweight outcomes that may be driving our results.

 12
Formally, for the pre-treatment period we run a school fixed-effect regression of bodyweight
outcomes on an exhaustive set of half-term by year interactions:

 = ∑6ℎ=1 ∑2014
 =2009 ( × ) + + + (2)

For each year and half-terms the difference in coefficients ( − 1 ) provides a measure
of the conditional improvement in observed bodyweight outcomes since the start of the
school year. In Table 1 we present estimates of the difference-in-difference ( 6 − 1 )-
( 6,2014 − 1,2014), representing the effect of one academic year’s exposure to the school
environment in year , relative to the final year before UIFSM was introduced. For only one
outcome in one academic year do we ever observe a statistically significant (and only at 10%)
deviation from a constant school environment effect over this period. The magnitude of
changes in some individual point estimates between years does underline the importance of
identifying our treatment effect from multiple years of post-treatment data, and testing the
sensitivity of our results to each specific post-treatment year, but there is no support for a
systematic trend in the effect of the school environment beginning prior to 2015. While the
BMI z-score estimate does become smaller (more negative) for the last two consecutive years,
the change is statistically and quantitatively insignificant. The likelihood that this is down to
chance is supported by the trends in healthy weight and obesity point estimates switching
directions over this period, while staying close to zero the long-run mean.

Our second identifying assumption relates to the timing of measurement. Bodyweight
outcomes will be representative of the children in England for each half term only if the timing
of visits by NCMP is random across schools. In particular, we may expect a bias from our
estimation if any pattern in the timing of visits changed between pre- and post-UIFSM
introduction. For example, if NCMP had the habit of visiting schools with the smallest concern
over obesity first in each academic year but changed this to late visits in recent UIFSM years,
our results would overstate the beneficial effect of the policy. According to the organisation
implementing the NCMP, the timing of visits was organised around local considerations such
as staff and school availability, coordinated to coincide with other health checks in the school,
and not systematically linked to criteria such as disadvantage.10

Table 2 displays the distribution of NCMP school visits across half-term blocks for each
academic year during our observation period. The Table shows that schools were visited
across all of the half-term blocks, albeit with more visits in the middle of the school year than
at the beginning and end. We also see that the pattern of visits has changed slightly over the
years, with a shift towards visits earlier in the year.

To investigate whether these shifts in timing were accompanied by shifts in school student
composition we conduct the following check using the observable student characteristics
available to us. We run similar regressions to equation (1) above, but using school-level child

10
 Source: Email by NCMP programme support manager dated 2 April 2019.

 13
characteristics as outcomes. The coefficients on the half-term x UIFSM interactions will tell us
whether schools with the characteristic in question were more likely to be visited in a
particular half-term block post than pre UIFSM. Table 3 displays the results for three
characteristics: the percentage of students of black ethnicity, the percentage who are girls,
and the quintile of the proportion of students eligible for free lunches (entering linearly). We
see in column (1) that schools visited in the first half-term of the school year have a higher
proportion of black students after UIFSM introduction than before. However, the effect is
very small at 0.3 percentage points, or 9% of a within-school standard deviation. We see in
column (3) that schools visited in the middle of the school year are more likely to be in higher
quintiles of Free School Meals registration after UIFSM than before. Again, the effect size is
very small, equivalent to a movement of less than 2.5% of a quintile, 0.5 percentiles, or 4% of
a within-school standard deviation. Nevertheless this exercise underlines the importance of
controlling for the FSM registration quintile in the analysis. The proportion of girls in the
measured cohort is never significantly (or by a quantitatively important magnitude) predicted
by the timing of the visit.

To ensure our identifying assumption holds by accounting for these small shifts in timing by
black composition, and the possibility that metabolic differences by ethnicity and sex make
the body weights of black students and girls differentially responsive to the duration of being
in school and to UIFSM, we therefore control for interactions of both these variables with the
half-term block. We demean both the proportion black and proportion girls within schools,
so as to leave the interpretation of coefficients on our main ( × ) terms
unchanged.

 5. Results

Table 4 presents the treatment effects of UIFSM on the prevalence of healthy weight and
obesity, and the mean BMI z-score for each half-term of the school year, estimated using
linear regression of equation (1). For each bodyweight outcome, column (1) shows results
when controlling for free meals pilot schemes, column (2) adds demographic characteristics
and time trends, and column (3) subsequently adds interactions of demographic
characteristics with time trends and half-term blocks. We can see that the estimated
coefficients are relatively stable across these different specifications and none of the
differences we find are statistically significant. As expected, in the first half-term of the school
year when there has been little exposure to UIFSM, there is no statistically significant
treatment effect of UIFSM on bodyweight outcomes. For every later half-term, UIFSM has a
beneficial effect on bodyweight (positive for healthy weight, negative for obese, and BMI z-
score) which for all cases is statistically significant at the 1% level.

The size of the treatment effect does not get significantly larger after the second half-term
block in November for the remainder of the school year, either in statistical terms or

 14
quantitative importance. This suggests that while the differential between children’s calorie
intake and expenditure is initially negatively affected by UIFSM, they reach a new steady state
fairly quickly. This is not surprising since the overall effect sizes are small. The estimated
effects show that children eligible for UIFSM are between 0.75 and 1.2 percentage points
more likely to be a healthy weight (relative to a pre-policy average of 76%), between 0.6 and
0.9 percentage points less likely to be obese (relative to a pre-policy average of 9.4%); and
have a BMI between 2.8 and 4.3% of a standard deviation lower (relative to a pre-policy
average that is 37% of a standard deviation above the 1990 average). To put this into context,
a 2.8% standard deviation reduction in BMI z-score corresponds to about 43g of absolute
weight change for boys and 50g for girls of this age.11

Compared to other bodyweight reduction interventions that have been trialled in the UK, the
impact of the UIFSM policy is large. An education-based intervention involving 16 lessons on
healthy eating, physical activities and reducing sedentary activities had no effect on BMI
(Kipping et al., 2008).12 Similarly, a physical activity program in Scotland comprising 3x30
minutes of high-intensity physical activity per week for 24 weeks for 4-year olds found no
overall reduction in BMI (Reilly et al., 2006). The ‘Daily Mile’, which entails primary school
children walking or running outside for 15 minutes each day improved physical fitness and
reduced body fat proportion but reduced BMI by only 0.8% of a standard deviation over the
course of an academic year (not statistically significant), so it appears to generate benefits of
at most 20% the size of UIFSM (Chesham et al., 2018).

Figure 4 presents the estimated treatment effects obtained from specification (3), with full
controls, over the course of the school year and with 95% confidence intervals. This reveals a
pattern in the effects across half-term blocks, in which the treatment effect is smaller in the
first half-term block of each term (i.e. those beginning September, January and Easter) than
in the corresponding second half-term block of each term (November, March and June). The
second half-term blocks of each term follow short, one-week holidays, whereas the first half-
term blocks follow holidays of at least 2 week length. Though these differences are not
statistically significant, this seems to suggest that there is some reversion in holidays, and a
benefit from longer or less interrupted exposure to UIFSM.

11
 Our measure of BMI is provided as the mean ‘z-score’ (i.e. standard deviations from the mean) with respect to the British
1990 Growth Reference Charts. The coefficient of variation (in percentage points) at age five-and-a-half for these charts is
7.6 for boys and 9.25 for girls, for a mean BMI of 15.5 / 2 (Cole et al, 1995). This implies standard deviations =
0.076 × 15.5 = 1.178 / 2 and = 0.0925 × 15.5 = 1.43375 / 2 . At heights of 113.1cm for boys and 111.8cm
for girls, this means a one-standard deviation change in BMI corresponds to the following change in weight, =
1.178 × 1.1312 = 1.507 and = 1.43375 × 1.1182 = 1.792 . This means that 1% of a standard deviation
change in BMI, or a change in the BMI z-score of 0.01, corresponds approximately to a change in weight of 15g for boys and
18g for girls.

12
 Better results were found for the Healthy Schools Network scheme in Denmark, involving schools sharing
best practice over health and physical educations and a measurement program. This achieved a 0.010-0.015
reduction in BMI (albeit not statistically significant) and reduced the prevalence of obesity by 1% (Greve and
Heinesen, 2015).

 15
Mechanisms

As discussed earlier, we may expect benefits of moving from a targeted, means-tested school
food programme to universal provision of free meals to arise from different sources. They can
come from increasing take-up among children who would have been eligible under means-
testing but not taking up their meal, for example because of the stigma sometimes associated
with targeted benefits. They can also come from not eligible children who would not have
taken up a paid-for meal and are taking it up because the policy makes it free. Finally, they
can result from an improvement of household finances as a result of reduced food
expenditure that positively affected children’s weight status.
We first describe how take-up changed among eligible children in the years before and after
UIFSM introduction.13 The data are somewhat noisy as we have take-up rates among all free
meal eligible students in the school for the years before the UIFSM policy was introduced
(spanning Reception year to year 6 in most schools) and among eligible students in the first 3
years of schooling for the post UIFSM years. This should give a correct picture if take-up
patterns do not vary across primary school years. Figure 5 shows how take-up developed for
eligible children between academic years 2006/2007 and 2016/2017, separately by the
proportion of children eligible for free meals in the school, measured in quintiles. Both in the
pre and post policy years there is no clear pattern as to whether take-up is higher in schools
with higher or lower proportions of children on free meals. Stigma effects could be lower in
schools where many children take free meals, but this is not reflected in differential take-up
rates. The figure shows that take-up was around 85% in the pre policy years and rose by
around 2 percentage points to 87% in the first year UIFSM was introduced and remained
stable in the next two years. Again, the small increase in take-up does not seem to differ by
the proportion of children eligible for free meals, again suggesting that stigma effects were
not driving the changes in take-up.

Figure 6 compares take-up between children eligible and not eligible for free meals for the
same time-period. There are no consistent data on take-up for not eligible children in the pre
policy years, but there have been different surveys and local authority-level data returns run
over the years so that each data point is from a different source (see notes to the Figure for
details). In the pre-policy years take-up among not eligible children was just over 30%,
documented across the different data sources. Once meals became free in academic year
2014/15 around 85% of children were eating them – an increase of more than 50 percentage
points. All families were able to purchase a school meal before these became free, so it seems
that the cost of around £2.30 per meal was a sufficient disincentive for a high proportion of
families. In summary, the UIFSM policy resulted in small proportions of previously eligible

13
 Note that eligibility for free meals is still recorded post UIFSM introduction because school funding allocations
depend on children’s free school meal status, among other factors. Schools therefore pushed parents to register
for free meals, but registration rates dropped from an average of 19.2% among 4-7 year olds in the 3 years
preceding the policy to 15.2% in the 3 post implementation years.

 16
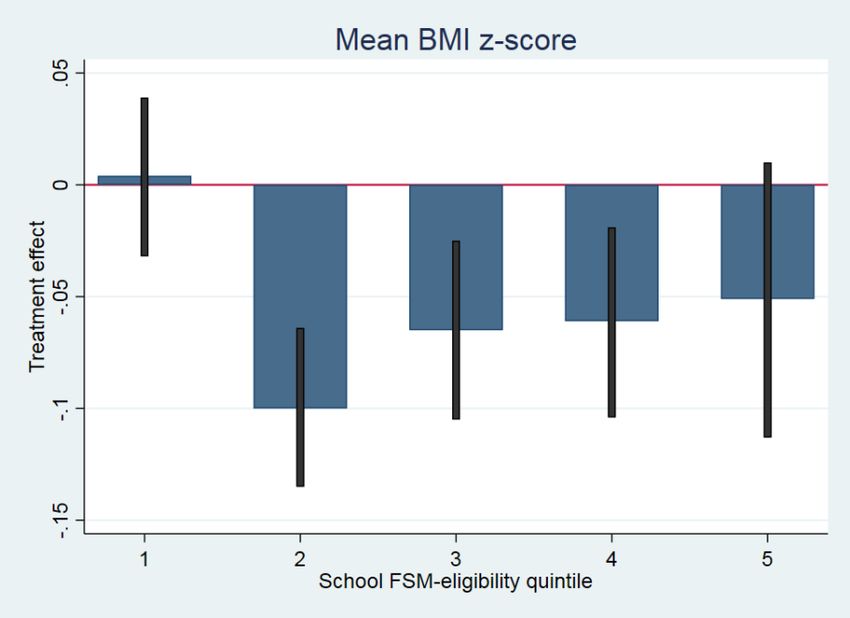
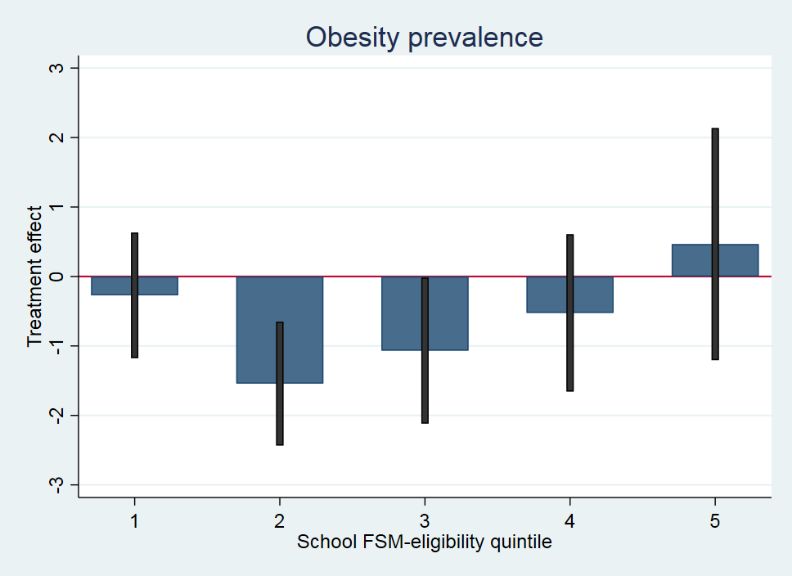
children to start eating school meals, and to very large increases in the proportions of not
eligible children having meals.

This does not imply that the main impact of the policy was on not eligible children. It could be
that all the benefits of the policy were concentrated on the few FSM eligible children who
were induced by the policy to take up meals. One way to investigate this is by analysing
treatment effects by the proportion of FSM-eligible children in the school. If the impact of
UIFSM was concentrated in high FSM-eligibility schools that would indicate that benefits
accrued to FSM eligible children. In Figure 7 we present the June half-term treatment effects
by the school’s FSM-eligibility quintile (measured in the academic year-ending 2015). In the
first quintile, between 0 and 4.4% of children were FSM-eligible. In the fifth quintile at least
27%, and an average of 38%, were FSM-eligible. This means that even in the fifth quintile,
most of the rise in take-up will still be accounted for by not-eligible children (assuming within-
group rises in take-up of 2 and 50 percentage points respectively, on average in the fifth
quintile the FSM-eligible and not-eligible groups will contribute rises in overall take-up of 0.76
and 31 percentage points respectively). Figure 7 shows a non-linear pattern whereby for all
three outcomes we find a zero treatment effect for the lowest FSM-eligibility quintile, but a
significant large beneficial effect for the second quintile (between 4.4% and 8.7% FSM-
eligible). Above this, there is a markedly different pattern between outcome variables. For
the mean BMI z-score, treatment effects remain at over 5% of a standard deviation, larger in
magnitude than 5% of a standard deviation than found for the whole sample, only losing
significance due to its smaller sample size. For healthy weight, there is imprecision and no
consistent pattern, although the third to fifth quintiles are all smaller in magnitude than for
the second. For obesity however, the treatment effect becomes smaller in magnitude for each
successive higher quintile, even changing sign for the highest quintile.

Our consistent finding across these outcome variables that children in schools in the lowest
quintile of FSM-eligibility do not benefit from UIFSM is in line with Alex-Petersen et al. (2017)
who found benefits from free, nutritious school lunches in Sweden for all households except
the richest. School-level FSM-eligibility is negatively correlated with average household
incomes (ref?). Our finding cannot be explained by the absence of a rise in take-up, so must
instead reflect the counterfactual meals of children in these schools being very similar in
energy content to the free school meals. This result is indicative of households in the lowest
quintile having either sufficient disposable income or disposable time (perhaps from a
discretionarily non-working parent) and education to be able to produce appropriately
balanced lunches at home, in contrast to those in higher quintiles where either an income,
time or information constraint is more likely to bind. The peaking of the treatment effect in
the second quintile suggests that time is likely to be the most important in this regard,
indicating that the diets of relatively well-off pupils can still be improved. The lack of a
beneficial treatment effect on obesity in the poorest (highest FSM-eligibility) schools suggests
that there is a subset of income-constrained or low-educated households in which parents

 17
respond to the UIFSM transfer by reducing the quality of the food provided to the affected
children during the rest of the day.

We can use the changes in take-up rates for a back-of-the-envelope calculation of the
treatment effects on the treated. Take-up increased by roughly 40% across all children
(eligible and not eligible taken together). Dividing our intention to treat estimates from Table
3 by 0.4 would indicate that among children taking school meals because of the UIFSM policy
increased the likelihood to be of healthy weight by 3 percentage points (3.9%), reduced the
likelihood to be obese by 1.8 percentage points (19%) and the average BMI by 10.8% of a
standard deviation by the end of the first year in school among treated children. These effects
are considerable.

Robustness checks

We investigate whether our estimated treatment effects are driven just by one particular year
of UIFSM. We conduct this exercise in light of observing children’s bodyweight outcomes
broadly to deteriorate in 2016 and again in 2017, relative to 2015 (see Figure 1). It is possible
that the beneficial treatment effects of UIFSM could be driven by greater efforts to increase
consumption of school meals, and information campaigns perhaps resulting in dietary
improvements also outside of school, in the first year of its introduction.

In columns (1-4) of Table 5 we show separate results for BMI z-score obtained by excluding
one year of UIFSM exposure from the data at a time. The overall pattern from the main results
is retained, though three things are noteworthy. Firstly, when we exclude 2015, the
November and January half-term treatment effects are markedly smaller than for other years,
though still statistically significant. Secondly, when we exclude 2018, the first half-term does
show a beneficial treatment effect. This is consistent with bigger efforts being made early in
the 2014/15, and to a lesser extent 2015/16 and 2016/17, academic years, to encourage
take-up resulting in larger treatment effects more quickly. Third, the June treatment effect
becomes progressively smaller as we exclude later years, indicating that schools have become
more successful over time at retaining take-up of UIFSM and the benefits thereof, over the
school year.

Our data does not allow us to weight schools by their size. We assess the bias that may arise
from omitting to weight for school size by carrying out a simulation as follows. We use the
raw, unlinked school characteristics data to predict school size as a function of the same
characteristics that are available to us in our linked estimation sample, namely year, FSM-
eligibility quintile, FSM take-up quintile, IDACI deprivation quintile, and whether the school
was exposed to a pilot scheme for UIFSM in that year. Using this auxiliary regression, we
predict the school size for the schools in our data and add error to it which we randomly draw

 18
You can also read