GOLD COAST SEAWAY SMARTRELEASE PROJECT - SYNTHESIS REPORT - BROADWATER ...
←
→
Page content transcription
If your browser does not render page correctly, please read the page content below
Gold Coast Seaway
SmartRelease Project
             Synthesis Report
Table of contents
1    Introduction ..................................................................................................... 6
     1.1 Background ............................................................................................... 6
     1.2 Study Area ................................................................................................ 7
     1.3 Study Scope .............................................................................................. 7
     1.4 Report Structure......................................................................................... 8
2    Project Overview .............................................................................................. 9
     2.1 Project Objectives....................................................................................... 9
     2.2 Project Components .................................................................................... 9
     2.3 Peer Review Process ................................................................................. 10
3    Monitoring ...................................................................................................... 12
     3.1 Scope ..................................................................................................... 12
     3.2 Phase 1 – Hydrodynamic Monitoring ............................................................ 12
     3.3 Phase 2 – Design Water Quality Monitoring Program ...................................... 13
     3.4 Phase 3 – Undertake Water Quality Monitoring Program ................................. 16
     3.5 Outcomes................................................................................................ 17
4    Modelling........................................................................................................ 19
     4.1 Scope ..................................................................................................... 19
     4.2 Model Set Up ........................................................................................... 20
     4.3 Model Calibration...................................................................................... 22
          4.3.1   Hydrodynamic Model Calibration ..................................................... 22
          4.3.2   Spectral Wave Model Calibration ..................................................... 25
          4.3.3   Advection Dispersion Model Calibration ............................................ 26
     4.4 Scenario Modelling.................................................................................... 27
     4.5 Results of Scenario Modelling ..................................................................... 29
     4.6 Summary of Modelling Results .................................................................... 35
5    Decision Support System (DSS)...................................................................... 37
     5.1 Scope ..................................................................................................... 37
     5.2 System Development ................................................................................ 37
     5.3 User Interfaces......................................................................................... 40
     5.4 System Delivery ....................................................................................... 42
     5.5 Outcomes................................................................................................ 43
6    Conclusions .................................................................................................... 44
7    References...................................................................................................... 46

«ReportName»                                     «Date»                                                         «Version»

                                                                                                               Page 2 of 47
Executive Summary
Supporting ever increasing residential and tourist populations, the Gold Coast is one of the
fastest growing cities in Australia. This unprecedented population growth is placing increasing
demands on the city’s infrastructure and services, including the recycled water release system.
In response to this challenge, Allconnex Water initiated a number of studies in partnership with
the Griffith Centre for Coastal Management and DHI Water and Environment in search of a
sustainable release system to support future population projections.
With excess recycled water currently released at the Gold Coast Seaway utilising an ebb-tide
staged system, the Broadwater Assimilative Capacity Study (BACS) demonstrated that this
estuarine system has capacity to meet future needs for recycled water release without
compromising the water quality of the receiving waters. As an outcome of the BACS, the
Queensland Department of Environment and Resource Management (DERM) approved an
extension (2008) to the existing release window under the Development Approval for the
Coombabah wastewater treatment plant (WWTP).
To manage this additional release time responsibly, Allconnex Water initiated the Seaway
SmartRelease Project in collaboration with DHI Water and Environment and the Griffith Centre
for Coastal Management to deliver a suite of sophisticated state-of-the art hydrodynamic and
advection-dispersion models to optimise the recycled water release system.
The project comprised of three broad areas of investigation which contained five project phases:
1. Intensive hydrodynamic and water quality monitoring in the Seaway (Phases 1 – 3);
2. Numerical modelling of the hydrodynamic process in the Seaway and simulations of the
dispersion of the recycled water release (Phase 4); and
3. The development of a decision support system that informs the WWTP operators of the
potential outcomes of the options for controlling the release of recycled water thereby
allowing the operators to optimise the release (Phase 5).
A summary of the key project components are outlined below:
Monitoring
The intensive monitoring program comprised of the first three project phases, which were:
Phase 1 – Hydrodynamic monitoring
Phase 2 – Development of detailed designs for current monitoring and water quality
monitoring
Phase 3 – Intensive water quality program.
In Phase 1 three Acoustic Doppler Current Profilers (ADCPs) and a tide gauge were deployed at
fixed locations to record the variations in current speed and direction across the Seaway and to
determine the relationship between tidal height variations and reversals in current direction, as
evidenced by the delay in ebbing currents after high water1.
The scope of Phase 2 included the development of detailed designs for water quality and
hydrodynamic monitoring programs. The development of these designs included a pilot
monitoring program that was used to refine the methodology. The water quality monitoring
campaign included both measurements in the Seaway and adjacent Broadwater and within the
recycled water trunk mains releasing to the Seaway from both the northern and southern
1
Refer to 'Seaway SmartRelease Project - striving towards sustainability interim report, June 2009’ for
further detail
Seaway SmartRelease Project Synthesis Report
Page 3 of 47
release systems. The hydrodynamic monitoring program integrated the fixed monitoring from
Phase 1 with further field measurements of currents in the Seaway from boat mounted
instruments.
In Phase 3 the detailed water quality and hydrodynamic monitoring programs from Phase 2 were
implemented. Field measurements and sampling were undertaken on three separate days that
represented a range of metocean conditions. The results from the monitoring were used in the
set up of the numerical models and in the development of the DSS.
Modelling
Phase 4 consisted of the modelling of the dispersion of recycled water released into the Seaway
and identification of the optimal release window. The modelling was divided into three broad
stages, which were:
Establishing the numerical models, which involved first identifying the appropriate modelling
methodology;
Calibrating and verifying the models against data collected in Phases 1 – 3; and
Undertaking a range of scenarios to represent different metocean conditions and varying
release strategies.
Three different numerical models were used, which were; a hydrodynamic (HD) model to
simulate currents and water levels, a spectral wave (SW) model to simulate the wave conditions
at the Seaway which were input to the hydrodynamic model and an advection dispersion (AD)
model to simulate the plume of recycled water using the results from the HD and SW models.
The development of the HD and AD were based on the models previously used for the BACS.
The AD model was set up for the following three release scenarios, described below:
Base Case (the currently approved window) – release commences 10 minutes after predicted
local high tide and ceases 50 minutes after predicted local low tide;
Optimised Release – release commences at the time of maximum flood flows (i.e. highest
velocity; occurs at most 2.5hrs before high tide) and continues for the same period time
period as the Base Case (and so ceases earlier than in the Base Case); and
Extended Release – release commences at the same time as the Optimised Case with both
pumps running, part way through the simulation one pump shuts down and the single pump
then continues to pump for a total release duration 50 minutes longer than Base Case and
Optimised Case.
Each of these three scenarios were simulated for 24 hydrodynamic scenarios, making a total of
72 AD model runs. The AD model was set up to simulate the release of Total Nitrogen (TN),
which was used as an indicator for the dispersion of the recycled water plume.
The results from the modelling were analysed to investigate the impacts of typical tide, wind and
wave conditions on the dispersion of recycled water within each of the scenarios. The numerical
models form the basis of the DSS.
DSS
In Phase 5 a decision support system was developed to provide the operators of the northern
release system with sufficient information to optimise the release of recycled water based on
operational (e.g. recycled water quality, recycled water lagoon capacity) and environmental
conditions (e.g. rainfall, tidal amplitudes, wind and waves). The development of the DSS was
conducted in four stages:
Specification of the DSS;
Development of a prototype DSS;
Seaway SmartRelease Project Synthesis Report
Page 4 of 47
Installation and maintenance of the DSS at the Coombabah WWTP; and
Training of the operators in the use of the DSS.
Initially, the functionality and operation of the DSS was identified in a specification document. A
prototype DSS was developed using available monitoring and modelling data, which allowed for
the scope and operation of the DSS to be reviewed at an early stage of the project. Once the
numerical modelling had been completed the DSS was updated to include the final models and
was installed at Coombabah WWTP. The final stage was to provide a manual for the operation of
the DSS and to train the operators of the DSS.
Outcomes
The Seaway SmartRelease Project has developed a powerful and calibrated modelling tool
capable of real-time simulation of recycled water releases from the northern release system to
the Gold Coast Seaway. By utilising a next generation DSS, which links complex monitoring
data, computational modelling and real-time analysis of the meteocean conditions the project
delivered on the intended aim of providing an optimised recycled water release system.
Utilising the comprehensive data collected in the intensive hydrodynamic and water quality
monitoring program, the project further developed and enhanced the BACS HD and AD models.
The model establishment and calibration stages of the project provided a robust suite of
numerical models that could be used with confidence to simulate the dispersion of the recycled
water release from the northern diffuser system and could be further used to optimise the
release. More specifically, the project has clearly demonstrated that while the flushing capacity
of the Broadwater is highly variable and dependant on a range a variables (e.g. the lunar cycle,
wind and waves etc) under optimised conditions, there is no evidence of any long term
accumulation of recycled water within the Broadwater. This was a significant finding as it
indicates that the release of recycle water is not compromising the water quality of the Seaway
and adjacent Broadwater.
This increase in flushing capacity observed in the Optimised and Extended Case is attributable to
starting the release earlier and hence taking advantage of the eddy formation adjacent to the
northern Seaway wall. This strategy allows the release to finish earlier which has an additional
benefit of significantly reducing the re-entry of recycled water on the return flood tide.
Importantly, the modelling results clearly demonstrate that water quality outcomes for the
Broadwater can be significantly improved (relative to the currently approved Base Case) through
the implementation of either the Optimised or the Extended Case. Importantly, the Optimised
and Extended Cases always generate similar results, and are always considerably lower than the
Base Case. This provides a significant opportunity to both optimise receiving water quality and
reduce our carbon footprint (by reducing energy consumption) attributable to the release
system.
The modelling platform described above formed the basis of the DSS, which allows the operators
to optimise the release of recycled water to the Seaway in line with the most recent plant and
metaocean conditions. The DSS guides the release of recycled water to minimise water quality
impacts to the Broadwater and also to reduce energy consumption (and therefore our carbon
footprint). The system utilises real-time data and release rules delivered from the hydrodynamic
and advection dispersion models. Here the DSS has been developed to take into consideration
factors such as the recycled water storage lagoon capacity, prevailing metocean conditions,
optimisation of pump usage and electricity tariffs to propose the optimal time to release recycled
water to the Seaway. As such, the Seaway SmartRelease Project has delivered the intended aim
of delivering a sustainable recycled water release system.
In addition to the above project outcomes, the final Seaway SmartRelease models will be
utilised by the South East Queensland Healthy Waterways Partnership, to integrate into their
SEQ regional 3D receiving water quality model. The Seaway SmartRelease Project builds on the
foundation of a research and development initiative incorporating the hydrodynamic
characteristics of an urban waterway and the nexus with anthropogenic influences.
Seaway SmartRelease Project Synthesis Report
Page 5 of 47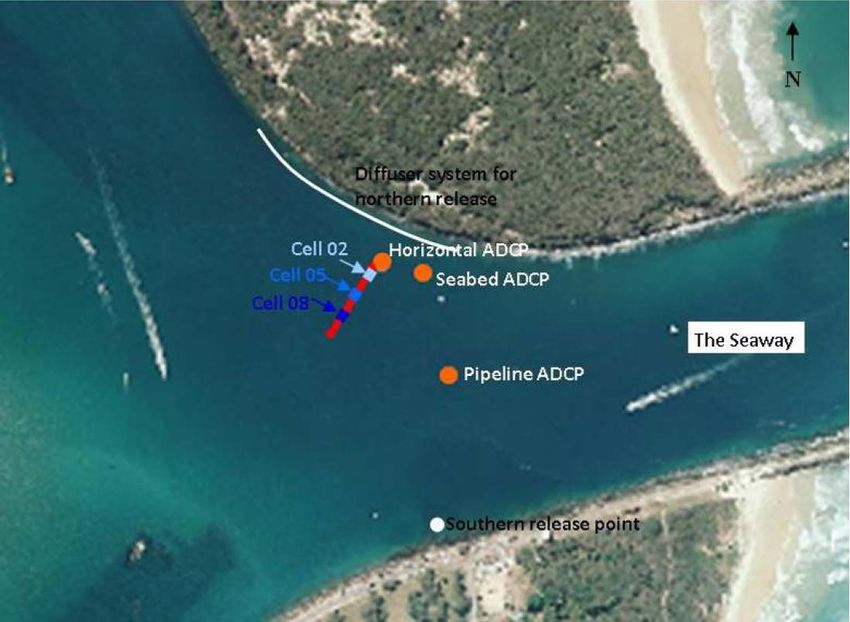
Gold Coast Seaway SmartRelease
Project Synthesis Report
This report will summarise the outcomes of the Gold Coast Seaway SmartRelease Project and is
a subsidiary of the 'Seaway SmartRelease Project - striving towards sustainability interim report'
issued to the Department of Environment and Resource Management in June 2009.

1       Introduction
The Seaway SmartRelease Project was initiated by Allconnex Water (formally Gold Coast Water)
as a continuation of the Broadwater Assimilative Capacity Study.

In 2008, Allconnex Water engaged DHI Water and Environment (DHI) and the Griffith Centre for
Coastal Management (GCCM) in a collaborative partnership to undertake the Gold Coast Seaway
SmartRelease Project. The project aimed to optimise the release of recycled water from the
northern diffuser at the Gold Coast Seaway with a view to minimising impacts to the receiving
water quality of the Broadwater.

In order to achieve this optimisation, the project involved undertaking intensive hydrodynamic
and water quality monitoring, numerical modelling as well as the development of a web-based
decision support system.

1.1      Background
The Coombabah WWTP and Pimpama Coomera A+ recycled water treatment plant (RWTP)
releases excess recycled water (~65 ML/ day) from the northern Seaway wall via a diffuser
system. The Elanora and Merrimac WWTPs release system is located on the southern Seaway
wall, and releases approximately 48 ML/day of recycled water. The Seaway release system relies
on the basis that recycled water is released on the outgoing tide from the Seaway entrance,
allowing the recycled water to be dispersed to the Pacific Ocean while limiting the amount of
recycled water returning into the Seaway and Broadwater.
The release of recycled water to the Seaway is controlled by Development Approvals (DA) issued
from the Queensland Department of Environment and Resource Management (DERM) under the
Environmental Protection Act 1994, which (amongst other conditions) specifies the timing,
volume and quality of recycled water released to the Seaway.

Rapid population growth over the past decade has placed increasing demands on the receiving
waters for the release of the City’s excess recycled water. To manage this growing demand an
investigation of the capacity of the Broadwater to assimilate a greater volume of recycled water
over a longer release period, the ‘Broadwater Assimilative Capacity Study’ (BACS), was
undertaken in 2007 (DHI, 2007)2.
As an outcome of the BACS project, the QLD DERM granted Allconnex Water’s application for an
extension of the existing DA from 10.5 hours per day to 13.3 hours per day from the northern
diffuser. The amended conditions granted by the DERM included:

        (WA5) Timing for Release of Contaminants to Waters
        The release of contaminants to waters from release point RP2 must only occur ten (10)
        minutes after local high tide until fifty (50) minutes after local low tide.

2
  Please refer to the ‘Seaway SmartRelease Project - striving towards sustainability Interim Report’ issued to DERM, June
2009 for further background information.

Seaway SmartRelease Project Synthesis Report

                                                                                                            Page 6 of 47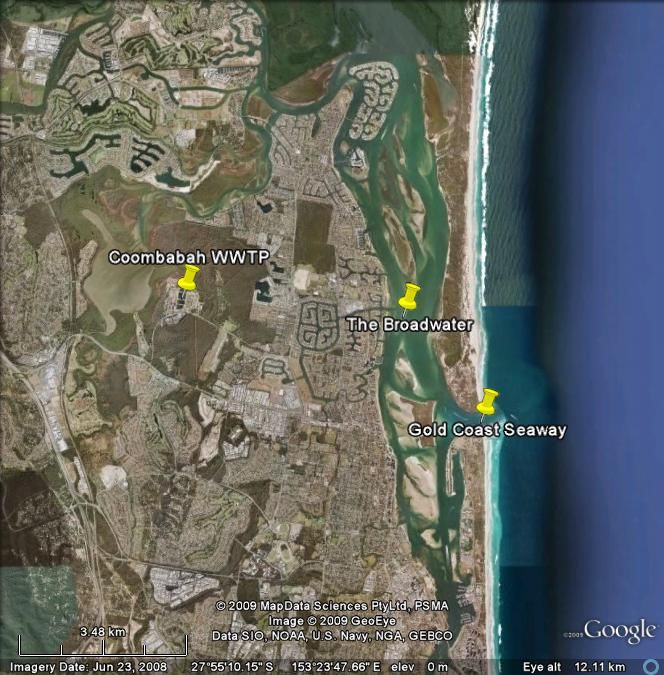
(WA6) The registered operator to which this approval relates must implement a release
        optimisation study for a period of 18 months from the date of issue of this approval for
        the release of contaminants from release point RP2 to the Seaway from the Coombabah
        Wastewater Treatment Plant, to investigate the release methods recommended within
        the report “Review of the Broadwater Assimilative Capacity Study, GCCM, December
        2007”.

The Seaway SmartRelease Project was instigated to satisfy the requirements of Clause WA6 to
undertake a ‘release optimisation study’.

1.2     Study Area
The Seaway SmartRelease Project study area included the Gold Coast Seaway and the adjacent
Broadwater. The focus of the study is the northern wall of Gold Coast Seaway where recycled
water from the northern Gold Coast treatment (i.e. Coombabah WWTP and Pimpama Coomera
RWTP) plants is released. Figure 1 below shows the extent of the study area.

Figure 1 Gold Coast Seaway SmartRelease study area (source Google Maps)

1.3     Study Scope
The scope of the project can be defined into three broad areas;

    1. monitoring,
    2. numerical modelling, and
    3. development of a decision support system (DSS).

Seaway SmartRelease Project Synthesis Report

                                                                                     Page 7 of 47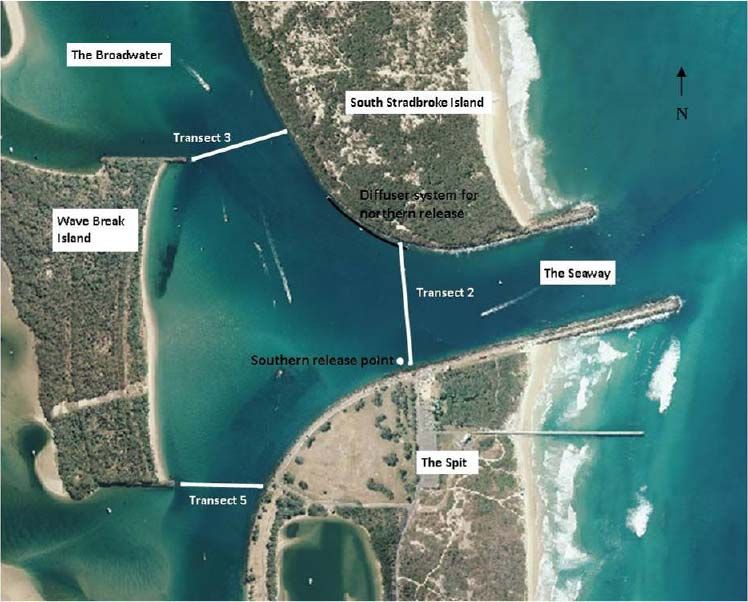
In designing the Seaway SmartRelease Project methodology, Allconnex Water pulled together
both scientific and engineering disciplines to assess the complex hydrodynamics and unique
mixing characteristics of the Seaway. The project is divided into five key phases to ensure
effective project management:
Phase 1 – Seaway Current Monitoring
Phase 2 – Design Water Quality Monitoring Program
Phase 3 – Undertake Water Quality Monitoring Program
Phase 4 – Modelling of Release Plume and Optimal Release Window
Phase 5 – Development of DSS
The reports from the project have been subject to rigorous internal review by specialists from
DHI, GCCM and Allconnex Water. Independent external peer review has been conducted by
experts from the Healthy Waterways Partnership (HWP). This has ensured a high standard of
reporting from the project, with the outcomes supported by the peer review process.
For example, based on advice provided by the Healthy Waterways Partnership Peer Review
Team an additional hydrodynamic monitoring campaign was undertaken to verify previous
phases.
1.4 Report Structure
This report provides a synthesis of the Seaway SmartRelease project components and their key
outcomes. This report is structured as follows:
Section 3 Project Overview. This section defines the project objectives and outlines the
components of the project;
Section 4 Monitoring. This section documents the extensive hydrodynamic and water quality
monitoring that was undertaken in the Seaway;
Section 5 Modelling. This section summarises the development and calibration of numerical
models to simulate the dispersion of the recycled water release into the Seaway and the
subsequent use of these models to simulate a range of release scenarios;
Section 6 DSS. This section outlines the development of the decision support system and
describes how the system is to be implemented by Allconnex Water and applied by the
treatment plant operators; and
Section 7 Conclusions. This section provides overall conclusions from the project.
Seaway SmartRelease Project Synthesis Report
Page 8 of 47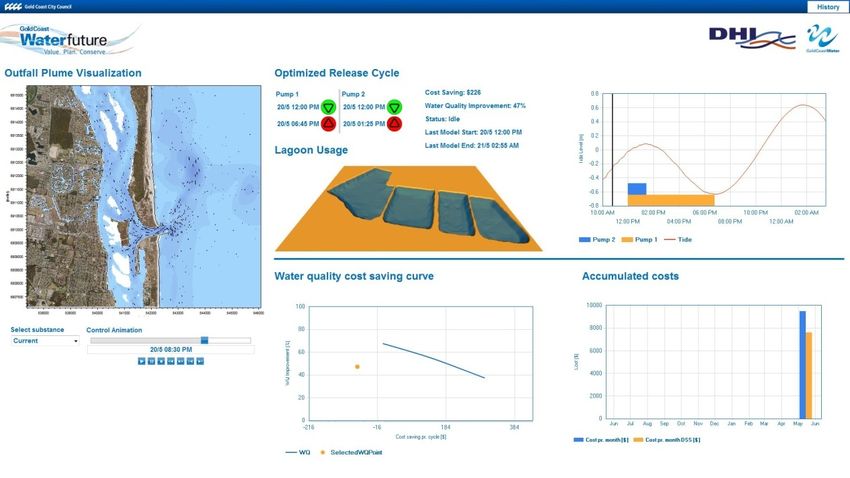
2 Project Overview
2.1 Project Objectives
There were two key objectives of the Seaway SmartRelease project, namely:
1. To optimise the release of recycled water from the Coombabah WWTP, to ensure the
recycled water does not cause adverse impacts to receiving water quality within the
Broadwater; and
2. To optimise the pumping of recycled water in a way that minimises energy consumption,
and hence our carbon footprint.
The first objective is directed at satisfying the amendment to the DA conditions that requires
‘The registered operator to which this approval relates must implement a release optimisation
study …’. The second objective is aligned with Allconnex Water’s water efficiency and energy
management program and helps to achieve Gold Coast City Council’s objective of being carbon
neutral by 2020 as stated in December 20073.
In order to meet these objectives, a number of more specific project aims were defined, as
follows:
To undertake detailed investigations of the behaviour of the recycled water upon release to
the Seaway;
To investigate a range of hydrodynamic and mixing processes that influence the behaviour of
the release;
To determine optimal conditions for release; and
To design and implement a decision-support system that guides the optimal operation of the
release.
These aims reflected the three broad areas of the study which included the monitoring of
currents and water quality in the Seaway, numerical modelling of the dispersion of the recycled
release and development of a DSS.
2.2 Project Components
As highlighted in Section 2.3, the project comprised of three broad areas of investigation which
contained five project phases:
Monitoring of currents and water quality in the Seaway (Phases 1 – 3);
Numerical modelling of the hydrodynamic process in the Seaway and simulations of the
dispersion of the recycled water release (Phase 4); and
The development of a decision support system that informs the plant operators of the
potential outcomes of the options for controlling the release of recycled water and allows the
operators to optimise the release (Phase 5).
Each of the components are outlined in the following Sections (4, 5 and 6), and provide detailed
descriptions of the methodology and key outcomes.
3
www.goldcoast.qld.gov.au/attachment/environment/cc_strategy.pdf
Seaway SmartRelease Project Synthesis Report
Page 9 of 47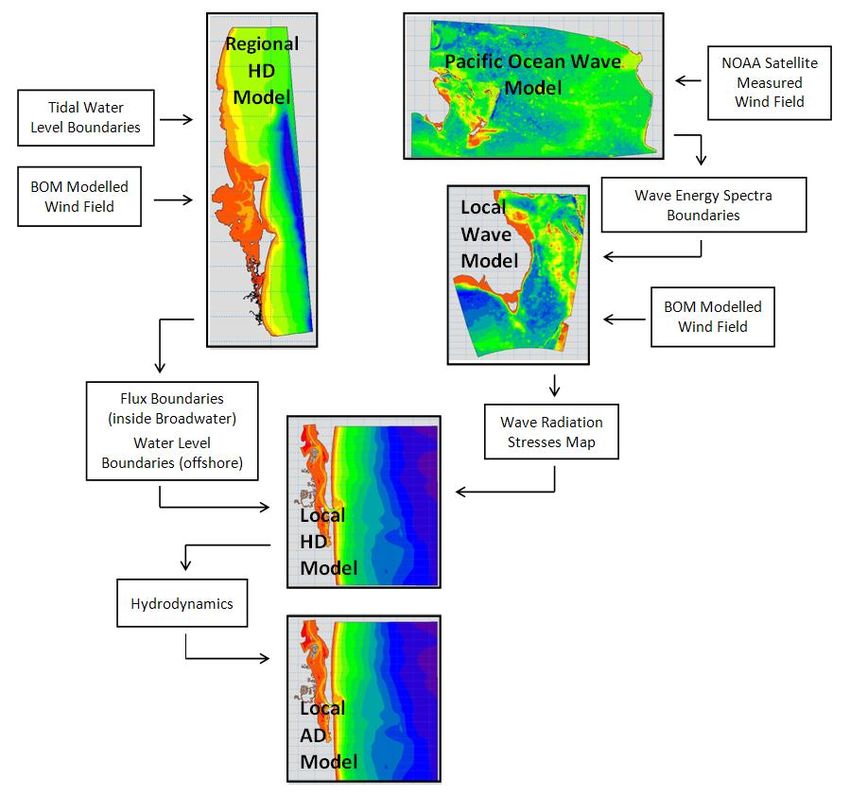
Figure 2 provides an overview of the project phases and their interaction. The project phases
enabled efficient project management of the components of the project and further ensured that
feedback from an independent peer review process could be incorporated into the project before
moving onto the next phase. Details of the peer review process are provided in Section 3.3.
Figure 2 Gold Coast Seaway SmartRelease Project Overview
2.3 Peer Review Process
The Healthy Waterways Partnership was engaged in a peer review role of the Seaway
SmartRelease Project. The independent peer review process ensured technical scrutiny of the
entire project including the project methodology, outcomes and inferences.
The Peer Review Team consisted of the following highly respected experts in waterway health
and hydrodynamic modelling:
Associated Professor Eva Abal (Healthy Waterways Partnership; Great Barrier Reef
Foundation; Office of the Vice Chancellor, the University of Queensland)
Tony McAlister (eWater Innovation Pty Ltd board member, Director BMT WBM)
Seaway SmartRelease Project Synthesis Report
Page 10 of 47 John Bennett / Dr Ian Ramsay (DERM)
Di Tarte (Healthy Waterways Partnership)
Mara Wolkenhauer (Healthy Waterways Partnership).
The following presents a summary of key review activities undertaken by the Peer Review Team
and the corresponding reports in which critical feedback was provided.
Peer Review Meeting Teleconference
1. DHI - The Gold Coast SmartRelease Study: Proposal
Peer Review Meeting No. 1 - January 2009 (these reports reflected changes to DHI's
proposal recommended by the Peer Review Team)
2. GCCM - The Gold Coast SmartRelease Study: Pilot Monitoring Report
3. GCCM - The Gold Coast SmartRelease Study: Monitoring Design Report
4. DHI - The Gold Coast SmartRelease Study: Modelling Methodology Report.V1
Peer Review Meeting No. 2 - 1 July 2009
1. Review of water quality monitoring results (pre-report)
2. DHI - The Gold Coast SmartRelease Study: DSS Specification Report.V1
3. DHI - The Gold Coast SmartRelease Study: Modelling Methodology Report.V2
Peer Review Meeting No. 3 - 3 December 2009
1. GCCM - The Gold Coast Seaway SmartRelease Study: Monitoring Campaign Report
2. DHI - The Gold Coast SmartRelease Study: Model Set-up Report.V1 (as an outcome of
this review, the Peer Review Team recommended additional monitoring to confirm the
eddy formation along the Northern Seaway Wall)
3. DHI - The Gold Coast SmartRelease Study: DSS Specification Report.V2 (this report
details the DSS specification based on comments from the Peer Review Team)
Peer Review Meeting No. 4 - January 27 2010
1. DHI - The Gold Coast SmartRelease Study: Model Set-up Report.V2 (this report included
the results of the additional monitoring recommended by the Peer Review Team)
Peer Review Meeting No. 5 (Final Meeting) - 15 June 2010
1. DHI - The Gold Coast SmartRelease Study: Modelling Results Report
Seaway SmartRelease Project Synthesis Report
Page 11 of 473 Monitoring
3.1 Scope
The overarching aim of the monitoring program was to provide calibration and validation data
for the numerical models developed in Phase 4. The specific objectives of the monitoring
program were to:
Measure the dispersion of the recycled water released within the Seaway under a range of
tidal conditions;
Define the relationship between tidal level and current direction in the Seaway; and
Provide data to refine and calibrate the existing hydrodynamic and advection-dispersion
models of the Seaway and the release of recycled water into the Seaway.
The monitoring program comprised of the measurement of currents and water level in the
Seaway, in-situ water quality measurements, sample collection and laboratory analysis for a
range of water quality parameters. The monitoring program was divided into three phases:
Phase 1 – Hydrodynamic monitoring program;
Phase 2 – Design of water quality monitoring program;
Phase 3 – Intensive water quality monitoring.
The intensive water quality monitoring program was undertaken by staff from the GCCM under
management of DHI. It is important to note that the Healthy Waterways Partnership provided
valuable feedback on the methodology of the water quality monitoring program.
The following reports were produced as an outcome of the hydrodynamic monitoring program:
The Gold Coast Seaway SmartRelease Study: Monitoring Campaign. Monitoring Design
Report. Griffith Centre for Coastal Management Report No 91. Technical Report for Gold Coast
Water. November 2008.
The Gold Coast Seaway SmartRelease Study: Monitoring Campaign. Pilot Monitoring
Campaign Report. Griffith Centre for Coastal Management Report No 91.2. Technical Report
for Gold Coast Water. January 2009.
The Gold Coast Seaway SmartRelease Study: Monitoring Campaign. Monitoring Report.
Griffith Centre for Coastal Management Report No 91.3. Technical Report for Gold Coast
Water. January 2010.
The following sections summarise the three phases of the monitoring program and outline the
key outcomes from the program. Greater detail is provided in the above referenced reports
(available to DERM if required).
3.2 Phase 1 – Hydrodynamic Monitoring
The key issue for minimising the impact of the recycled water release is to ensure adequate
mixing of recycled water outside of the Seaway entrance before the tide turns and re-enters the
Broadwater. The previous Broadwater Assimilative Capacity Study demonstrated a considerable
lag between the water level and current direction suggesting further investigation for optimising
the release was required. Therefore, Phase 1 (hydrodynamic monitoring program) was designed
to characterise the flow dynamics within the Seaway.
The hydrodynamic monitoring program involved the deployment of fixed Acoustic Doppler
Current Profilers (ADCPs) at three locations in the Seaway to measure spatial and temporal
Seaway SmartRelease Project Synthesis Report
Page 12 of 47variation in current speeds and directions. A total of three ADCPs were deployed, which
comprised of two bottom mounted ADCPs measuring vertical velocity profiles and one ADCP
mounted at mid-depth measuring a horizontal profile. The bottom mounted ADCPs were
positioned on the seabed in the vicinity of the northern wall of the Seaway and on the sand
bypassing system transfer pipeline in the middle of the Seaway. The horizontal ADCP was
attached to the northern safety beacon at mid depth. The locations of the ADCPs are shown in
Figure 3
Figure 3 Locations of the three ADCP current measurement sites.
The ADCPs were deployed intermittently over the period of February 2009 to June 2009. The
bottom mounted ADCPs recorded a vertical profile every 30 minutes, while the horizontal ADCP
recorded a horizontal profile every 10 minutes.
Additional boat mounted ADCP transects were also undertaken during the intensive water quality
monitoring campaign (refer to Section 4.3).
3.3 Phase 2 – Design Water Quality Monitoring Program
The intensive water quality monitoring program was designed to capture suitable data for the
calibration and validation of the numerical models in Phase 4 (Section 5). This meant designing
a program to provide further information on the spatial variations of current speeds and
directions and to measure the dispersion of the recycled water plume from the northern diffuser
system through the measurement of water quality parameters.
The monitoring program design followed the framework and guidelines for developing and
undertaking monitoring programs given in the National Water Quality Management Strategy
(ANZECC, 2000). The design of the program made use of existing data from the BACS study
(DHI, 2007) and from the HWP Regional Environmental Health Monitoring Program (EHMP).
A pilot water quality monitoring program was undertaken on 12 December 2008 with the aim of:
Seaway SmartRelease Project Synthesis Report
Page 13 of 47a) Testing, sampling and monitoring techniques and procedures to be used in the intensive
monitoring campaign (program logistics), and
b) Developing a preliminary understanding of the physical characteristics of the Seaway.
In-situ measurements of current speed and direction across the Seaway were made using a boat
mounted ADCP, while in-situ measures of vertical variations in salinity and temperature were
made using conductivity-temperature-depth (CTD) casts. Water samples were collected at
surface, middle and bottom depths and analysed for a range of physical, chemical and micro-
parameters. The results from the pilot monitoring informed the final design of the detailed water
quality monitoring program.
The intensive monitoring campaign included the following components:
Boat mounted ADCP transects to measure the spatial and temporal variability in currents
across the Seaway and adjacent sections of the Broadwater;
In-situ measurements of salinity and temperature using CTD casts at 12 locations to
determine whether any stratifications were present in the Seaway and whether the recycled
water plume could be detected with these two parameters; and
Water sampling at 12 locations (over five separate transects, and at three discreet depths) in
the Seaway and at the recycled water trunk mains at The Spit and at Land End and
laboratory testing for water quality parameters to characterise the behaviour of the recycled
water plume in the Seaway.
The monitoring and sampling was scheduled for three field survey days, which were 10 February
2009, 10 March 2009 and 23 March 2009. These days were selected to represent a range of
tidal conditions.
The locations of the boat mounted ADCP transects are shown in Figure 4. Transects were to be
conducted every hour during the field survey days, with vertical profiles collected every five
seconds as the boat travelled along each transect. Position, water speed and direction data were
to be recorded for each transect.
Seaway SmartRelease Project Synthesis Report
Page 14 of 47Figure 4 Locations of boat mounted ADCP transects
The positions for the Conductivity Temperature and Depth (CTD) casts and water quality
sampling are shown on Figure 5 . The locations of the sampling points were designed to monitor
the plumes of recycled water from both the northern and southern sides of the Seaway and
attempt to characterise the background concentrations. Sampling of both the northern and
southern sides of the Seaway aimed to differentiate the plume from the Coombabah WWTP with
that from the southern release.
Seaway SmartRelease Project Synthesis Report
Page 15 of 47Figure 5 Seaway SmartRelease water quality monitoring locations
Sampling was scheduled to occur at regular intervals relative to the start of the release of the
recycled water from the northern side, at -1hrs, +1hr, +2hrs, +3hrs, +5hrs and +7hrs relative
to the release of recycled water. Water samples were to be collected at surface, middle and near
bed depths to characterise any vertical variations in water quality. CTD casts were designed to
be conducted at the same depths and times as the water sampling.
The following water quality parameters were to be analysed in a laboratory in the water
samples:
Total Nitrogen (TN);
NOx (Nitrite and Nitrate);
Total Phosphorus (TP);
Faecal Coliforms (F. Coliforms); and
Enterococci.
The potential for using caffeine as a tracer for the recycled water plume was investigated during
the pilot monitoring program but the results were found to be unsatisfactory and no such testing
was undertaken during the intensive monitoring program.
3.4 Phase 3 – Undertake Water Quality Monitoring Program
The intensive water quality monitoring was conducted on three separate days as originally
proposed and generally followed the proposed sampling design. The following changes, however,
were made to the original program:
The sampling dates for Days 2 and 3 were modified as a result of adverse weather conditions
and dredging works being undertaken in the Broadwater. Refer to Table 1 for revised
Seaway SmartRelease Project Synthesis Report
Page 16 of 47sampling dates for Days 2 and 3. These sampling days represent dry weather conditions, with
no significant rainfall occurring within the catchment five days prior;
Following preliminary analysis of the Day 1 data, additional sampling times were added at
+9hrs and +10hrs relative to the start of the release; and
Following preliminary analysis of the Day 1 data, ammonia (NH3) was added to the list of
water quality parameters for laboratory analysis.
The water quality sampling and analysis is summarised below in Table 1.
Table 1 Water quality sampling times and parameters
SAMPLING DATE TIME (RELATIVE TO PARAMETERS
DAY RELEASE START TIME)
1 10/02/09 -1,1,2,3,5,7 TN, TP, NOx,
F. Coliforms, Enterococci,
CTD
2 23/03/09 -1,1,2,3,5,7,9,10 TN, TP, NOx, NH3
F. Coliforms, Enterococci,
CTD
3 22/04/09 -1,1,2,3,5,7,9,10 TN, TP, NOx, NH3
F. Coliforms, Enterococci,
CTD
The laboratory analysis was conducted at the Griffith University chemistry laboratory following
standard methods of analysis. In addition, 5% of samples were duplicated for analysis at Gold
Coast Scientific Services, which is a NATA accredited laboratory.
3.5 Outcomes
The key findings of the monitoring program are summarized below:
The Seaway exhibits strong tidally dominated flows, with a maximum recorded current speed
of 1.61 m/s. It was noted that on the ebb tide flows into the Seaway are principally from the
northern part of the Broadwater with flows passing through the northern approach channel
past Wave Break Island.
A phase lag was found between high tide and the commencement of ebb flows. Lag times
were found to be 76 minutes and 85 minutes after high water before ebb flows commenced.
During flood flows an eddy was observed along the northern seawall, with the edge of the
eddy found at the position of the horizontal ADCP. This eddy was found to form during the
latter stages of the incoming tide (not more that 2.5 hours prior to the predicted local high
tide). The eddy essentially slows the movement of water into the Broadwater within the
vicinity of the northern Seaway wall (directly above the diffuser system). This process
essentially results in a storage effect of water within this area. Once the tide turns, the eddy
quickly dissipates with the ebbing flows, flushing these waters out into the Pacific Ocean.
The Seaway was generally found to be well mixed, with no vertical differences in salinity and
temperature. The exception was at the monitoring stations in the vicinity of the diffuser
system, where reductions in salinity were measured near the water surface, which was likely
to have been caused by the release of recycled water (which is less saline).
Both NOx and TP showed consistently higher values at the stations in the vicinity of the
recycled water released during release periods compared to background values measured at
other stations. The clearest trend was found for the NOx data. No such consistent patterns
were found for the other water quality parameters.
Additionally, near minimum and maximum concentrations were typically observed at high and
low water, respectively indicating the influence of oceanic water during flood tides and
Seaway SmartRelease Project Synthesis Report
Page 17 of 47catchment waters during ebb tides.
Elevated TN and TP concentrations during low water also coincided with observed increased
suspended sediment loads within the sampled waters.
Faecal coliforms and Enterococcus spp. concentrations were low (< 60 cfu 100 mL-1) with no
significant trends apparent between concentration and sample location, depth, or tidal phase.
It was concluded that the monitoring program had collected sufficient data of high enough
quality for calibration of the numerical models in Phase 4 and so the primary purpose of the
monitoring program was fulfilled.
Seaway SmartRelease Project Synthesis Report
Page 18 of 474 Modelling
4.1 Scope
Numerical modelling is the key component of the Seaway SmartRelease Project, with the models
developed in the modelling phase being used to optimise the release and forming the core of the
DSS that is the final deliverable of the project.
The overall aim of the modelling is to provide the ability to predict the fate of the recycled water
from the Coombabah WWTP released at the Gold Coast Seaway based on the prevailing tidal,
oceanographic and meteorological conditions. The specific objectives of the modelling were to:
Develop an advection dispersion hydrodynamic model for the Broadwater to optimise the
release of recycled water from the Coombabah WWTP;
Provide a model capable of predicting the recycled water behaviour including rates of return
into the Broadwater during flood tides;
Complete work in accordance with the requirement to fulfill DERM licensing conditions for
optimising the release; and
Deliver a suite of models to be used to derive the recycled water release rules in the Seaway
SmartRelease DSS.
The modelling phase comprised of three main stages, which were:
Model Establishment, in which models were set up to represent the major hydrodynamic
process of tidal currents, waves and wave driven currents and wind generated currents and
the dispersion of the recycled water plume. Much of this work involved updating the existing
models from the Gold Coast Estuarine Study (GEMS) and from the BACS (DHI, 2007).
Model Calibration, in which the models were calibrated against data collected in Phase 1 and
Phase 3 and other relevant available data.
Scenario Modelling, in which a range of scenarios were conducted to investigate the effects of
different metocean conditions and of varying the release window characteristics, including
modifying the pumping regime.
The modelling was conducted by specialists from DHI, with data from Phases 1 and 3 being
provided by GCCM.
The following reports were produced from the Phase 4 modelling:
Gold Coast Seaway SmartRelease Project Modelling Methodology Report Final Report.
Technical Report prepared by DHI Water and Environment for Gold Coast Water. June 2009.
Gold Coast Seaway SmartRelease Project Model Set-up Report Final Report. Technical Report
prepared by DHI Water and Environment for Gold Coast Water. April 2010.
Gold Coast Seaway SmartRelease Project Model Results Report. Technical Report prepared by
DHI Water and Environment for Gold Coast Water. June 2010.
The following sections summarise the three stages of the modelling and outline the key
outcomes from this phase of the project. Greater detail is provided in the above referenced
reports.
Seaway SmartRelease Project Synthesis Report
Page 19 of 474.2 Model Set Up
Prior to the commencement of the modelling, a modelling methodology was prepared, which
documented the proposed approach to the numerical modelling. The document outlined the
modelling tools to be used, the proposed development of those tools, the procedures for
calibration and the potential modelling scenarios. The report allowed for early review of the
proposed modelling approach, but did not represent the final modelling approach or provide full
details as these were subject to refinement during the modelling work.
The modelling approach broadly consisted of three models:
A hydrodynamic model (HD) to represent currents and water level variations and provide
input to the advection dispersion model (AD);
A spectral wave model (SW) to provide input to the HD; and
An AD model to simulate the dispersion of the recycled water plume from both the northern
and southern releases.
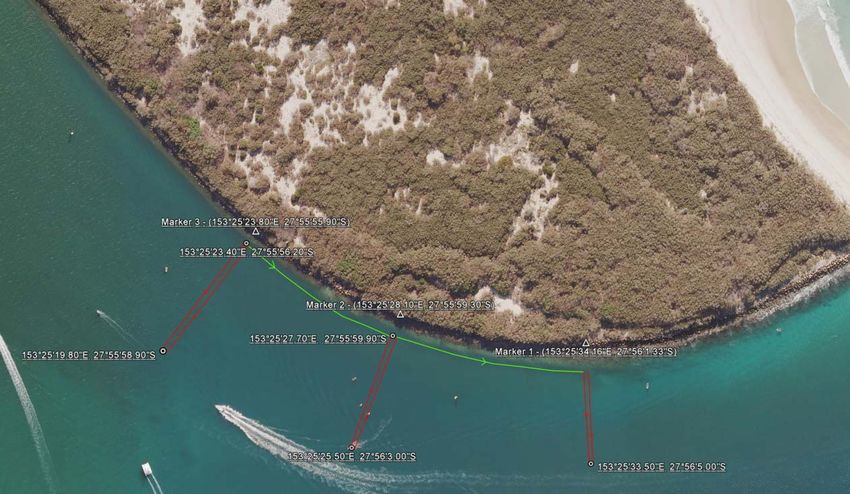
The hydrodynamic modelling approach consisted of using a detailed three dimensional (3D)
model, nested within a large scale regional 2D model. The large scale model, which was
developed for the GEMS study, covered SEQ from Tweed Heads in the south to Double Island
Point in the north. The model represents tidal variations and the affects of wind on currents.
Output from this model is used as the input to the local area 3D model. The local model was
developed from the previous 2D model of the Broadwater and the Seaway used in the BACS
(DHI, 2007). The model was updated to provide a finer resolution of 25 m – 35 m in the Seaway
and to include three vertical layers to represent any vertical variation in currents and in the
behaviour of the recycled water plume. Figure 6 shows the local model domain and mesh,
including a zoomed in view of the mesh within the Seaway. The 3D model also represents the
effects of winds, which are input from Bureau of Meteorology (BOM) data, and waves, which are
derived from the spectral wave model. Output from the HD model provides the input to the AD
model that simulates the dispersion of the recycled water plume upon release.
The wave models have been developed specifically for this project and consist of a local model
nested within a large scale Pacific Ocean model. The local model focuses on the east coast of
Australia out to Noumea and New Zealand, while the Pacific Ocean Wave Model covers the area
of the South Pacific Ocean between Australia and South America. The models are driven by wind
fields derived data provided by the BOM’s atmospheric model and from U.S. Department of
Commerce’s National Climatic Data Center. The wave conditions output from the local wave
model are input into the HD model to enable simulation of wave driven currents.
The AD (or transport) model uses the flow field calculated by the HD model together with a
dispersive contribution, which together define the transport of the recycled water plume. The AD
model covers the same area as the local 3D HD model (see Figure 6 ), which provides the input
data on currents speeds and directions. The recycled water is input into the model based on the
release rate and the concentrations of the constituents of the release. The recycled water is
entered into the model at the diffuser locations; for the Coombabah WWTP these locations are a
series of pipes along the northern seawall near the water surface and on the southern side these
are a seabed diffuser system. The results from the AD model show concentrations of water
quality parameters in both time and space.
The modelling approach is summarised in Figure 7.
Seaway SmartRelease Project Synthesis Report
Page 20 of 47Figure 6 Local HD model domain and mesh resolution
Seaway SmartRelease Project Synthesis Report
Page 21 of 47Figure 7 Summary of modelling approach
4.3 Model Calibration
The 3D local area HD model, local wave model and AD model were calibrated and verified
against available measurements. For calibration the model parameters were adjusted until the
model results reproduced the observed data to an acceptable degree of accuracy. Model
verification was undertaken by applying the calibrated models without further adjustment to
periods/events independent of those used for calibration and then comparing the model results
with the measurements. The acceptance of the calibration and verification results were based on
statistical analyses of the fit between the model results and the measurements that followed
best industry practice methods.
4.3.1 Hydrodynamic Model Calibration
The HD model was initially calibrated and verified against current data from the three fixed
ADCPs from the Phase 1 current monitoring and against the three ADCP transects from the
Phase 3 intensive water quality monitoring program. An example of the calibration against the
fixed ADCP data is shown in Figure 8, which presents the comparison between current speed in
the three model layers and from the pipeline ADCP data. An example of the calibration for the
ADCP transect data is shown in Figure 9 . The model was found to be well calibrated against the
observed data.
Seaway SmartRelease Project Synthesis Report
Page 22 of 47Figure 8 Current speed calibration of 3D hydrodynamic model
Seaway SmartRelease Project Synthesis Report
Page 23 of 47Figure 9 Comparison between measured (red) and modelled (black) currents along Transect 2,
from Day 1 (10/02/09)
Following initial review of the model set-up and calibration an additional monitoring campaign
was undertaken to specifically measure the extent of the eddy that forms along the northern
wall of the Gold Coast Seaway during the flood tide. Additional boat mounted ADCP transects
(Figure 10) were collected on two separate days during December 2009 in order to provide a
greater definition of the localised eddy that forms near the northern diffusers on the flood tide.
An example of the successful calibration of the HD model results with the additional data is
shown below in Figure 11. This figure also provides an indication of the extent of the eddy at
approximately 1.5 hours prior to the predicted high tide, clearly demonstrating the reduced
speed and variable direction of water within this area.
Seaway SmartRelease Project Synthesis Report
Page 24 of 47Figure 10 Location of additional boat mounted ADCP transects to define eddy extent
Figure 11 Eddy comparisons from 9 December 2009 at 11:21 am
4.3.2 Spectral Wave Model Calibration
The Spectral Wave (SW) model was calibrated and validated against measured wave data from
the Gold Coast directional wave recording buoy maintained by Gold Coast City Council and the
EPA. The buoy is located in 18m of water to the south of the Seaway entrance. The calibration
was undertaken during a period of easterly swell waves, while the validation was performed on
wave data corresponding to the three intensive water quality monitoring field days. It was
Seaway SmartRelease Project Synthesis Report
Page 25 of 47considered that the wave model accurately represented the actual wave conditions during the
calibration and validation periods.
4.3.3 Advection Dispersion Model Calibration
The Advection Dispersion (AD) model was calibrated and validated against the water quality
monitoring data from the intensive water quality monitoring program (Phase 3 of the project, as
described in Section 3). Due to unavoidable constraints during the intensive water quality
monitoring program, which included OH&S issues, high levels of boat traffic, and large
background concentrations, described in the Monitoring Report (GCCM, 2010), there was limited
information available for the calibration of the advection dispersion model.
A review of the data determined that the strongest signal of the recycled water release was
provided by the NOx samples taken on Day 1 and this data was used for calibration and
validation of the AD model. A sample of the comparisons between measured and modelled
values of NOx concentrations at Point 2a, the closest to the release from the Coombabah WWTP,
are shown in Figure 11. The model results have error bars that represent the potential variations
in the model results that account for both timing and positional variations in the field collection
of samples. The monitoring data included error bars to represent the confidence limits of the
laboratory testing and was adjusted to present elevations in concentrations above background
values, which are what the AD model produces. Background values were determined from Point
3a immediately upstream (on the ebb tide) of the release locations.
It was concluded that the model provides results that allow an appropriate level of certainty for
calculating the relative change in water quality resulting from various recycled water release
scenarios.
Seaway SmartRelease Project Synthesis Report
Page 26 of 47Figure 11 Comparison of measured and modelled NOx concentrations at Point 2a from Day 1
(10/02/09)
4.4 Scenario Modelling
The overall aim of the modelling scenarios was to determine the effect of varying the timing of
the release of recycled water from the Coombabah WWTP to the Gold Coast Seaway over a
range of typical metocean conditions. The scenarios were defined to provide the following
outcomes, which relate to the overall project objectives (see Section 2.1) to optimise:
The timing of the release to improve the flushing of the released recycled water from the
Seaway and to reduce the accumulation of nutrients in the Broadwater compared to the base
case release cycle;
Electricity consumption used for pumping the released recycled water.
To achieve these goals a number of modelling scenarios were conducted to simulate a range of
commonly occurring conditions for the Gold Coast Seaway and the potential variations in
operational cycles of the release pumps.
Seaway SmartRelease Project Synthesis Report
Page 27 of 47The hydrodynamic model was run for a total of 24 scenarios to represent the range of metocean
conditions, which are summarised in
Table 2. Results from the hydrodynamic model were produced for input to the AD model for a
single tidal cycle.
Table 2 Summary of Hydrodynamic Scenarios
Wind Waves (at GC Buoy)
Scenario No. Tide Speed (m/s) Direction Hs (m) Tp (s) Direction
1 High
2 Low
3 Medium
4 High 8.5 SE/135°
5 Low 8.5 SE/135°
6 Medium 8.5 SE/135°
7 High 7.5 NNE/22.5°
8 Low 7.5 NNE/22.5°
9 Medium 7.5 NNE/22.5°
10 High 5.0 SSW/202.5°
11 Low 5.0 SSW/202.5°
12 Medium 5.0 SSW/202.5°
13 High 1.50 11 ESE/112.5°
14 Low 1.50 11 ESE/112.5°
15 Medium 1.50 11 ESE/112.5°
16 High 1.25 8 ENE/67.5°
17 Low 1.25 8 ENE/67.5°
18 Medium 1.25 8 ENE/67.5°
19 High 8.5 SE 1.50 11 ESE/112.5°
20 Low 8.5 SE 1.50 11 ESE/112.5°
21 Medium 8.5 SE 1.50 11 ESE/112.5°
22 High 7.5 NNE 1.25 8 ENE/67.5°
23 Low 7.5 NNE 1.25 8 ENE/67.5°
24 Medium 7.5 NNE 1.25 8 ENE/67.5°
Seaway SmartRelease Project Synthesis Report
Page 28 of 47The AD model was then set up for three release scenarios, summarised below. Each of these
three scenarios were simulated for the 24 hydrodynamic scenarios, making a total of 72 AD
model runs. The AD model was set up to simulate the release of TN, which was used as an
indicator for the dispersion of the recycled water plume.
Base Case (the currently approved window) – release commences 10 minutes after predicted
local high tide and ceases 50 minutes after predicted local low tide;
Optimised Release – release commences at the time of maximum flood flows (i.e. highest
velocity; occurs at most 2.5hrs before high tide) and continues for the same time period as
the Base Case (and so ceases earlier than in the Base Case); and
Extended Release – release commences at the same time as the Optimised Case with both
pumps running, part way through the simulation one pump shuts down and the single pump
then continues to pump for a total release duration 50 minutes longer than Base Case and
Optimised Case.
Figure 12 below shows the three different release windows for the median tide only scenario.
Figure 12 Median tide range release windows
4.5 Results of Scenario Modelling
The results from the scenarios were analysed to determine the mass of TN in the upper reaches
of the Broadwater. The Optimised and Extended Cases were compared to the Base Case to
determine the relative improvement in the resident TN loads (Figure 13, 14a and 14b). In
addition, point-in-time contour plots of TN concentrations were produced for the three scenarios
to understand the details of the dispersion of the recycled water plume (Figures 15 (a-c) and
Figures 16 (a-c).
By analysing history of the individual recycled water releases it was determined that both the
Optimised and Extended cases increase the localised TN loads within the Upper Broadwater
during the initial release period. This is a short term effect of the eddy that forms on the
northern Seaway wall significantly retarding the entrance of the flood tide north of Wave Break
Island. This is a key feature in allowing the early release of recycled water. This eddy feature
was present in all scenario runs.
Seaway SmartRelease Project Synthesis Report
Page 29 of 47Figure 13 provides an example of a single release period. As described above, this figure clearly
demonstrates a peak in TN during the initial release, which quickly reduces again as the tide
turns and flows begin to ebb. Also key to note is the large difference between the Base case and
the Optimised and Extended cases. There are however, only minor differences between the
Optimised and Extended Cases.
Total Mass TN (kg/m3)
Time
Figure 13 Single release period simulation (using TN loads as an indicator)
The results of the modelling also highlighted that the interaction of wind, waves and tides is
highly variable. The affect of wind and wave action are most apparent on the subsequent flood
tide following the release of the recycled water. This is due to the differing advection dispersion
mechanisms acting upon the recycled water plume seaward of the Broadwater in each scenario
diluting the volume of recycled water prior to the successive tidal flux.
Figures 14 (a) and (b) provide an example of the variation of one release cycle with varying
wind and wave conditions. This is an important consideration in the release optimisation as the
interactions of wind, waves and tidal conditions change daily, which means that the optimised
time to release recycled water will also change daily depending on these conditions.
Importantly, the Optimised and Extended Cases always generate similar results, and are always
considerably lower than the Base Case. This provides a significant opportunity to optimise
receiving water quality and reduce our carbon footprint (by reducing energy consumption). As
such, the Seaway SmartRelease project has delivered the intended aim of delivering a
sustainable recycled water release system.
Seaway SmartRelease Project Synthesis Report
Page 30 of 47You can also read