Government Expenditure and Revenue Wales 2019 - GUTO IFAN, CIAN SIÔN & ED GARETH POOLE - Cardiff ...
←
→
Page content transcription
If your browser does not render page correctly, please read the page content below
Government Expenditure and
       Revenue Wales 2019
     GUTO IFAN, CIAN SIÔN & ED GARETH POOLE

                                    GERW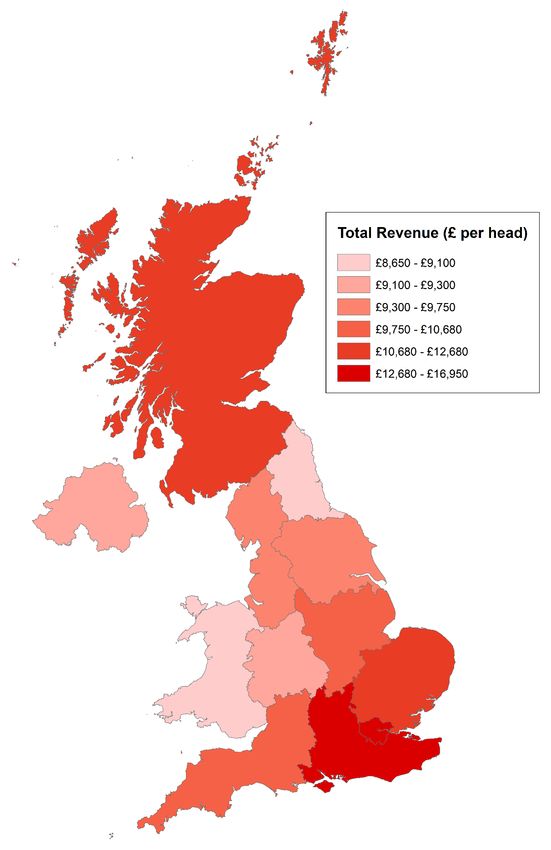
Government Expenditure and Revenue Wales
(GERW) presents a comprehensive analysis of
Wales’ public sector spending, revenues and
the nation’s overall fiscal balance.

Wales Governance Centre Director
Professor Richard Wyn Jones

Wales Fiscal Analysis Academic Lead
Dr Ed Gareth Poole

Honorary Senior Research Fellow – Wales Fiscal Analysis
Michael Trickey
Preface

Declaration of funding

Wales Fiscal Analysis is hosted by the Wales Governance Centre and the School of Law and Politics at
Cardiff University, and funded through a partnership between Cardiff University, the Welsh Government,
the Welsh Local Government Association and Solace Wales. The programme continues the work of
Wales Public Services 2025 hosted by Cardiff Business School, up to August 2018.

About us

Wales Fiscal Analysis (WFA) is a new research body within Cardiff University’s Wales Governance Centre
that undertakes authoritative and independent research into the public finances, taxation and public
expenditures of Wales.

The WFA programme adds public value by commenting on the implications of fiscal events such as UK
and Welsh budgets, monitoring and reporting on government expenditure and tax revenues in Wales,
and publishing academic research and policy papers that investigate matters of importance to Welsh
public finance, including the impact of Brexit on the Welsh budget and local services, options for tax
policy, and the economics and future sustainability of health and social care services in Wales.

Working with partners in Scotland, Northern Ireland, the UK and other European countries, we also
contribute to the wider UK and international debate on the fiscal dimension of devolution and
decentralisation of government.

Contact details

Guto Ifan
ifandg@cardiff.ac.uk // 029 2087 4626

Cian Siôn                                                                        Wales Fiscal Analysis
sionc1@cardiff.ac.uk                                                               Cardiff University
                                                                                        Law Building
Dr Ed Gareth Poole                                                                  Museum Avenue
pooleeg@cardiff.ac.uk // 029 2087 5574                                              Cardiff CF10 3AX

Wales Fiscal Analysis | Government Expenditure and Revenue Wales 2019                                3
£27.1bn
Estimated current revenues to
Wales in 2017-18

                                                     £40.8bn
                                                     Estimated current expenditure
                                                     for Wales in 2017-18

£13.7bn
Wales’ estimated net fiscal
deficit in 2017-18

                                                     54.4%
                                                     Devolved and local expenditure
                                                     as % of total managed
                                                     expenditure in 2017-18
£6.4bn
Amount raised in Wales
through VAT in 2017-18

                                                     108%
                                                     Spending per person for Wales,
                                                     as a % of UK average
£14.8bn
Spending on social protection
for Wales in 2017-18

4                               Wales Fiscal Analysis | Government Expenditure and Revenue Wales 2019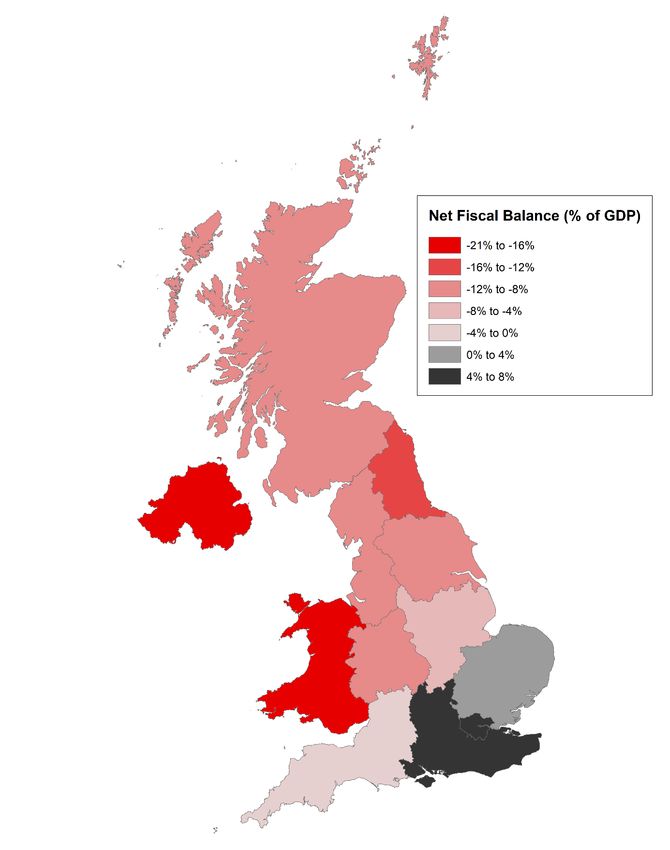
Contents

Executive Summary ................................................................................................................. 6

1. Introduction ........................................................................................................................ 10

2. Estimated fiscal balances for Wales ................................................................................. 15

   2.1 Wales’ estimated fiscal balances .................................................................................................. 16

   2.2 National and regional fiscal balances across the UK ..................................................................... 21

3. Public sector revenue ........................................................................................................ 23

   3.1 Composition and trends in public sector revenues for Wales ........................................................24

   3.2 Devolved revenue streams ........................................................................................................... 32

   3.3 International and regional comparisons ....................................................................................... 33

4. Public sector expenditure ................................................................................................. 40

   4.1 Composition and trends in public sector expenditure for Wales ................................................... 41

   4.2 Devolved and reserved expenditure ............................................................................................. 54

   4.3 International and regional comparisons ....................................................................................... 59

5. Outlook for revenues and expenditure ............................................................................ 64

   5.1 Outlook for revenues to Wales, 2018-19 to 2023-24 ..................................................................... 65

   5.2 Outlook for expenditure for Wales, 2018-19 to 2023-24 ...............................................................68

   5.3 Projected net fiscal balance, up to 2023-24 .................................................................................. 72

   5.4 Factors influencing the outlook for revenues and expenditure ..................................................... 73

Annexes .................................................................................................................................. 77

   A. Methodology................................................................................................................................. 77

   B. Glossary.........................................................................................................................................84

Wales Fiscal Analysis | Government Expenditure and Revenue Wales 2019                                                                                  5
Executive Summary

    About GERW

    Government Expenditure and Revenue Wales 2019 presents a comprehensive multi-year analysis of
    Wales’ public sector spending, public sector revenues and the nation’s overall net fiscal balance. The
    findings reflect Wales’ current fiscal position according to the accounting conventions of the UK
    government. Using data sourced from the Country and Regional Public Sector Finances datasets
    published by the ONS, it is designed to enhance public understanding of Wales’ fiscal position and
    contribute to the continuing debate over Wales’ fiscal and economic future.

Wales’ revenue and expenditure

Figure E1 provides headline estimates of total public sector revenue in Wales as well as total public sector
expenditure for Wales, from 2013-14 to 2017-18.

Figure E1
Wales’ revenue and expenditure, 2013-14 to 2017-18 (current prices)

                                                      2013-14        2014-15        2015-16        2016-17        2017-18
    Current Revenue
    Total (£ million)                                     23,175         24,074         24,741        26,099          27,081
    Per person (£ per head)                                1,457          1,517          1,486         1,553           1,575
    Per person (UK = 100)                                    75.9          76.2            76.0           75.7           76.0
    As a share of UK total (%)                              3.7%           3.7%           3.6%           3.6%           3.6%
    As a share of estimated GDP (%)                        37.6%          38.1%          37.8%         38.3%          38.3%
    Total Expenditure
    Total (£ million)                                     37,663         38,323         38,710         39,464         40,776
    Per person (£ per head)                               13,002         13,025         13,015         12,916         13,030
    Per person (UK = 100)                                  106.9          106.8          107.6          107.9          108.4
    As a share of UK total (%)                              5.1%          5.1%           5.1%           5.1%            5.1%
    As a share of estimated GDP (%)                        61.1%         60.6%          59.1%          57.8%           57.7%

           Source: ONS (2019) Country and Regional Public Sector Finances; ONS (2018) Regional Gross Value Added; and authors’
                                                                                                                   calculations

Total current public sector revenue in Wales is estimated at £27.1 billion in 2017-18, around 3.6% of total
UK revenues of £751.8 billion. Revenues per head in Wales were around £8,650, significantly less than the
average UK figure of approximately £11,350. Revenues as a share of estimated GDP were 38.3%,

6                                                   Wales Fiscal Analysis | Government Expenditure and Revenue Wales 2019
compared with 36.4% across the UK, reflecting Wales’ relatively low estimated GDP levels. Total per capita revenues in Wales have trailed all other UK countries and English regions every year since 1999- 00. VAT was the largest source of public revenue in 2017-18 (raising £6.4 billion in Wales), followed by Income Tax (£4.9 billion) and National Insurance contributions (£4.5 billion). The composition of revenues in Wales markedly differs from the UK as a whole. Large direct taxes (e.g. Income Tax and Corporation Tax) comprise a smaller share of Welsh revenue, whilst a greater share is raised through indirect taxes (e.g. VAT and excise duty). Total Managed Expenditure for Wales is estimated at £40.8 billion in 2017-18, around 5.1% of total UK expenditure of £794.9 billion. Non-identifiable expenditure and expenditure outside the UK attributed to Wales accounted for £5.2 billion of this total (mainly defence and debt interest payments). Social protection (which includes all benefits, social care spending and the state pension) is by far the largest expenditure area for Wales, accounting for £14.8 billion, followed by health spending (£7.3 billion) and education (£4.3 billion). Total spending for Wales increased by 8.3% in nominal terms between 2013-14 and 2017-18, most notably on health, which increased by nearly £1.1 billion over these years. However, total spending remains below its 2011-12 level both in real terms and on a per person basis. Total spending per person for Wales was 108% of the UK average in 2017-18, or 111% of the level in England alone. This is significantly lower than the estimated relative funding per person received through the block grant (120% of the English level). An attempt to reconcile these figures suggests that on a per person basis, non-social protection spending by the UK government is significantly lower for Wales compared with England. Capital spending per person for Wales was 4.8% lower than the UK average in 2017-18. In particular, capital spending on transport and science and technology was markedly lower. In the international context, general government expenditure for Wales is broadly in line with the average among OECD countries, similar to Ireland and Italy. However, when expressed as a share of GDP, expenditure for Wales is significantly higher. Total revenue per head in Wales is lower than the OECD average but is comparable with Hungary and South Korea. The tax-to-GDP ratio is broadly in line with the OECD average but significantly lower than the Euro-area average. Estimated fiscal balances for Wales Figure E2 provides estimates of key fiscal aggregates for assessing the strength of public finances in Wales in recent years. The balance between Welsh revenues and expenditure – or Wales’ net fiscal balance – is influenced by a range of economic factors, including the various policy decisions of the UK and Welsh governments as well as the relative performance of the Welsh economy over time. In 2017-18, Wales’ net fiscal balance was £13.7 billion, equating to 19.4% of estimated GDP. This deficit has reduced from a peak of £15.9 billion in 2009-10 (equal to 30% of GDP). The current budget balance measures the difference between current revenues and current expenditure (excluding net investment of £1.7 billion). This current budget balance for Wales is estimated at £12.0 billion in 2017-18, down from the £14.0 billion deficit recorded in 2011-12. The recent improvement in Wales’ fiscal aggregates is attributable to a reduction in total managed expenditure as a share of GDP rather than increases in revenue. Wales Fiscal Analysis | Government Expenditure and Revenue Wales 2019 7
Figure E2
Current Budget and Net Fiscal Balance: Wales and UK, 2013-14 to 2017-18 (current prices)

                                                      2013-14        2014-15        2015-16        2016-17         2017-18
    Wales
    Current Budget Balance
      £ million                                          -13,152        -12,696        -12,464        -11,883         -12,031
     % of estimated GDP                                  -21.3%         -20.1%         -19.0%          -17.4%         -17.0%
    Net Fiscal Balance
      £ million                                         -14,488         -14,249        -13,969         -13,365        -13,695
      % of estimated GDP                                 -23.5%         -22.5%          -21.3%         -19.6%         -19.4%
    UK
    Current Budget Balance
      % of GDP                                            -3.8%          -2.9%           -2.0%          -0.3%           0.0%
    Net Fiscal Balance
      % of GDP                                            -5.5%          -4.8%           -3.8%          -2.3%          -2.0%

            Source: ONS (2019) Country and Regional Public Sector Finances; ONS (2018) Regional Gross Value Added; and authors’
                                                                                                                    calculations

All four UK countries had a negative net fiscal balance in 2017-18, while only three regions of England
(London, the South East and East of England) had an estimated positive net fiscal balance. Nevertheless,
on a per person basis, Wales’ net fiscal deficit amounts to £4,370 per person, significantly greater than
the UK average of £632.

The main driver of Wales’ worse fiscal position is lower revenue, particularly from the major direct taxes.
Revenue per person raised through Income Tax and National Insurance Contributions was £1,690 lower
in Wales in 2017-18 compared to the UK as a whole. Had revenue per person from these taxes in Wales
matched the UK average, it would have yielded around £5.3 billion in additional revenue.

The outlook for Wales’ finances up to 2023-24

Total revenues in Wales are projected to grow by an average of 3.5% a year in nominal terms between
2018-19 and 2023-24. This is slower than the average growth rate of 3.8% over the previous five-year
period. Council Tax revenues are expected to grow strongly over the forecast period, increasing by 39.6%
between 2017-18 and 2023-24.

On a per person, real terms basis, total expenditure is set to recover its 2011-12 level by 2023-24. After
significant reductions in the size of Wales’ net fiscal deficit since 2009-10, it is now projected to reduce
only slightly relative to estimated GDP, from 19.4% in 2017-18 to 18.3% in 2023-24, as shown in Figure
E3.

Of course, given considerable economic and political uncertainties, not least the continued uncertainty
surrounding the terms of the UK’s departure from the European Union, trends in total revenues and
expenditure could substantially deviate from the projections contained in this report.

8                                                    Wales Fiscal Analysis | Government Expenditure and Revenue Wales 2019
Figure E3
Net fiscal balance of Wales and UK as a share of GDP, 1999-00 to 2017-18, and projections to 2023-
24
5.0%
0.0%
Net fiscal balance as % of GDP
-5.0%
-10.0%
£5.2bn
-15.0%
£13.7bn £15.6bn
£10.9bn
-20.0%
-25.0%
-30.0%
£15.9bn
-35.0%
Wales UK
Source: Authors’ calculations
Wales Fiscal Analysis | Government Expenditure and Revenue Wales 2019 91 Introduction
Government Expenditure and Revenue Wales 2019
Government Expenditure and Revenue Wales (GERW) 2019 is a second edition report presenting a
comprehensive multi-year analysis of Wales’ public sector spending, revenues and the nation’s overall
net fiscal balance. It follows a similar format to the first edition of Government Expenditure and Revenue
Wales published in 2016, with updated data and analysis. This publication is designed to enhance public
understanding of Wales’ fiscal position and contribute to the continuing debate over Wales’ fiscal and
economic future.
In contrast to the annual fiscal balance reports published and disseminated in the two other devolved
countries of the UK (Government Expenditure and Revenue Scotland, or GERS, and the Northern Ireland
Net Fiscal Balance Report), there has historically been only a small amount of disaggregated public
spending, taxation and other economic data pertaining to Wales.
In 2016, the Wales Governance Centre published an inaugural report, Government Expenditure and
Revenue Wales 2016, analysing levels of public sector revenues, expenditure and Wales’ fiscal gap,
following the framework established by the GERS publication for Scotland.1
More recently, the Office for National Statistics (ONS) has started publishing public sector revenues and
expenditure estimates for the four UK nations and nine regions of England in their Country and Regional
Public Sector Finances release, which uses a similar approach and are deemed as Experimental Statistics
(or statistics that are within their development phase). This is the source for most of the data underlying
the analysis presented in this report. By basing the analysis on ONS data, it allows for a consistent
comparison to be made between Wales’ fiscal balance and that of other UK nations and English regions.
We also supplement ONS data with more detailed analysis using HM Treasury data on public
expenditure, OECD data for international comparisons, and Office for Budget Responsibility (OBR)
forecasts to project revenues and spending for Wales over the coming years.
Aims and objectives
This report aims to present a comprehensive overview of public sector finances for Wales, including an
estimate of Wales’ net fiscal balance over time. We aim to provide key information on Welsh public
finances to interested parties in order to promote wider debate and understanding of public finances in
Wales.
Public finance in Wales has undergone significant changes in recent years, with substantial devolution of
own-sourced taxes to the Welsh Government and National Assembly. In 2019-20, around £5 billion worth
of taxes are under the control of the Welsh Government and local authorities in Wales. These
developments mark a significant shift from historic arrangements.
1 Poole,
E.G., Ifan, G. and Wyn Jones, R. (2016) Government Expenditure and Revenue Wales 2016. Cardiff University: Wales
Governance Centre.
10 Wales Fiscal Analysis | Government Expenditure and Revenue Wales 2019Historically, the UK has retained a highly centralised revenue structure, with tax policy standardly applied
across the UK and a high percentage of tax revenues collected and pooled centrally. Trends in
expenditure for Wales have also been highly linked to UK-wide expenditure, both in terms of non-
devolved expenditure for Wales (spending by Whitehall departments), and devolved expenditure by
Welsh and local government. Although policy-makers in Wales have had the freedom to allocate funds
according to different policy priorities, they have had limited influence on changing the overall level of
devolved expenditure. Fiscal devolution will, within limits, allow for more divergence in expenditure and
revenue patterns in Wales and the UK. As argued by the Silk Commission (2012) which recommended
fiscal devolution to Wales, the powers are intended to bring increased financial accountability and
empowerment.
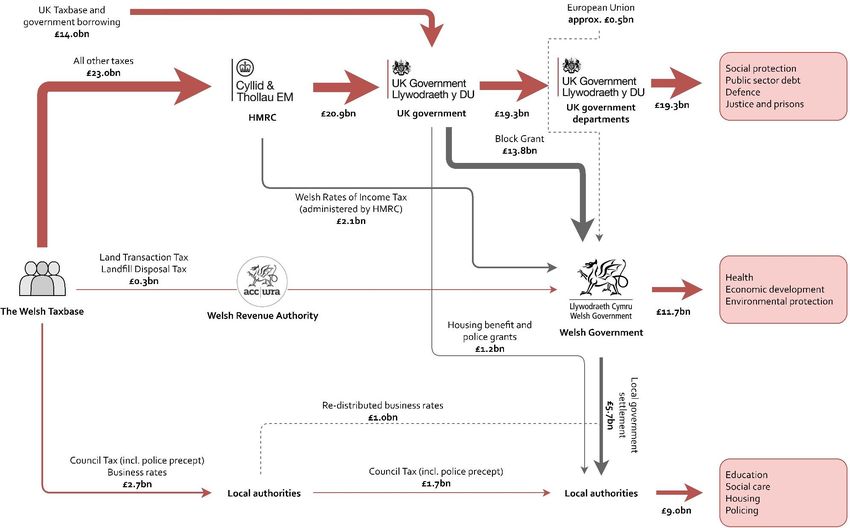
Chapters 2,3 and 4 of this report contain data up to 2017-18, the latest year for which complete outturn
data is available. This is prior to the devolution of Land Transaction Tax and Landfill Disposals Tax in
2018-19 as well as the introduction of Welsh Rates of Income Tax in 2019-20. Nevertheless, Chapter 5
does present the outlook for devolved and reserved revenues and expenditure up to 2023-24.
We publish this report at a time of considerable economic, fiscal and political uncertainty. The outcome
of the Brexit process and its impact on Welsh public finances are yet unknown. Furthermore, delays in
UK government decision-making mean that there are currently no firm spending plans set for most
departments, and fiscal policy could change significantly with the new Prime Minister and Chancellor.
This report will outline what will be at stake for Wales’ public finances over coming years and address the
following questions:
• How much public sector revenue is raised in Wales? (Chapter 3)
• What is the cost of providing the full range of public services that benefits Wales? (Chapter 4)
• To what extent do the revenues raised cover the costs of these public services? (Chapter 2)
• What is the outlook for expenditure and revenue to Wales over the coming years? (Chapter 5)
Approach to accounting
There is no formally agreed set of accounting concepts and definitions for the formulation of country and
regional fiscal accounts in the UK. Several key elements of data necessary for constructing such accounts
are also unavailable at a disaggregated level. This report uses data published by the ONS in their Country
and Regional Public Sector Finances release, which itself follows the framework established by the GERS
publication for Scotland which is certified as a National Statistics document in the UK.
The accounts are estimated for Wales on the basis of the national accounting standards adopted by the
UK government, namely the European System of Accounts 2010 (ESA10).
The approach taken by the ONS to both the revenue and expenditure sides of the public sector fiscal
accounts follows established principles in the methodology adopted for the Scotland and Northern
Ireland fiscal reports and is outlined below.
Wales Fiscal Analysis | Government Expenditure and Revenue Wales 2019 11Revenue – the ‘who pays’ principle Public sector revenue in Wales is estimated for taxes where a financial burden is imposed on residents and enterprises in Wales. The estimate is therefore based on an assessment according to the ‘who pays’ principle. The vast majority of public sector revenue in the UK is collected centrally. Under current UK Treasury accounting procedures, precise revenue collection figures for each country and region of the UK are unavailable. As with existing reports elsewhere in the UK, the ONS’ estimates Welsh public sector revenue by considering each revenue stream separately. The general approach is to take UK level data and apportion revenues to Wales using available data and various methodologies. Expenditure – the ‘who benefits’ principle Although it is relatively straightforward to account for Welsh Government and local government expenditure in Wales, deciding how a share of public expenditures that benefit Wales as well as other parts of the UK should be allocated is fraught with difficulties. Following GERS and the Northern Ireland Net Fiscal Balance Report, the ONS estimates public sector expenditures for Wales based on an assessment of what is referred to as the ‘who benefits’ principle. Public sector expenditure is deemed to be for Wales if the benefit of the service or transfer derived from the expenditure is thought to accrue to residents of Wales. Other methods of allocating public sector expenditure across regions of the UK are possible and would yield different estimates to those in this report. Notably, estimates of expenditures made for a region will differ from estimates of expenditure in a region – that is, apportionment of spending according to where the expenditure actually took place. While these two different approaches yield similar results in most cases (social protection payments or health expenditure, for example), there is greater difference in allocations for public sector spending that has broader (often UK-wide) impact. For example, the ‘in’ approach would attempt to locate UK defence expenditure to where the expenditure actually takes place. Alternatively, as in this report, the ‘who benefits’ approach apportions defence expenditure across the UK, as it is deemed that all UK residents benefit from the defence service provided. Allocating spending according to the ‘who benefits’ principle is not without its challenges. In a 1998 critique of the original Welsh Office Government Expenditure and Revenue: Wales report, Professor Phil Williams argued persuasively that the share of actual Ministry of Defence spending in Wales was significantly lower than Wales’ share of the UK population that formed the basis of the for Wales spending allocation.2 Although tracing UK expenditure to the region or nation in which the expenditure actually takes place would be of real interest, detailed and exact estimates of spending in Wales by every UK government department and agency are simply not available. Consequently, in order to provide an estimate of the full range of public services consumed for the benefit of Wales and to ensure consistency with comparable publications, this report uses ONS data which follows the for Wales methodology of apportioning public sector expenditure. Notably, this may mean that some of the expenditure allocated for the benefit of Wales and included in total expenditure in this report may have been spent outside of Wales. Such expenditure will have different effects to expenditure made inside Wales; namely, it will not lead to local economic multiplier effects and will not directly increase the tax revenues collected in Wales. 2 Williams, P. (1998) Cyfres y Cynulliad 3: The Welsh Budget. Talybont: Y Lolfa. 12 Wales Fiscal Analysis | Government Expenditure and Revenue Wales 2019
Understanding Wales’ Net Fiscal Balance and Regional Transfers in the UK

The balance between Welsh revenues and expenditure – or Wales’ net fiscal balance – is influenced by a
range of economic factors, including various policy decisions made by the UK and Welsh governments
and the relative performance of the Welsh economy over time. Public sector revenues and expenditure
are highly related to Wales’ demographics and relative economic performance; for example, lower
income and company earnings are associated with lower tax revenues, and vice versa. The net result of
these various factors will determine Wales’ net fiscal balance.

Large inter-regional fiscal transfers are not unusual internationally. Economic shocks and common
economic policies will impact regions in asymmetric ways and will trigger various stabilising forces. In
single currency areas, the absence of exchange rate adjustments requires other mechanisms to bring
about regional stabilisation.3 In economic and political unions, fiscal transfers will often meet this
requirement.

In some countries, there is an explicit system of fiscal equalisation between regions. A good example of
this is the system of redistribution between German Länder (states), developed in the aftermath of the
Second World War.4 Fiscal equalisation between countries and regions in the UK however will be largely
implicit and automatic, due to centralisation of UK public finances. The redistributive effect of transfer
payments (e.g. higher levels of social protection expenditure) and the progressivity of direct taxes (e.g.
income tax) means that the lower levels of economic activity in Wales are somewhat offset by transfers
from elsewhere in the UK.

It is important to note that the net fiscal balance reported in Chapter 2 does not constitute a direct
measure of ‘regional transfers’ from other parts of the UK. This is because the UK as a whole was also in
deficit during the analysed time period, and therefore borrowing funded some of the overall UK
expenditure.

The estimates presented in this report reflect Wales’ fiscal position under current constitutional
arrangements, and as such, are not a reflection of the finances of an independent Wales.

Overview of this report
The remainder of the report is structured as follows:

Chapter 2: presents a summary of Wales’ public sector balances using estimates of public sector revenue
to Wales and public sector expenditure for Wales. Key fiscal aggregates to assess the strength of public
finances in Wales (the current budget balance and net fiscal balance) are presented and analysed. Also
provided is a discussion of some of the reasons for Wales’ higher fiscal deficits compared to the rest of
the UK.

Chapter 3: provides detailed estimates, analysis and discussion of public sector revenue in Wales.
Detailed disaggregated estimates of individual revenue streams for the years 1999-00 to 2017-18 are
presented. The chapter also includes discussion of revenues that have been fully or partially devolved to
Wales and some international comparisons to put Wales’ current fiscal position in a wider context.

Chapter 4: provides an estimate of public sector expenditure for Wales. The composition of public
expenditure by policy function and by current and capital spending is presented an analysed. Estimates
are also presented of the expenditure by Welsh Government and local government in Wales, against
expenditure by UK government departments. Also included is a discussion of EU transactions in Wales

3   See, Mundell, R. (1961) “A Theory of Optimal Currency Areas,” American Economic Review, 51 (4): 657-65.
4   Zimmerman, H. (1989) “Fiscal Equalization between States in West Germany,” Government and Policy, 7: 385-93.

Wales Fiscal Analysis | Government Expenditure and Revenue Wales 2019                                              13
as well as an attempt to reconcile the relative funding Wales receives through the block grant from the
UK government with relative levels of total spending. Lastly, some international comparisons are
presented to put Wales’ expenditure levels in a wider context.

Chapter 5: projects trends in revenues and expenditure for Wales as well as the fiscal balance up to 2023-
24. It also includes a discussion of some of the factors that could impact these projections. Given
substantial political and economic uncertainties, trends in total revenues and expenditure could deviate
substantially from projections outlined in this chapter.

The report also includes annexes detailing the methodology for estimating Welsh GDP, generating
international comparisons and projections, the components of the accounting adjustment as well as a
comprehensive glossary.

14                                         Wales Fiscal Analysis | Government Expenditure and Revenue Wales 2019
2             Estimated fiscal balances for Wales

This chapter presents a summary of Wales’ estimated public sector balances, using estimates of current
and capital public sector expenditure for Wales and current public sector revenues to Wales. The first
section presents key fiscal aggregates and analyses how Wales’ fiscal balances have changed over time.
Also included is a discussion of some of the reasons for Wales’ higher fiscal deficits compared with the
UK as a whole. The second section examines how Wales’ fiscal balances compares with other countries
and regions of the UK.

     Key findings:

       •    Wales’ net fiscal balance in 2017-18 was a deficit of £13.7 billion, equating to 19.4% of
            estimated GDP. Excluding net investment of £1.7 billion, Wales’ current budget balance
            in the same year amounted to a deficit of £12.0 billion.

       •    The estimated net fiscal deficit for Wales peaked at £15.9 billion in 2009-10, equal to
            30% of GDP, when the UK’s deficit reached almost 10% of GDP.

       •    Revenues raised in Wales as a share of GDP has remained constant since 1999-00, at an
            average of 38.1% (higher than the UK average of 35.6%). This reflects Wales’ relatively
            low GDP.

       •    As a share of GDP, total expenditure grew from 52% in 1999-00 to 59% at the onset of
            the financial crisis in 2007-08, and then peaked at 68% in 2009-10.

       •    The reduction in Wales’ deficit since 2009-10 has resulted from a reduction in total
            managed expenditure as a share of GDP to 58%, rather than an increase in revenue.

       •    Wales’ net fiscal deficit amounts to £4,370 per person, compared with the UK average
            of £632. The main driver of Wales’ worse fiscal position is lower revenue, particularly
            from the major direct taxes (Income Tax, National Insurance contributions and
            Corporation Tax).

       •    All four countries of the UK had a negative net fiscal balance in 2017-18. Only three
            regions of England – London, the East of England and the South East of England – had
            an estimated positive net fiscal balance.

Wales Fiscal Analysis | Government Expenditure and Revenue Wales 2019                                   15
2.1 Wales’ estimated fiscal balances
Figure 2.1 provides estimates of the main fiscal aggregates for Wales for the financial years 2013-14 to
2017-18, as reported by the ONS in their 2019 edition of the Country and Regional Public Sector Finances
release.
Current revenue is the sum of all revenue raised by the entire public sector in Wales, of which the main
component is tax revenues. Public sector current expenditure refers to spending on goods and services
that are ‘consumed’ in a given year, while public sector capital expenditure refers to spending that adds
to fixed assets. Public sector capital expenditure less capital consumption is referred to as net
investment.
The current budget balance for Wales is the difference between its current revenues and current
expenditure, including depreciation. This measures the extent to which current Welsh taxpayers meet
the cost of paying for the public services they consume in the current year. Capital investment by the
public sector is excluded from this figure. The current budget balance is often seen as an indicator of
intergenerational fairness and of the sustainability of current policies.
Wales’ net fiscal balance measures the difference between total public sector expenditure (including
capital expenditure) and public sector revenue. At the UK level this gap reflects public sector borrowing
(or saving). In Wales however, this gap reflects Wales’ place in the overall fiscal arrangements of the UK
public sector.
Figure 2.1
Net fiscal balance and current budget balance for Wales and UK, 1999-00 to 2017-18
£ million, current prices
2013-14 2014-15 2015-16 2016-17 2017-18
Current budget
Current revenue 23,175 24,074 24,741 26,099 27,081
Current expenditure 34,404 34,828 35,192 35,903 37,008
Capital consumption 1,923 1,942 2,013 2,079 2,104
Current budget balance -13,152 -12,696 -12,464 -11,883 -12,031
As share of estimated GDP -21.3% -20.1% -19.0% -17.4% -17.0%
Capital budget
Capital expenditure 3,259 3,495 3,518 3,561 3,768
Capital consumption -1,923 -1,942 -2,013 -2,079 -2,104
Net investment 1,336 1,553 1,505 1,482 1,664
Net fiscal balance -14,488 -14,249 -13,969 -13,365 -13,695
As share of estimated GDP -23.5% -22.5% -21.3% -19.6% -19.4%
Source: ONS (2019) Country and Regional Public Sector Finances; ONS (2018) Regional Gross Value Added; and authors’
calculations
16 Wales Fiscal Analysis | Government Expenditure and Revenue Wales 2019As presented in Figure 2.1, Wales’ current budget balance in 2017-18 amounted to a deficit of £12.0
billion. This equates to 17.0% of Wales’ estimated GDP. Net investment (capital expenditure less capital
consumption) of £1.7 billion leaves an estimated net fiscal balance of £13.7 billion in 2017-18 (equating to
19.4% of GDP). Though the deficits on both balances grew in the year leading up to 2017-18, both fell as
a share of estimated GDP, continuing recent trends of deficit reduction.
Figure 2.2 shows a long-run series for both of these fiscal aggregates for Wales and the UK as a share of
estimated GDP (net fiscal balance in solid lines and current budget balance in broken lines), from 1999-
00 to 2017-18. At the turn of the century, while the UK as a whole had a fiscal surplus, the estimated net
fiscal balance for Wales was a deficit of £5.2 billion, equating to 14% of estimated GDP. The net fiscal
deficits of both the UK and Wales deteriorated rapidly during the recession, reflecting higher spending
and lower revenues. Wales’ net fiscal deficit peaked at approximately £15.9 billion in 2009-10, equal to
approximately 30% of GDP, while the UK’s deficit reached almost 10% of GDP.
Figure 2.2
Net fiscal balance and current budget balance for Wales and UK, 1999-00 to 2017-18
5%
0%
-5%
% of estimated GDP
-10%
-15% £5.2 bn
-20% £7.9 bn
£13.7 bn
£10.9 bn
-25%
-30%
£15.9 bn
-35%
Wales net fiscal balance UK net fiscal balance
Wales current budget balance UK current budget balance
Source: ONS (2019) Country and Regional Public Sector Finances; ONS (2018) Regional Gross Value Added; and authors’
calculations
The deficit on Wales’ net fiscal balance has reduced significantly since 2009-10, both in absolute terms
and as a share of GDP. Figure 2.3 shows the trend in both total managed expenditure (current and
capital) and current revenue as a share of GDP from 1999-00 to 2017-18. As a share of GDP, revenues to
Wales has remained broadly constant across the whole of the analysed period, at an average of 38.1%
(higher than the UK average of 35.6%). Total managed expenditure has varied significantly however,
growing from 52% of GDP in 1999-00 to 59% at the onset of the financial crisis in 2007-08. A fall in GDP
Wales Fiscal Analysis | Government Expenditure and Revenue Wales 2019 17and growth in spending (particularly social protection) meant spending spiked, as a share of GDP, to just
under 68% in 2009-10. The reduction in Wales’ deficit since 2009-10 has been a result of a reduction in
total managed expenditure as a share of GDP to 58%, rather than an increase in revenue.
Figure 2.3
Total managed expenditure for Wales and current revenues to Wales as a share of estimated GDP,
1999-00 to 2017-18
80%
70%
% of estimated GDP
60%
50%
40%
30%
20%
10%
0%
Total managed expenditure Current revenue
Source: ONS (2019) Country and Regional Public Sector Finances; ONS (2018) Regional Gross Value Added; and authors’
calculations
Figure 2.4 analyses the factors which have contributed to the reduction in Wales’ deficit from 2009-10 to
2017-18. As a share of GDP, spending has fallen across most areas. Spending on economic affairs peaked
in 2008-09 and 2009-10, partly reflecting the effects of the UK government’s financial sector
interventions apportioned to Wales (see Chapter 4), and has since declined by around 1.5% percentage
points of GDP. Over the first few years of austerity from 2009-10 to 2013-14, health spending for Wales
as a share of GDP fell by around 1.3% percentage points, and broadly grew in line with GDP thereafter.
The largest reductions in spending as a share of GDP are attributable to education (2.2% of GDP) and
social protection spending (2.1%).
The increase in VAT revenues since 2009-10 amounted to around 1.9% of GDP, reflecting the recovery
of spending levels and the increase in rates. However, this was largely offset by a decrease in Income Tax
revenues of around 1.7% of GDP. This means that increasing revenues have contributed very little to the
overall deficit reduction since 2009-10.
18 Wales Fiscal Analysis | Government Expenditure and Revenue Wales 2019Figure 2.4
Changes in Wales’ net fiscal balance as share of estimated GDP from 2009-10 to 2017-18
0.0%
-5.0%
% of estimated GDP
-10.0%
-15.0%
-20.0%
-25.0%
-30.0%
Reducing deficit Increasing deficit Net fiscal balance
-35.0%
Source: ONS (2019) Country and Regional Public Sector Finances
Figure 2.5 presents data on Wales’ current revenues, total managed expenditure and net fiscal balance
on a per person basis. Per person revenues raised in Wales stood at £8,653 in 2017-18. This amounts to
76% of the UK average, a figure which has stayed broadly constant over recent years, though down from
a peak of 80.6% in 2003-04.
Figure 2.5
Revenue, spending and net fiscal balance for Wales and UK, 2013-14 and 2017-18
2013-14 2014-15 2015-16 2016-17 2017-18
Current revenue
Per person (£) 7,513 7,781 7,974 8,375 8,653
Per person (UK=100) 75.9 76.2 76.0 75.7 76.0
Total Managed Expenditure
Per person (£) 12,209 12,387 12,477 12,664 13,030
Per person (UK=100) 106.9 106.8 107.6 107.9 108.4
Net Fiscal Balance
Wales - per person (£) -4,697 -4,606 -4,502 -4,289 -4,376
UK - per person (£) -1,521 -1,388 -1,101 -683 -632
Source: ONS (2019) Country and Regional Public Sector Finances and authors’ calculations
Wales Fiscal Analysis | Government Expenditure and Revenue Wales 2019 19Total managed expenditure per person was estimated to be £13,030 in 2017-18, or 108.4% of the UK
average. Relative spending per person for Wales has grown compared with the UK average from a low of
105.8% in 2009-10.
Because of higher levels of spending and lower estimated revenues per person, Wales’ net fiscal balance
per person amounts to £4,370, compared with the UK average of £632.
Figure 2.6 disaggregates the difference in the per person net fiscal balances of Wales and the UK, while
the figures in parenthesis show how much each element contributes to Wales’ overall net fiscal deficit of
£13.7 billion. Most of Wales’ higher spending (red bars) is attributable to higher social protection
spending per person, which is approximately £668 higher in Wales compared with the UK average. All
other spending is around £346 per person higher in Wales.
Figure 2.6
Disaggregating Wales’ net fiscal balance compared with the UK average, 2017-18 (£ per person)
UK fiscal Social Wales fiscal
balance protection Other Income tax Corporation All other balance
per person spending spending and NICs tax revenue per person
0
-500
(£2.0 bn)
-1,000
-1,500 (£2.1 bn)
(£1.1 bn)
-2,000
-2,500
-3,000
-3,500 (£5.3 bn)
-4,000 (£1.3 bn)
-4,500 (£1.9 bn) (£13.7 bn)
Fiscal balance Higher spending Lower revenue
-5,000
Source: ONS (2019) Country and Regional Public Sector Finances and authors’ calculations
However, the graph clearly shows that the main driver of Wales’ worse fiscal position is lower revenue
(yellow bars). Wales considerably lags behind the UK average in revenue per person from the major direct
taxes including Income Tax, National Insurance contributions and Corporation Tax. Revenue raised per
person through Income tax and National Insurance contributions was £1,690 lower in Wales in 2017-18.
If revenue per person from these taxes in Wales matched the UK average, it would yield £5.3 billion in
additional revenue. As discussed in Chapter 3, per person revenues from other taxes in Wales are closer
to the UK average.
The shortfall in large direct tax revenues and higher social protection spending per person for Wales
compared with the UK average also corresponds to ONS data on regional gross disposable household
income. This data shows that the primary incomes of Welsh households from wages, profits, property
20 Wales Fiscal Analysis | Government Expenditure and Revenue Wales 2019and mixed incomes was around 74% of the UK average per person in 2017. Gross disposable income
however, after accounting for taxes and benefits, was 81% of the UK average per person. This is because
current taxes on income and wealth and social contributions are around £1,700 per person lower in Wales,
and transfers and benefits to households are around £460 higher.
2.2 National and regional fiscal balances across the UK
Figure 2.7 and Figure 2.8 show the net fiscal balance of the countries and regions of the UK, on a per
person basis and as a share of their estimated GDP.
Figure 2.7
Net fiscal balance by region, 2017-18 (£ per person and % of estimated GDP)
£ per person
-6,000 -4,000 -2,000 - 2,000 4,000 6,000
London
South East England
East of England
United Kingdom
South West England
East Midlands
Yorshire and the Humber
West Midlands
Scotland
North West England
North East England
Wales
Northern Ireland
% of estimated GDP
-30% -20% -10% 0% 10%
London
South East England
East of England
United Kingdom
South West England
East Midlands
Yorshire and the Humber
West Midlands
Scotland
North West England
North East England
Wales
Northern Ireland
Source: ONS (2019) Country and Regional Public Sector Finances; ONS (2018) Regional Accounts; and authors’ calculations
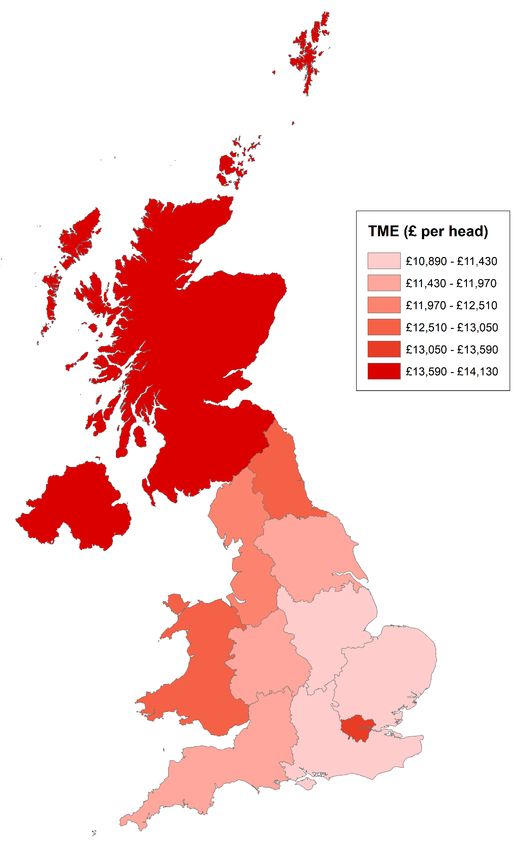
Wales Fiscal Analysis | Government Expenditure and Revenue Wales 2019 21In 2017-18, all four countries of the UK had a negative net fiscal balance, and only three regions of England
had an estimated positive net fiscal balance. From 1999-00 onwards, only London and South East
England have consistently had a positive net fiscal balance (except for 2009-10). Spending per person
ranges from £10,970 (or 91% of the UK average) in the East of England and £14,195 (117% of the UK
average) in Northern Ireland. There is greater variation in revenues per person between the countries and
regions, ranging from 76% of the UK average in Wales to 149% in London.
Figure 2.8
Net fiscal balance by country and region, 2017-18 (% of estimated GDP)
Source: ONS (2019) Country and Regional Public Sector Finances; ONS (2018) Regional Accounts; and authors’ calculations
22 Wales Fiscal Analysis | Government Expenditure and Revenue Wales 20193 Public sector revenue
This third chapter looks at public sector revenues in Wales, beginning with an analysis of recent and
historical trends. We then look at those revenues that have been fully or partially devolved to Wales
before presenting some international comparisons to put the Welsh figures in context.
Current public sector revenue, as defined in the UK National Accounts, refers to the sum of all revenue
raised in a particular year by the entire public sector, excluding the sale of assets and interest received.
The main component of this is tax revenue. The amount of tax revenues collected in a given year will
depend on the performance of the tax base (for example, on incomes, profits, value of transactions), as
well as tax policy.
The majority of public sector revenue payable by Welsh residents and businesses is collected at a UK
level. The Welsh Revenue Authority, the tax agency responsible for administering and collecting the
newly devolved Land Transaction Tax (LTT) and Landfill Disposals Tax (LDT) in Wales, had not begun
collecting taxes in 2017-18, the latest year for which complete outturn data on public sector finances is
available. This means that for most revenue sources, it is not possible to identify precisely the proportion
receivable from Wales. Instead, the ONS estimates these shares by using different methodologies to
apportion revenues to Wales in their Country and Regional Public Sector Finances release.
Key findings:
• Total current public sector revenue in Wales is estimated at £27.1 billion in 2017-18,
around 3.6% of total UK revenues of £751.8 billion.
• Revenues per head in Wales were around £8,650, significantly less than the average UK
figure of around £11,350.
• VAT was the largest source of public sector revenue (raising £6.4 billion), followed by
Income Tax (£4.9 billion) and National Insurance contributions (£4.5 billion). In the UK as
a whole, Income Tax is the largest source of public sector revenue.
• Large direct taxes (e.g. Income Tax and Corporation Tax) comprise a smaller share of
Welsh revenue, whilst a greater share is raised through indirect taxes (e.g. VAT and excise
duties).
• On a per capita basis, Council Tax revenues to Wales have increased from £250, or 79.4%
of the UK level, in 1999-00 to £475, or 97.6% of the UK level, in 2017-18.
• Total per capita revenues in Wales have trailed all other NUTS1 regions every year since
1999-00.
Wales Fiscal Analysis | Government Expenditure and Revenue Wales 2019 233.1 Composition and trends in public sector revenues for Wales 3.1.1 Composition of current revenues in Wales, 2017-18 Figure 3.1 overleaf presents an estimate of public sector revenue in Wales and the UK for 2017-18. Also highlighted is the estimated share of total revenue that each component represents, as well as how much of the UK total is raised in Wales. Current public sector revenue in Wales is estimated at £27.1 billion in 2017-8. This equated to 3.6% of total UK current revenues of £751.8 billion. This share is significantly below Wales’ population share (4.7%) but is slightly greater than its share of UK GVA (3.4%). Although Income Tax has historically been the single largest source of public revenue in Wales, more recently this has been surpassed by Value Added Tax (VAT), which at £6.4 billion, accounted for 23.6% of all current revenues in 2017-18. This figure includes VAT refunds of £0.9 billion, which are offset as expenditure in the National Accounts. In 2017-18, revenues from Income Tax in Wales amounted to £4.9 billion, accounting for 18.2% of total revenue. Income raised from National Insurance contributions amounted to £4.5 billion (16.8% of the total). Collectively, these three sources of revenue accounted for 58.6% of total current revenues for Wales. In 2017-18, Wales raised more than its per capita share of the UK total in fuel duties (4.8%), tobacco duties (5.4%), betting and gaming duties (4.9%), climate change levy (5.9%), aggregates levy (9.7%), vehicle excise duty (5.0%) and gross operating surplus (5.0%). Excise duties on alcohol and tobacco are not income contingent and therefore revenues raised from these taxes are not directly affected by relatively lower income levels in Wales. On the other hand, Wales raises significantly less than its per capita share in Income Tax (2.7%), Corporation Tax (2.3%), National Insurance contributions (3.5%) and Capital Gains Tax (1.8%). These taxes are paid on income and profit and so one would expect that Wales, with lower household income levels and GVA than the UK average, contributes less than its population share to the UK total. Gross operating surplus (GOS) refers to the operating (or trading) surpluses (or losses) of central government, local government and public corporations. Since central and local government do not generate profit, their GOS will be equal to their capital consumption, or depreciation – a measure of the fixed capital resources used up in the production process. This is treated as revenue in the National Accounts system, but is also balanced by an offsetting item within the accounting adjustment included in total managed expenditure for Wales (see Chapter 4). For public corporations however (for example Cardiff International Airport and Cardiff City Transport Services Ltd in Wales), the GOS figure includes their gross trading surpluses and various income streams. Total GOS is estimated to be £2.3 billion in Wales and is the fourth largest revenue source. This represents a higher proportion of total revenue (8.4%) in Wales than the UK as a whole (6.1%). 24 Wales Fiscal Analysis | Government Expenditure and Revenue Wales 2019
Figure 3.1
Current revenue: Wales and UK, 2017-18

                                                         WALES                               UK
                                                                                                                   Wales
                                                 £ million      % of total        £ million       % of total      as % of
                                                                                                                      UK
 VAT                                                  6,389           23.6%         142,771            19.0%          4.5%
 Income Tax                                           4,930           18.2%         180,592            24.0%          2.7%
 National Insurance contributions                     4,547           16.8%          131,547           17.5%          3.5%
 Gross operating surplus                              2,273            8.4%           45,854            6.1%          5.0%
 Council Tax                                          1,485            5.5%           32,137            4.3%         4.6%
 Fuel duties                                          1,344            5.0%           27,878            3.7%         4.8%
 Corporation tax (excl. North Sea)                    1,306            4.8%           55,722            7.4%         2.3%
 Non-domestic rates                                    1,031           3.8%          29,296             3.9%         3.5%
 Other taxes, royalties and adjustments                 892            3.3%          21,385             2.8%         4.2%
 Tobacco duties                                          472            1.7%           8,766            1.2%          5.4%
 Alcohol duties                                          457            1.7%          11,585            1.5%          3.9%
 Interest and dividends                                  327           1.2%            7,062            0.9%         4.6%
 Vehicle excise duty                                     316           1.2%            6,362            0.8%          5.0%
 Insurance premium tax                                   253           0.9%            5,898            0.8%          4.3%
 Rent and other current transfers                       231            0.9%            5,369            0.7%          4.3%
 Stamp duty land tax                                    230            0.8%           13,450            1.8%          1.7%
 Capital gains tax                                       139           0.5%            7,794            1.0%          1.8%
 Inheritance tax                                         119           0.4%            5,277            0.7%         2.3%
 Betting and gaming duties                               113           0.4%            2,316            0.3%         4.9%
 Climate change levy                                    109            0.4%            1,860            0.2%         5.9%
 Aggregates levy                                         36            0.1%              372            0.0%         9.7%
 Other taxes on income and wealth                         33           0.1%              691            0.1%         4.8%
 Landfill tax                                             32           0.1%              893            0.1%         3.6%
 Stamp duty on shares                                     10           0.0%            3,519            0.5%          0.3%
 Air passenger duty                                        7           0.0%            3,360            0.4%         0.2%
 Total current revenue (excluding
                                                     27,081          100.0%          751,756        100.00%           3.6%
 North Sea revenue)

 North Sea revenue
     Per capita share                                     61                           1,297                          4.7%
     Geographical share                                    0                           1,297                         0.0%

 Total current revenue (including North
 Sea revenue)
    Per capita share                                 27,142                          753,053                          3.6%
     Geographical share                              27,081                          753,053                          3.6%

                                     Source: ONS (2019) Country and Regional Public Sector Finances and authors’ calculations

Wales Fiscal Analysis | Government Expenditure and Revenue Wales 2019                                                     25
Figure 3.2
Main revenues as % of total current (onshore) revenue: Wales and UK, 2017-18
Wales
Value Added Tax (VAT)
Income Tax
National Insurance contributions
Local authority revenue
Corporation tax (onshore)
UK
All other revenue
0% 20% 40% 60% 80% 100%
Source: ONS (2019) Country and Regional Public Sector Finances and authors’ calculations
As shown in Figure 3.2, the composition of revenues differs between Wales and the rest of the UK. Large
direct taxes, such as Income Tax, Corporation Tax and National Insurance contributions, make up a
greater share of total revenues at a UK level than in Wales. For instance, while Income Tax represents
24.0% of total UK onshore revenues, it only accounts for 18.2% of revenues in Wales. This means that
even if a tax policy is applied uniformly across the UK, it may have different effects on revenues in Wales
compared to the rest of the UK.
On a per capita basis, public sector revenues is considerably higher across the UK than in Wales. The gap
in public sector revenues per head between Wales and the UK was around £2,700 in 2017-18. However,
current revenue as a share of estimated GDP was 38.7% in Wales in 2017-18, compared with 36.7% across
the UK.
Box 3.1: Apportioning North Sea oil and gas revenues
The ONS allocates North Sea oil and gas revenues
(mainly received from the Petroleum Revenue Tax
and Corporation Tax) using two distinct
methodologies. The first involves allocating a
population share of all revenues raised to the
countries and regions of the UK. The second
approach involves allocating revenues on a
geographic basis according to where the oilfields
that generate the revenue are located.
In this chapter, we exclude North Sea oil and gas revenue from our analysis. Since Wales is not
allocated a geographical share of North Sea revenue, this means that total current revenue raised
in Wales is equal to total revenue if North Sea oil was apportioned on a geographical basis.
26 Wales Fiscal Analysis | Government Expenditure and Revenue Wales 20193.1.2 Recent and historical trends in current revenue in Wales
Figure 3.3 shows the main components of revenue for Wales from 1999-00 to 2017-18. The effect of the
financial crisis can be clearly seen on the graph as total revenues fell by nearly £1 billion in Wales between
2007-08 and 2009-10. Revenues have since recovered, growing by 19% in real terms since 2009-10.
There are however large differences in the growth trends of the key revenue components. These reflect
changes in tax policy, largely set by the UK government, as well as changes in the tax base in Wales.
Total Income Tax revenues peaked at £5.0 billion in 2007-08, having previously steadily increased each
year. This means that Income Tax revenues in 2017-18 were 18% below their 2007-08 level in real terms.
Analysis by the Office for Budget Responsibility (OBR) suggests that the main reason for this downward
trend has been the effects of UK Government policy, particularly the significant increases in the personal
allowance, in addition to stagnant real wages.
In 2017-18, VAT accounted for 23.6% of total revenue for Wales, up from 19.5% in 1999-00. The share of
revenue generated by more regressive taxes such as VAT and excise duties has therefore increased, while
the share raised from more progressive direct taxes has fallen. This suggests that Wales’ tax regime may
have become more regressive over the past two decades.
Corporation tax now accounts for a smaller share of total revenue (4.8%) for Wales than it did in
1999-00 (5.3%). However, the share of revenue raised via corporation tax has increased over the most
recent decade, having fallen to a low of 3.4% in 2008-09, at the time of the financial crisis.
Figure 3.3
Total current revenue for Wales, 1999-00 to 2017-18, by main revenue source (nominal terms)
30,000
£ million
25,000
All other revenue
20,000
Local authority
revenue
15,000 Value Added Tax
National Insurance
10,000 Contributions
Corporation tax
5,000
Income Tax
0
Source: ONS (2019) Country and Regional Public Sector Finances and authors’ calculations
Wales Fiscal Analysis | Government Expenditure and Revenue Wales 2019 27Box 3.2: Convergence in Council Tax revenues
In recent years, per capita Council Tax revenues collected in Wales have nearly converged with
the UK level. Figure 3.4 shows the amount of Council Tax revenue raised per person in real
terms from 1990-00 to 2017-18 for Wales and the UK. In 1999-00, just over £250 per person was
raised through Council Tax in Wales, 79.4% of the UK level. Although revenues grew in real
terms over the next decade, they remained below 85% of the UK level throughout this period.
However, following the financial crisis, these levels started to converge. By 2017-18, £475 per
head was raised via Council Tax in Wales, 97.6% of the UK level (£486). Between 1999-00 and
2017-18, revenues per person in Wales had increased by 88.7% in real terms, or 169% in nominal
terms.
This convergence is a direct consequence of different policy decisions made by the Welsh,
Scottish and UK governments. Since 2012-13, the Council Tax system has operated under an
effective cap in England following the introduction of a local referendum requirement for
‘excessive’ increases. In Scotland, a Council Tax freeze was followed by a 3% cap on annual
increases, which was only lifted in 2019-20. In contrast, the Welsh Government did not impose
a formal cap on Council Tax levels. Facing deep cuts in the value of Welsh Government grants
from 2013-14 onwards, many Welsh local authorities authorised significant increases to Council
Tax bills to mitigate some of the spending cuts. This has meant that funding for local services
has been relatively better protected in Wales compared to other parts of the UK, but it has also
meant that a larger share of the tax burden has been shifted onto Council Tax payers.
In 1999-00, Council Tax accounted for 3.6% of total revenue for Wales. By 2017-18, this share
had increased to 5.5%. Although Council Tax revenues per person in Wales are still only 97.6%
of the UK average, gross disposable household income in Wales is 80.7% of the UK level. This
means that people in Wales are seeing a significantly larger share of their household income
going towards Council Tax bills. This may be particularly troubling given that Council Tax, which
is based on property values, is a relatively regressive form of taxation (Ifan & Poole 2018: 71-75).
Figure 3.4
Council Tax revenues per persons: Wales and UK, 1999-00 to 2017-18 (2017-18 prices)
500
£ per head
450
400
350
300
250
200
Wales United Kingdom
Source: ONS (2019) Country and Regional Public Sector Finances and authors’ calculations
28 Wales Fiscal Analysis | Government Expenditure and Revenue Wales 2019You can also read