Greater Center City Housing: 2020 - Strong Fundamentals (Interrupted) - Center City District
←
→
Page content transcription
If your browser does not render page correctly, please read the page content below

Housing Report 2020 | 1

CENTER CITY REPORTS

Greater Center City
Housing: 2020
Strong Fundamentals (Interrupted)
APRIL 2020
CENTER CITY DISTRICT,
CENTRAL PHILADELPHIA DEVELOPMENT CORPORATION
FIND MORE REPORTS AT:

CENTERCITYPHILA.ORG
                                                                                                                              PHOTO: PHILLY BY DRONE

This report describes market conditions as of December 31, 2019. It was researched, written and designed between January and
March 2020, before the impact of the coronavirus. Economic conditions have changed dramatically; construction has come to a halt.
While we cautioned in this report about the effects of an economic slowdown, we could not have anticipated the severity of current
conditions. However, cities have survived calamities before and it is our belief and faith that, given our strong underlying fundamen-
tals, after a time, Greater Center City and all of Philadelphia will rebound.

OVERVIEW                                                                starts located in Greater Center City, an area that represents just
                                                                        10% of the city’s land area.
A growing national preference for walkable, amenity rich, live work
places has heightened demand for downtown housing. The national         Philadelphia initially rebounded slowly from the 2007-2009 reces-
economic expansion, during which most cities added jobs faster          sion, adding jobs at the rate of 0.6% per year from 2009 to 2014.
than the national economy, augmented this trend. Philadelphia           Then, from 2014 to 2019, job growth accelerated to 1.9% per year.
enjoyed 10 consecutive years of growth, adding 84,700 jobs since        While income data is only available through 2017, Greater Center
2009. Almost half of the new jobs (46.1%) are located in Greater        City outpaced the city in wage growth: from 2009 to 2017, average
Center City, the 8.5 square miles between the two rivers and            wages citywide increased by 17%, from $49,472 to $57,725 per job,
bounded by Girard Avenue and Tasker Street.                             while wages for jobs located downtown increased during that time
                                                                        by 22% from $59,466 to $72,705.1
From 2011 to 2019, there were 16,645 new housing units completed
in Greater Center City. Based on a 2010 census count of 162,855         Demographic trends are also favorable, as the millennial genera-
residents and an average household size in Greater Center City of       tion enters the workforce and many choose downtown as a place to
1.84 individuals, Center City has added more than 31,000 residents      begin their career. The population of young adults (ages 20 to 34) in
since 2010 and now has an estimated population of 193,000.              Greater Center City increased by nearly 13,000 from 2011 to 2016,
                                                                        accounting for more than 60% of overall population growth.
The preference for cities, and Philadelphia’s improved competi-
tiveness within the region, is apparent in the changing location of     The growing preference for downtown living, demographic change
regional housing permits. In the 1990s, 3% of all regional residen-     and Center City’s strong job market all contributed to the increase
tial permits were for projects in Philadelphia. In the decade of the    in downtown housing demand. The U.S. Census Bureau’s American
2000s, following the passage of the 10-year tax abatement, 10% of       Community Survey (ACS) estimates indicate that from 2011 to 2018,
regional permits were issued in the city. Over the past decade, Phil-   the total number of households in Greater Center City increased
adelphia’s regional share jumped to 25%, with 55% of those housing      by 12% from 77,593 to 86,808. Because population growth in Center

1: U.S. Census Bureau, County and ZIP Code Business Patterns.

Center City District & Central Philadelphia Development Corporation                                                       CENTERCITYPHILA.ORG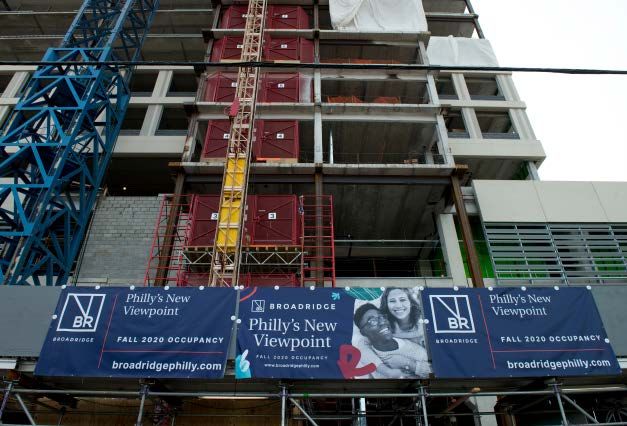
2 | Housing Report 2020

  FIGURE 1: DEFINING DOWNTOWN

                                                                        Far Northeast

                                                                                                                      GREATER CENTER CITY
                                                                                                                            (CORE + EXTENDED)
                                                                      Near
                                                                    Northeast                                                                                   GIRARD AVE

                                                                                                                        19130                                  19123
                                      Olney/            North
                                     Oak Lane        Philadelphia                                                       EXTENDED CENTER CITY
     Roxborough/
      Manayunk
                    Germantown/
                    Chestnut Hill                                                                                                                                    VINE ST

                                   North
                                Philadelphia        Bridesburg/
                                                    Kensington/                                    UNIVERSITY
                                                                                                                                         City Hall

                                                    Richmond                                             CITY          CORE CENTER CITY

                                                                                                                                     19102
               West
           Philadelphia                                                                                                 19103                        19107       19106
                                                                                                                                                                     PINE ST
                      University Greater
                        City    Center City
                                                                                                                        EXTENDED CENTER CITY

                                                                                                                       19146                                 19147
                                                                                                                                                                 TASKER ST
                                     South
                                  Philadelphia

                                                                                         DEFINING THE RESIDENTIAL DOWNTOWN:

                 Southwest                                                               The four ZIP codes between Vine and Pine streets are referred to in this report as
                Philadelphia                                                            “Core Center City” and the surrounding neighborhoods in the four adjacent ZIP codes
                                                                                         are termed “Extended Center City.” Together they form “Greater Center City” — where
                                                                                         40% of residents live and work within the same area, while another 12% work in
                                                                                         University City.

  City has skewed younger, households tend to be smaller, often                         The success downtown does not minimize the challenge experi-
  just one person, meaning it takes fewer people to fill new units.                     enced by 40% of city households that spend 30% or more of their in-
  Assuming a similar rate of growth in 2019, Greater Center City has                    come on housing, the seventh highest proportion of cost-burdened
  added 10,500 new households since 2011 and was on pace to add                         households among the 25 largest U.S. cities. The problem, however,
  an additional 3,000 households this year.                                             does not result from high local housing costs. The median housing
                                                                                        value in Philadelphia is $156,800, significantly more affordable than
  Growth in households with rising incomes is why housing prices
                                                                                        18 of the 25 largest cities, well below San Francisco ($1,009,500),
  and rents continued to increase in the core, even as the supply
                                                                                        New York City ($570,500), Washington, D.C. ($568,400), Boston
  expanded. It is also why the circle of rehabilitation and new con-
                                                                                        ($487,300), and Chicago ($246,500). Similarly, Philadelphia’s median
  struction continued to radiate outward, providing more affordable
                                                                                        rent of $1,007 places us 17th among the 25 largest cities and below
  alternatives, usually with good transit connectivity to Center City
                                                                                        San Francisco ($1,805), Boston ($1,539), Washington, D.C. ($1,487),
  and University City.
                                                                                        New York City ($1,396), and Chicago ($1,077).2
  In Greater Center City, population density has increased to 60 per-
                                                                                         Philadelphia’s challenge comes from the very low incomes that are
  sons per acre, four times the density of surrounding suburbs. This
                                                                                         the byproduct of decades of job loss and the relatively slow pace of
  fueled greater demand for retail services, not only in the core but
                                                                                         the city’s economic rebound since the recession. Unlike many peer
  also along reviving corridors in most of the extended neighborhoods.
                                                                                         cities that have now surpassed their 1970 job levels, Philadelphia
  Large format and moderate sized grocery stores, once the exception
                                                                                         still has 19% fewer jobs than 50 years ago.3 One consequence is that
  downtown, now number 30 across Greater Center City.
                                                                                         Philadelphia’s median household income in 2018 was $46,116, 23rd
                                                                                         lowest among the top 25 cities.4

  2: U.S. Census Bureau, American Community Survey, 2018 five-year estimates.
  3: U.S. Bureau of Labor Statistics, Current Employment Statistics.
  4: U.S. Census Bureau, American Community Survey, 2018 five-year estimates.

  CENTERCITYPHILA.ORG                                                                                      Center City District & Central Philadelphia Development Corporation
Housing Report 2020 | 3

However, the growth in jobs, salaries, sales, business and construc-
                                                                                      WHAT WAS BUILT IN 2019:
tion activity in the last decade resulted in a 39% real increase in
municipal tax revenues, from $2.95 billion in 2009 to $4.11 billion                   In 2019, 2,142 new units were completed in Greater Center City,
in 2019, enabling local government to fund an increase in educa-                      defined as the eight ZIP codes between Girard Avenue and Tasker
tion, social services, housing subsidies and many other municipal                     Street, from river to river (Figure 1). Core Center City contained 714
programs. Downtown is the locus for much of this growth. Greater                      of these units; another 1,428 are located in the extended neighbor-
Center City holds 42% of all jobs in Philadelphia, providing on aver-                 hoods. The new supply was comprised of 327 single-family units,
age 25% of the employment for working residents from neighbor-                        1,697 apartments and 118 condominiums. This was the seventh
hoods across the city.                                                                consecutive year that completions exceeded 1,500 units and apart-
                                                                                      ments dominated the new supply (Figure 2).
Recent growth provides an opportunity for City government to cre-
atively compensate for the reduction in federal funds for affordable                  While there were 668 fewer completions in 2019 than in 2018, this is
housing and other services, but only if it can do so without damp-                    not a sign of diminished demand, but rather the result of a widening
ening market activity, which is still largely limited to just 17% of the              of the area in which downtown-oriented, residential development is
city’s total geography. Ultimately, broader and faster job growth and                 occurring.
the addition of more family sustaining jobs is the best way to help                   More than 15 years ago, CCD defined the communities between
all city residents to enjoy decent, safe and quality housing, while                   Girard Avenue and Tasker Street, river to river, as “Greater Center
also ensuring continued growth in the tax base needed to finance                      City” based on their emerging live-work characteristics. While an
public services.                                                                      average of 25% of the employed residents of citywide neighborhoods
                                                                                      work downtown, between Girard and Tasker that number climbs to
                                                                                      just over 40% with almost two-thirds commuting to work without a
                                                                                      private automobile.

                                                                                      In the last three years, construction burst through those boundaries.
                                                                                      In the three ZIP codes just north of Girard Avenue (19121, 19122 and
                                                                                      19125) 2,059 new residential units were completed in 2019, almost
                                                                                      equaling the total number delivered within Greater Center City (Fig-
                                                                                      ure 3). In the two ZIP codes south of Tasker Street, 19145 and 19148,

                                         2,142                                        another 181 units were completed in 2019, so that the total in the
                                                                                      adjacent neighborhoods exceeded the volume between Girard and
                                                                                      Tasker. As of 2017, 31% of employed residents in the neighborhoods
                                         new units of housing
                                                                                      above Girard Avenue work within Greater Center City.
                                         were completed in
                                         Greater Center City                          Together, the eight ZIP codes of Greater Center City, plus the five
                                         in 2019                                      immediately adjacent ZIP codes, were the setting for 4,382 housing
                                                                                      completions, 80% of the 5,490 housing units completed citywide in
                                                                                      2019 (Figure 4).

FIGURE 2: GREATER CENTER CITY HOUSING COMPLETIONS, 2000–2019

                                                                                                                  Apartment               Condo                Single Family

3,000

                                                                                                                                                                353       353
2,500
                                                                                                                                                    488         180       180
2,000                                                                                                                                               276                    327
                                                                                                                                                                           118
1,500

1,000

 500

                                                                                                                                                    1,916      2,277      1,697
    0
         2000    2001    2002    2003    2004    2005    2006    2007   2008   2009   2010   2011   2012   2013   2014       2015        2016       2017       2018        2019
                                                                                                                  Source: City of Philadelphia Department of Licenses and Inspections

Center City District & Central Philadelphia Development Corporation                                                                                      CENTERCITYPHILA.ORG
4 | Housing Report 2020

                                    19121

                                                                            19122
                                                                                                                                             19125

                                                19130
                                                                                                          19123

                                                                               19107
                                                  19103

                                                                    19102                                           19106

                                                                          19109

                                    19146

                                                                                                                         19147

                                        19145                                                                             19148

      FIGURE 3: HOUSING COMPLETIONS BY AREA OF CENTER CITY

       Unit Count:
           5 or less      100-200                       Single Family               Core Center City
           6-25                                         Apartments                  Extended Center City
           26-50          Greater than 200                                          ZIP Code Boundary

           51-100
  CENTERCITYPHILA.ORG                                          Source: City of Philadelphia Department of Licenses and Inspections
                                                                                                        Center City District & Central Philadelphia Development Corporation
Housing Report 2020 | 5

FIGURE 4: HOUSING COMPLETIONS BY AREA, 2019                                                              WHAT'S IN THE PIPELINE?
                                                                                                         Based on the volume of permits issued in 2019 for work in progress,
 AREA                                                 COMPLETED
                                                                                     % OF                the market was still accelerating. There were 3,982 units under
                                                                                COMPLETED
 (ZIP CODE BASE)D)                                        UNITS
                                                                                    UNITS                construction in Greater Center City and another 2,780 units in prog-
                                                                                                         ress in the five ZIP codes adjacent to Greater Center City, repre-
 GREATER CENTER CITY                                              2,142                       39%
                                                                                                         senting almost 70% of all new units in production citywide (Figures
 Core Center City                                                    714                      13%        5, 6). Given the size of many of these projects, many may not deliver
   Core West (19102, 19103)                                          179                        3%       until 2021 or early 2022.
   Core East (19106, 19107)                                          535                      10%        In the last two decades, most of the obvious infill sites in core Cen-
 Extended Center City                                             1,428                       26%        ter City were redeveloped. Recent construction has generally been
   Extended Northwest (19130)                                        552                      10%        limited to high-rise development on what had been parking lots or
                                                                                                         parking garages. While there were only 82 building permits issued
   Extended Northeast (19123)                                        159                        3%
                                                                                                         for core Center City in 2019, these projects will deliver more than
   Extended Southwest (19146)                                        577                      11%        1,000 new multifamily units.
   Extended Southeast (19147)                                        140                        3%
                                                                                                         Construction activity in extended Center City was more dispersed
 ADJACENT ZIP CODES                                               2,240                       41%        with large volumes of single-family homes. However, there were
 Adjacent North                                                   2,059                       38%        also clear clusters of townhouse construction, as well as a signif-
   Adjacent Northwest (19121)                                        685                      12%        icant number of moderate and large sized apartment buildings in
                                                                                                         the works (Figure 7).
   Adjacent North (19122)                                            913                      17%
   Adjacent Northeast (19125)                                        461                        8%       Examples of the major new multifamily projects underway in core
                                                                                                         Center City include The Laurel, set to be the tallest residential
 Adjacent South                                                      181                        3%
                                                                                                         building in Philadelphia, bringing 189 apartment units and 60 con-
   Adjacent Southwest (19145)                                        110                        2%       dominiums to the market by 2021. Dranoff Properties’ ArtHaus will
   Adjacent Southeast (19148)                                          71                       1%       add 111 condominium units on South Broad Street. River Walk, on
 GREATER CENTER CITY AND                                                                                 the Schuylkill riverfront north of JFK Boulevard, will include more
                                                                  4,382                       80%
 ADJACENT ZIP CODES                                                                                      than 700 residential units in two towers and a Giant supermarket.
 CITYWIDE TOTAL                                                  5,490                      100%         North of Vine Street, a large mixed-use residential tower at 1300
                                                                                                         Fairmount Avenue broke ground in 2019. It will include an Aldi gro-
                                                                                                         cery store and space leased to Chesterbrook Academy Preschool.
                                   Source: City of Philadelphia Department of Licenses and Inspections

                         70% of permits for housing units citywide have been
                         issued in just 13 of Philadelphia’s 48 ZIP codes.

FIGURE 5: NUMBER OF NEW RESIDENTIAL UNITS RECEIVING PERMITS CITYWIDE, 1990-2019

5,000
                                                                                                                                                                                         4,566

4,000

3,000

2,000

1,000   747

    0
        1990 1991 1992 1993 1994 1995 1996 1997 1998 1999 2000 2001 2002 2003 2004 2005 2006 2007 2008 2009 2010 2011 2012 2013 2014 2015 2016 2017 2018 2019
                                                                                                                                                Source: U.S. Census Bureau, Building Permits Survey

Center City District & Central Philadelphia Development Corporation                                                                                               CENTERCITYPHILA.ORG
6 | Housing Report 2020
Delta Associates tracks large, new construction apartments, which
they term Class A. They project 2,655 units will be delivered within
the next three years.5 Since apartments in large projects enter the
market by the hundreds and, absent substantial pre-leasing, ten-
ants move in at the rate of 10 to 20 per month, some initial period of
high vacancy will be inevitable in these new developments.
In the three ZIP codes north of Girard Avenue, there were 2,453
units under construction. The greatest concentration is in ZIP code
19122, home to Temple University’s main campus, and bounded by
Front and Broad streets, Girard Avenue to Susquehanna Avenue.
This area is well-served by three stops on the Market Frankford
Line, two stops on the Broad Street Line and by a major regional
rail stop for Temple University. The balance of units underway north
of Girard Avenue split almost evenly, east and west, between ZIP
codes 19121 and 19125.
FIGURE 6: HOUSING UNITS IN PROGRESS BY
AREA OF CENTER CITY, 2019
% OF
AREA UNITS UNDER
UNITS UNDER
(ZIP CODE BASED) CONSTRUCTION
CONSTRUCTION
GREATER CENTER CITY 3,982 41%
Core Center City 1,025 11%
Core West (19102, 19103) 820 8%
Core East (19106, 19107) 205 2%
Extended Center City 2,957 31%
Extended Northwest (19130) 530 5%
Extended Northeast (19123) 1,410 15%
Extended Southwest (19146) 783 8%
Extended Southeast (19147) 234 2%
ADJACENT ZIP CODES 2,780 29%
Adjacent North 2,453 25%
Adjacent Northwest (19121) 757 8%
Adjacent North (19122) 1,019 11%
Adjacent Northeast (19125) 677 7%
Adjacent South 327 3%
Adjacent Southwest (19145) 123 1%
Adjacent Southeast (19148) 204 2%
GREATER CENTER CITY AND
6,762 70%
ADJACENT ZIP CODES
CITYWIDE TOTAL 9,690 15,100%
Source: City of Philadelphia Department of Licenses and Inspections
5: Delta Associates, Philadelphia Class A Apartment Market Report, 4th quarter report 2019.
CENTERCITYPHILA.ORG Center City District & Central Philadelphia Development CorporationHousing Report 2020 | 7
19121
19122
19125
19130
19123
19107
19103
19102 19106
19109
19146
19147
19145 19148
FIGURE 7: HOUSING UNDER CONSTRUCTION BY AREA OF CENTER CITY
Unit Count:
5 or less 100-200 Single Family Core Center City
6-25 Apartments Extended Center City
26-50 Greater than 200 ZIP Code Boundary
51-100
Source: City of Philadelphia Department of Licenses and Inspections
Center City District & Central Philadelphia Development Corporation CENTERCITYPHILA.ORG8 | Housing Report 2020
tration of amenities in the core of downtown. Within core Center
HOUSING COSTS AND ABSORPTION:
City, rents peaked at $2.24 per square foot in Rittenhouse Square
RENTAL MARKET TRENDS: adjacent to the downtown office district and University City. In ex-
The strength of the Greater Center City housing market over the last tended Center City, median rents ranged from $1.72 per square foot
the decade was evident in increased market activity, rising rents in Graduate Hospital to $1.15 per square foot in Grays Ferry. North
and home prices. However, the recent surge in construction of Girard Avenue, median price came in at $1.33 per square foot in
and significant increase in supply meant that in core Center City Fishtown and at $0.95 per square foot in Upper Kensington.
median rents in both new and existing apartments declined
Focusing on just Class A new construction, as categorized by Delta
about 5% from their 2016 peak. At $1.92 per square foot, they
Associates, rents are considerably higher. Delta’s 2019 survey
remained stable throughout the last decade. Still, as expanding
calculated the average Center City Class A rent per square foot
demand was accommodated by new supply in adjacent neighbor-
at $2.72, up 4.1% from 2018. They also reported the absorption of
hoods, rents in the extended neighborhoods of Center City rose by
1,475 recently constructed units in Center City in 2019, down slightly
15.4% since 2011 and by 30.7% in the five adjacent ZIP codes (Figure
from the 1,527 units occupied in 2018. They calculate Center City’s
8). Nonetheless, on average the extended neighborhoods remain
overall Class A apartment vacancy rate in 2019 at 6.5%, well below
26% less expensive than the core with the next ring of adjacent ZIP
the 11.9% vacancy rate in 2018. If buildings in the initial lease-up
codes 40% more affordable.
phase are excluded, the calculated vacancy rate falls to 5.1%.
The Zillow Rent Index data for rent per square foot by neighborhood
clearly point to the impact of proximity to work and to the concen-
As new supply came onto the market and demand increased,
rents leveled off in core Center City but continued to rise in
the extended and adjacent neighborhoods.
FIGURE 8: AVERAGE RENT PER SQUARE FOOT, 2010-2019
$2.50
$1.97 $2.04 $2.00
$2.00
$1.93 $1.94 $1.94 $1.91 $1.92
$1.87
$1.50 $1.37 $1.42 $1.44 $1.39 $1.42
$1.28 $1.31
$1.23 $1.24
$1.00
$1.11 $1.09 $1.15
$1.04 $1.08
$0.88 $0.89 $0.92 $0.96
$0.50
2011 2012 2013 2014 2015 2016 2017 2018 2019
Core Center City Extended Center City Adjacent ZIP Codes Source: Zillow Rent Index
CENTERCITYPHILA.ORG Center City District & Central Philadelphia Development CorporationHousing Report 2020 | 9
FIGURE 9: RENT PER SQUARE FOOT BY NEIGHBORHOOD, GREATER CENTER CITY
AND ADJACENT NEIGHBORHOODS, 2019
Median Rent Per Square Foot Core Center City Extended Center City Adjacent ZIP Codes
$2.50
$2.00
$1.50
$1.00
$0.50
$0.95
$2.24
$1.50
$1.05
$2.01
$1.96
$1.98
$1.86
$1.59
$1.62
$1.29
$1.93
$1.25
$1.53
$1.35
$1.52
$1.52
$1.23
$1.23
$1.23
$1.33
$1.87
$1.72
$1.61
$1.14
$1.31
$1.19
$1.15
$1.17
$0.00
Graduate Hospital
West Kensington
Callowhill
Old City
Pennsport
East Kensington
Old Kensington
Upper Kensington
Rittenhouse
Bella Vista
West Poplar
Society Hill
Fitler Square
Washington Square
Logan Square
Grays Ferry
Chinatown
Spring Garden
Fairmount
Hawthorne
Riverfront
Northern Liberties
Passyunk Square
Fishtown
Francisville
Dickinson Narrows
Newbold
Point Breeze
Brewerytown
*Based on Zillow Neighborhood Boundaries
Source: Zillow Rent Index
super-heated markets like New York, Boston, San Francisco, Seattle
HOUSING COSTS AND ABSORPTION:
or Vancouver. Growth in our residential core is not constrained on
FOR SALE HOMES all sides by rivers or bays and adjacent areas enjoy excellent transit
connectivity to Center City and University City.
Based on data assembled by the Multiple Listing Service (MLS), in
2019, there were 3,024 completed sales of both new and existing SEPTA reports that since 2001, there has been a 78% increase in
homes within Greater Center City, a 13% decline from 2018. At the boarding on the Market-Frankford Line stops in Fishtown and Kens-
same time average sale price increased 3% to $498,904, primarily ington. In response, SEPTA increased the frequency of train service
driven by higher sale prices on the eastern side of core Center City on this line, eliminating express A and B stop routes. They are also
and the southwest portion of extended Center City. Like rental units, exploring how to lengthen the platforms on the underground stops
proximity to downtown is a key variable in pricing: houses in the core on Market East to accommodate longer trains. The Broad Street
sold for 45.9% more than houses in the extended neighborhoods Line and multiple bus routes also provide excellent connectivity from
(Figure 10). other adjacent areas. An Econsult Solutions analysis determined
that close proximity to public transit lines increased residential
The velocity at which houses sold also increased across Greater
property values by 17%.6
Center City as the time on the market declined in 2019 by 21% to 85
days, the lowest level of the past decade (Figure 11). Similar to Greater Center City, in the adjacent ZIP codes the average
number of days that houses remained on the market after listing
As with rentals, the geographic expansion of the market increased
dropped by 26% from 2018 to 2019 to just 70 days, suggesting an
options for buyers and moderated cost. Prices in the five adjacent
even stronger demand for these neighborhoods than those in Great-
ZIP codes, north and south of Greater Center City, increased by 6%
er Center City.
from 2018 to 2019 and more than doubled in the last decade, from
$146,800 in 2010 to $297,300 in 2019. Overall, the average sale price in core Center City increased by 35%
from 2010 to 2019 and by 47% in extended Center City. Taken togeth-
Nonetheless, homes in these adjacent neighborhoods sold for less
er, the overall Greater Center City average residential sale price rose
than half the cost of those in the core and at two-thirds the price of
by 41%, from $353,700 to $498,900, from 2010 to 2019.
those in the extended neighborhoods. This highlights a significant
In the five adjacent ZIP codes, the average price rose by 103%
topographical and affordability advantage that Philadelphia has over
(Figure 12).
6: Econsult Solutions, "SEPTA Service: A Value Proposition for Philadelphians," July 2019.
Center City District & Central Philadelphia Development Corporation CENTERCITYPHILA.ORG10 | Housing Report 2020
FIGURE 10: MLS BROKERED RESIDENTIAL SALES IN GREATER CENTER CITY AND ADJACENT ZIP CODES, 2019
% CHANGE AVERAGE % CHANGE DAYS ON % CHANGE
AREA SALES
FROM 2018 PRICE FROM 2018 MARKET FROM 2018
GREATER CENTER CITY 3,024 -13% $498,904 3% 85 -21%
Core Center City 803 -3% $648,811 4% 115 -9%
Core East (19106, 19107) 379 -9% $555,276 9% 107 -24%
Core West (19102, 19103) 424 +1% $732,418 -1% 122 4%
Extended Center City 2,221 -16% $444,705 1% 75 -28%
Extended Northwest (19130) 482 -13% $416,511 -1% 67 -17%
Extended Northeast (19123) 227 -39% $487,970 -1% 85 -95%
Extended Southwest (19146) 942 -9% $421,069 5% 69 -39%
Extended Southeast (19147) 570 -20% $490,378 -1% 80 4%
ADJACENT ZIP CODES 2,566 -6% $287,302 6% 70 -26%
Adjacent North 1,308 -6% $335,027 8% 69 -25%
Adjacent Northwest (19121) 334 -5% $251,293 14% 75 +9%
Adjacent North (19122) 250 -16% $378,909 11% 68 -68%
Adjacent Northeast (19125) 724 -4% $358,503 6% 64 -18%
Adjacent South 1,258 -6% $258,078 4% 71 -33%
Adjacent Southeast (19148) 657 -6% $272,199 2% 70 -33%
Adjacent Southwest (19145) 601 -5% $242,642 5% 72 -33%
GREATER CENTER CITY AND
5,590 -9% $406,362 3% 95 -23%
ADJACENT ZIP CODES
Source: MLS Note: Data does not include the full month of December.
FIGURE 11: DAYS ON MARKET, GREATER CENTER CITY, 2010-2019 INDEXED VALUE:
The average prices tracked by MLS are not quality
250 controlled for specific home characteristics nor for
home size, so they are not a precise measure of
the market. A lower average sale price in one year
200
does not necessarily mean that the market value
of all homes, or even the “average” home, has
150 declined. All it represents is that the average value
of the homes that changed hands in that year was
100 lower than the value of homes that changed hands
in the previous year. Houses that sold in one year
may have been larger, newer or with more ameni-
50
ties, like on-site parking or a large garden or roof
deck than houses sold in prior years.7
160 203 163 141 115 127 105 93 103 85
0
2010 2011 2012 2013 2014 2015 2016 2017 2018 2019 Econsult Solutions calculates a Philadelphia
Source: MLS Housing Index (PHI) for the city a as a whole and
for select neighborhoods. PHI controls for chang-
es in the type of housing sold each year. Calcula-
tions for Greater Center City show an increase of
0.7% in 2019, and appreciation in 16 of the last 19
years (Figure 13).
7: In order to control for variations in the size and quality of homes that sell, economists create house price indices that use regression models to isolate the effect of time on
market values, holding all other characteristics equal.
CENTERCITYPHILA.ORG Center City District & Central Philadelphia Development CorporationHousing Report 2020 | 11
FIGURE 12: AVERAGE HOME SALE PRICE, 2010–2019
$800,000
$700,000 $648,811
$600,000
$482,374
$500,000 $444,705
$400,000
$302,381 $297,302
$300,000
$200,000 $146,806
$100,000
2010 2011 2012 2013 2014 2015 2016 2017 2018 2019
Core Center City Extended Center City Adjacent ZIP Codes Source: MLS
FIGURE 13: ECONSULT HOUSING PRICE INDEX, GREATER CENTER CITY, 2001-2019
20%
15.0% 15.0%
15%
13.1% 13.6%
9.4% 9.3% 10.0%
10% 8.7%
7.2% 6.3% 7.0%
5%
4.4%
2.4% 2.1%
1.1% 0.7%
0%
-5%
-4.5% -5.3% -5.7%
-10%
2001 2002 2003 2004 2005 2006 2007 2008 2009 2010 2011 2012 2013 2014 2015 2016 2017 2018 2019
Source: Econsult Solutions Inc, Phialdelphia Housing Index
value in Philadelphia is $156,800, significantly less expensive than
DRIVERS OF DEMAND: JOBS,
18 of the 25 largest cities, well below San Francisco ($1,009,500),
AMENITIES AND DEMOGRAPHICS New York City ($570,500), Washington, D.C. ($568,400), Boston
More than half (53%) of all of Philadelphia’s jobs are located in ($487,300), and Chicago ($246,500). Philadelphia’s median rent of
Center City and University City, at the center of an improving transit $1,007 places us 17th among the 25 largest cities and below San
system. Employment growth in these two nodes is a prime driver of Francisco ($1,805), Boston ($1,539), Washington, D.C. ($1,487),
housing demand. Ease of access to hundreds of restaurants, cafes, New York City ($1,396), and Chicago ($1,077).
cultural organizations and events, health and wellness establish- Philadelphia’s colleges and universities have long played a special
ments and other urban amenities adds significant appeal to house- role in generating demand for downtown housing. Many students,
holds of all ages. faculty, administrators and medical staff choose to rent and pur-
Despite significant challenges for those with limited incomes, dis- chase in proximity to these institutions. Most important, a growing
cussed below, affordability is a powerful lure. The median housing percentage of the 28,000 annual recipients of bachelor’s and higher
Center City District & Central Philadelphia Development Corporation CENTERCITYPHILA.ORG12 | Housing Report 2020
degrees from Philadelphia’s colleges and universities who secure
CAN THIS BE SUSTAINED?
their first position with a downtown or University City employer,
choose to live in the city. Just as baby boomers shaped the first According to the Department of Licenses and Inspections, there
wave of stay-in-the-city, reinvestment in the 1970s, the current were 16,645 housing units completed in Greater Center City from
millennial generation, now larger than boomers, is a prime driver 2011 to 2019. This data however, does not subtract existing units
of downtown housing demand. that might have been demolished to make way for construction.
Nor does it show how many units may have been withdrawn from
In core Center City, 20- to 34-year-olds account for 45% of the the market, or combined, as in the case of a multi-unit row house
population. At the beginning of careers, they are a major source converting to a single family home, or a condominium owner joining
of apartment demand. Their dominance also explains why only 5% adjacent units together.
of the population is of school age (ages 5 to 19) and why the average
household size is 1.62 persons compared to the regional average Nonetheless, the new supply appears to be substantially more than
of 2.61. the 10,531 new households estimated for the same period by ACS.
Even assuming a “surplus” of 6,114 new units being delivered to
The next largest cohort in core Center City, at 21%, are those ages the market, this is occurring in a Greater Center City with nearly
35 to 54. They are followed closely (19%) by boomers (ages 55 to 74) 100,000 housing units. ACS does show the rental vacancy rate in-
who have either aged in place or more recently returned downtown creasing from 5.7% in 2015 to 8% in 2018 for core Center City (from
from the suburbs as empty-nesters. 1,292 to 1,915 vacant rental units) and rising from 5.9% to 7.5% for
the same period in extended Center City (from 1,748 to 2,347 vacant
While millennials are also a plurality in the extended neighborhoods,
units) (Figure 15).
the 35 to 54 age group rises here to 25% and school age children
increase to 15% of the total population. The homeownership rate These factors suggest some degree of oversupply in the rental
also rises from 33% in the core to 48% in the extended neighbor- housing market, experienced both in older units competing with
hoods (Figure 14). newer product and in recently completed developments still in the
lease-up phase. Still, the rental prices trends in Figure 8 do not
suggest any dramatic problem with oversupply but do show the
FIGURE 14: POPULATION AND HOUSING CHARACTERISTICS OF CENTER CITY, PHILADELPHIA, AND REGION
CORE EXTENDED GREATER PHILADELPHIA
PHILADELPHIA
CENTER CITY CENTER CITY CENTER CITY METRO
Population Density* 60 47 51 39 15
Average Household Size 1.62 2.14 1.88 2.57 2.61
Percent of Households Owner Occupied 33% 48% 43% 53% 67%
Percent of Households with Children 6% 16% 12% 23% 27%
Percent Bachelor's or More 78% 59% 65% 29% 37%
Median Household Income $81,464 $68,627 $75,713 $43,744 $69,465
Non-Auto Commuting Mode Share 71% 58% 62% 41% 19%
Percent No Vehicle Households 43% 31% 37% 30% 13%
AGE DISTRIBUTION
Percent under 5 3% 6% 5% 7% 6%
Percent 5-19 5% 9% 8% 18% 19%
Percent 20-34 45% 38% 40% 26% 21%
Percent 35-54 21% 25% 24% 24% 26%
Percent 55-64 9% 10% 10% 12% 13%
Percent 65 and over 18% 12% 14% 13% 15%
*Population weighed people per acre
Source: U.S. Census Bureau, American Community Survey, 2018 five-year estimates
CENTERCITYPHILA.ORG Center City District & Central Philadelphia Development CorporationHousing Report 2020 | 13
FIGURE 15: RENTAL HOUSING VACANCY RATE IN CORE AND EXTENDED CENTER CITY, 2011-2018
Core Center City Extended Center City
10%
8%
6%
4%
2%
6.4%
8.0%
6.9%
6.6%
5.9%
6.2%
6.7%
5.7%
7.5%
7.5%
7.5%
7.2%
7.3%
7.3%
7.7%
6.1%
0%
2011 2012 2013 2014 2015 2016 2017 2018
Source: U.S. Census Bureau, American Community Survey, 2018 five-year estimates
moderating effect that new units are having on the price of The third variable is demography. While there is no precipitous drop
existing supply. nationally in the age cohort who are now entering college and will
begin to graduate after the middle of this decade, we are past the
On the ownership side, the increase in supply has been much more
peak millennial bulge both nationally and regionally. From 2011
modest and both sales prices and the speed at which sales are
to 2016, the number of 20- to 34-year-olds in Greater Center City
occurring suggest no softening in this part of the market.
increased from 57,300 to 70,100, growing at an average of 2,559
With more supply in the pipeline and with developers accelerat- per year and accounting for 62% of the overall population growth.
ing schedules in advance of the end of the 10-year abatement for From 2016 to 2018, however, there was a substantial slowing in the
new rental construction at the end of 2020, the largest variable is growth rate of new residents of this age to just 108 per year, based
uncertainty about the national economy. Employment and wage on annual estimates. Much of this change is accounted for by an
growth stand behind housing demand. Figure 2 shows how housing actual decrease in the number of 20-24 year olds in Greater Center
production can slow dramatically in an economic downturn. The City from 15,307 in 2011 to 13,322 in 2016 to 11,065 in 2018. While
positive aspect of Philadelphia’s slow growth economy and our many of those still in this category between 2011 and 2016 aged in
heavy reliance on education and health care employment is that the place, or moved to other parts of Philadelphia or outside the city,
city is less susceptible to the highs and lows experienced by faster they were not replaced one-for-one by new residents just entering
growth cities. In the last recession, Philadelphia shed jobs later, fell their twenties.
less far and rebounded faster than the national economy. As Econ-
Fewer 20-somethings means reduced apartment demand. This
sult’s housing price index shows (Figure 13), Center City has only
makes it all the more important for Philadelphia to achieve more
experienced three years of depreciation in the last three decades.
robust growth with family sustaining jobs that pay annual salaries
Schools have become far less of a constraint than two decades ago. between $35,000 and $100,000.8 This would enable Philadelphia to
Due to significant parental involvement and responsiveness by the retain an even larger share of college graduates and well-educated
School District, 70% of students in Greater Center City’s 12 ele- workers as they reach their mid-30s, form businesses, see salaries
mentary public schools now come from their immediate catchment rise and begin to raise children.
areas. Progress has been so substantial that seven of those 12
A final variable affects not only housing markets, but also retail
elementary public schools are wrestling with problems of success
sales, leasing and Philadelphia’s burgeoning hospitality indus-
in which neighborhood demand exceeds their school’s capacity.
try. This is the upsurge in quality of life challenges downtown and
Greater Center City benefits too from the presence of 13 private and
in many neighborhoods issuing from opioid addiction, increased
parochial schools. Several years ago, Germantown Friends located
homelessness, panhandling and the impact of modified, munici-
a nursery school adjacent to Independence Hall to serve as feeder
pal enforcement practices relating to problematic public behavior
for its main campus in the northwest. Nonetheless, the limited
and crime trends. Surveys show that concerns about these trends
number of high quality middle and high schools can be a constraint
increase significantly among those over 35.9
on housing demand as younger households start families.
8: Center City District, "Growing More Family Sustaining Jobs in Philadelphia," October 2019
9: Center City District, "Two-Handed Solutions," Center City Digest, Winter 2019.
Center City District & Central Philadelphia Development Corporation CENTERCITYPHILA.ORG14 | Housing Report 2020
These statistics are a reminder about how limited the areas of res-
THE AFFORDABILITY CHALLENGE:
idential reinvestment actually are within Philadelphia, amounting
In 2018, 42% of all Philadelphia households paid at least 30% of
to about 17% of the geography of the city (Figure 19). In many other
their income for housing (the threshold that defines “cost bur-
neighborhoods, population and housing values continue to decline.
dened”), seventh highest among the 25 largest U.S. cities (Figure
16). Among the city’s renters, 54% are housing cost-burdened, The traditional response to the affordability challenge has been the
ranking third out of 25 cities. Among homeowners, 30% are cost provision of publicly owned or publicly assisted affordable housing,
burdened, placing Philadelphia again seventh highest among the 25 funded from higher levels of government. Currently, Philadelphia
largest cities (Figure 17). has 33,055 units of subsidized housing and while that number
represents an increase of 769 units from 2018, it is hardly enough to
These rankings result less from the high cost of housing in Phila-
meet the demand (Figure 20).
delphia and more from the low incomes of too many residents. The
city’s median household income in 2018 was $43,744. Among the 25 In the absence of more federal funds to sustain existing and un-
largest cities, only Detroit has a lower median household income derwrite new subsidized housing, initiatives are underway in cities
(Figure 18). Among Philadelphia households, 23% have income of across the country to fund locally an increase in affordable supply.
$20,000 or less; only Detroit among the top 25 cities has a higher
percentage of households in this category.
FIGURE 16: PERCENT OF COST-BURDENED HOUSEHOLDS, HOMEOWNERS AND RENTERS, 2018
60
50
40
30
20
44.9%
34.0%
42.4%
36.0%
46.2%
35.0%
35.0%
34.8%
39.6%
10
38.6%
36.5%
35.9%
35.6%
36.2%
36.3%
33.9%
39.3%
52.7%
47.6%
37.6%
44.1%
37.7%
41.7%
34.1%
39.1%
0
Los Angeles
Austin
Denver
Charlotte
Chicago
Washington, D.C.
San Antonio
New York City
Detroit
Boston
San Diego
Philadelphia
San Jose
Dallas
Houston
Jacksonville
Indianapolis
Phoenix
Seattle
San Francisco
Columbus
Nashville
Fort Worth
Portland
El Paso
Source: U.S. Census Bureau, American Community Survey, 2018 five-year estimates
FIGURE 17: PHILADELPHIA HOUSING COST BURDENS BY INCOME CATEGORY, 2018
PERCENT OWNER PERCENT RENTER PERCENT
TOTAL COST COST COST
COST OCCUPIED COST OCCUPIED COST
HOUSEHOLDS BURDENED BURDENED BURDENED
BURDENED HOUSEHOLDS BURDENED HOUSEHOLDS BURDENED
TOTAL HOUSEHOLDS
594,778 248,181 42% 315,097 95,828 30% 279,681 152,353 54%
WITH INCOME
Less than $20,000 131,464 111,477 85% 49,235 39,500 80% 82,229 71,977 88%
$20,000 to $34,999 93,581 62,215 66% 44,949 21,525 48% 48,632 40,690 84%
$35,000 to $49,999 75,359 31,595 42% 39,913 13,471 34% 35,446 18,124 51%
$50,000 to $74,999 93,908 18,481 20% 54,891 10,606 19% 39,017 7,875 20%
$75,000 or more 170,815 6,432 4% 120,078 4,695 4% 50,737 1,737 3%
Zero or Negative Income 17,981 17,981 100% 6,031 6,031 100% 11,950 11,950 100%
No Cash Rent 11,670 0 0% n/a n/a n/a 11,670 0 0%
Source: U.S. Census Bureau, American Community Survey, 2018 five-year estimates
CENTERCITYPHILA.ORG Center City District & Central Philadelphia Development CorporationHousing Report 2020 | 15
FIGURE 18: MEDIAN HOUSEHOLD INCOME, 2018
San Francisco $104,552
San Jose $104,234
Seattle $85,562
Washington, D.C. $82,604
San Diego $75,456
Austin $67,462
Boston $65,883
Portland $65,740
Denver $63,793
Charlotte $60,886
New York City $60,762
Fort Worth $59,255
Los Angeles $58,385
Nashville $55,873
Chicago $55,198
Phoenix $54,765
Jacksonville $52,576
Columbus $51,612
Houston $51,140
San Antonio $50,980
Dallas $50,100
Indianapolis $46,442
El Paso $45,656
Philadelphia $43,744
Detroit $29,481
Source: U.S. Census Bureau, American Community Survey, 2018 five-year estimates
FIGURE 19: HOUSING COMPLETED OR UNDER FIGURE 20: HOUSING WITH ACTIVE
CONSTRUCTION CITYWIDE SUBSIDIES CITYWIDE
Far Northeast Far Northeast
PHILADELPHIA PHILADELPHIA
Near Near
Northeast Northeast
Olney/ North Olney/ North
Oak Lane Philadelphia Oak Lane Philadelphia
Roxborough/ Roxborough/
Manayunk Manayunk
Germantown/ Germantown/
Chestnut Hill Chestnut Hill
North North
Philadelphia Bridesburg/ Philadelphia Bridesburg/
Kensington/ Kensington/
Richmond Richmond
West West
Philadelphia Philadelphia
University University
City City
GREATER GREATER
CENTER CITY CENTER CITY
South
Philadelphia
South
Philadelphia
33,055 Units
Subsidized Affordable
Housing Units
Southwest Southwest
Philadelphia Philadelphia
Source: City of Philadelphia Department Source: National Housing Preservation Database
of Licenses and Inspections
Center City District & Central Philadelphia Development Corporation CENTERCITYPHILA.ORG16 | Housing Report 2020
FIGURE 21: MEDIAN HOUSEHOLD INCOME (CITY & SUBURBS) In some places, this takes the form of
mandatory requirements on market-rate
developers to either fund affordable housing
Bucks County or include affordable units in their projects.
Montgomery $86,055
County Philadelphia has opted for voluntary “inclu-
$88,166 sionary zoning,” giving developers an ability
to construct larger buildings in exchange for
payments to a Housing Trust Fund. The City
has also allocated increased resources from
Philadelphia the General Fund for affordable housing.
$43,744
These efforts are critical to the well-being
of residents across the city, but should be
viewed through the lens of Philadelphia’s
limited capacity to fund services from a
still diminished tax base. A mapping of
income by census tract (Figure 21) puts
in perspective how limited is the scale of
Burlington higher-income residential reinvestment in
County Greater Center City in the context of the city
$84,992 and region. Philadelphia simply needs more
growth if it wants to have more capacity to
Delaware fund more redistributive efforts locally.
County
$71,539 Philadelphia needs to fashion local ways to
increase resources devoted to affordability
Camden County without dampening, recently resurgent
$67,118 market activity. While Greater Center City’s
residential market has been vibrant, it has
remained a geographically limited revival
over the last three decades. Many of the
constraints visible on the horizon, are in our
power locally to address.
Tract
Gloucester Less than $20K $50K to $74,999 Not Available Prompting more robust, broad-based, fam
County $20K to $34,999 $75K to $99,999 ily-sustaining job growth must remain job
Source: U.S. Census Bureau,
$85,160 American Community Survey,
$35K to $49,999 $100K or More five-year estimates #1 when the economy recovers. Only growth
provides the foundation to support other so-
cial goals. More job opportunities with rising
incomes also remains the most effective
path to ensure that all city residents can
enjoy decent, safe and quality housing.
The areas of the city containing
significant clusters of households
with incomes over $75,000 are
geographically quite limited.
Regional wealth is still concentrated
overwhelmingly in the suburbs.
CENTERCITYPHILA.ORG Center City District & Central Philadelphia Development CorporationYou can also read