Green Environmental Sustainability Progress Report
←
→
Page content transcription
If your browser does not render page correctly, please read the page content below
Green Environmental
Sustainability Progress
Report
July to December 2016
A detailed bi-annual overview of the City of
Sydney’s progress against our environmental
sustainability targets for both the Local
Government Area (LGA) and the City’s own
operations.
1.   Highlights                                3
2.   Draft Environmental Strategy 2016-2021    5
3.   Our future targets                        6
4.   Sustainability at the City of Sydney      8
5.   Low-carbon city                           9
6.   Water sensitive city                     19
7.   Climate resilient city                   28
8.   Zero waste city                          31
9.   Active and connected city                36
10. Green and cool city                       41
11. Delivering to the community               47
12. Glossary                                  53
13. Appendix 1: Data management plan          56
14. Appendix 2: Environmental Policy          58
Green Environmental Sustainability Progress Report                July to December 2016

                                                            Message from the CEO
The City of Sydney is committed
                                                            In December 2016, I attended the sixth biennial C40
to securing Sydney’s future, its                            Mayors Summit in Mexico City. At the Summit we
prosperity and liveability. The                             considered new research that highlighted the urgent
                                                            need for action on climate change and the sheer scale of
City defines Sustainability in                              the challenge we all face, especially city leaders.
                                                            What is clear is that the next four years are crucial and
keeping with the Brundtland                                 will determine whether the world meets the ambition of
Report1 of 1987 as meeting the                              the Paris Agreement to limit global temperature rise to
                                                            less than 2oC, and to drive efforts to limit the temperature
environmental, social and                                   increase even further to 1.5oC. Incremental steps are no
                                                            longer adequate – we need to dramatically increase
economic needs of the present                               action. It is incumbent on wealthy cities like ours, which
                                                            have the resources and capabilities to accelerate action,
without compromising the ability                            to do twice as much in half the time.
of future generations to meet                               The City of Sydney is committed to working with our
                                                            communities, suppliers, partners and stakeholders to
their own needs.                                            secure Sydney’s future, prosperity, equity and liveability.
                                                            We recognise the importance of an enduring, balanced
The City recognises the importance of an enduring,          approach which takes into account the city’s economy,
balanced approach which takes into account the City’s       ecology, society and culture.
economy, ecology, society and culture. We are               We are working with bold ideas and good governance to
addressing each with bold ideas and good governance.        ensure better outcomes now and in the future, for
The results mean better outcomes now and in the future,     everyone.
for everyone. Sustainable Sydney 20302 is a plan for a
Green, Global and Connected city.                           The Lord Mayor and Council have made a commitment
                                                            to ensuring the City of Sydney is an inspiring
GREEN with a minimal environmental impact, green with       environmental leader. This commitment and specific
trees, parks, gardens and linked open spaces with           environmental targets have been articulated in
healthy ecosystems and where the air, land and              Sustainable Sydney 2030 and the draft Environmental
waterways are clean. Green, with highly efficient           Action 2016 – 2021 Strategy and Action Plan commits to
buildings and transport systems, Green by example and       strong actions on energy, water, climate adaptation,
Green by reputation. Addressing climate change is the       waste, transport and greening over the next five years.
biggest challenge we have locally and globally.             The Green Report outlines programs that the City is
Improving energy efficiency and identifying alternative     implementing and how we are tracking towards the
sources of energy, including renewable energy, continue     environmental targets.
to be a priority.
GLOBAL in economic orientation. Global in links,
partnerships and knowledge exchange. Global and open-
minded in outlook and attitude.
CONNECTED physically by walking, cycling and high
quality public transport. Connected “virtually” by world-   Monica Barone
class telecommunications, connected communities
through a sense of belonging, contribution, social          Chief Executive Officer.
wellbeing and quality, and connected to other spheres of
government and to those with an interest in the city.

1   http://www.un-documents.net/wced-ocf.htm                2   http://www.cityofsydney.nsw.gov.au/vision/sustainable-sydney-2030

2
Green Environmental Sustainability Progress Report   July to December 2016

1. Highlights

3
Green Environmental Sustainability Progress Report   July to December 2016

4
Green Environmental Sustainability Progress Report July to December 2016
2. Draft Environmental
Strategy 2016-2021
Sustainable Sydney 2030
outlined the aspiration of our
community and businesses for
our local government area to be
an environmental leader on a
global scale.
In June 2016, the Council of the City of Sydney endorsed Zero waste city
the draft Environmental Action 2016 – 2021 Strategy and We see the city’s waste as a valuable resource
Action Plan (the strategy) for public exhibition. This and will work with the city’s residents and
strategy combines the insights and data from these businesses to divert waste away from landfill and
documents. It outlines our progress to date, and encourage more re-use, recycling and energy
approach to achieving our bold Sustainable Sydney 2030 recovery.
targets across six themes:
Active and connected city
Low-carbon city
The City aims to promote the most sustainable
We have set ambitious targets for emissions modes of transport for residents, workers and
reduction for both our own operations and for the visitors to reduce emissions and improve air
LGA. To achieve deep reductions we will identify quality and local amenity. We are improving
energy efficiency opportunities, optimise use of walking and cycling infrastructure and working
renewable energy and energy storage, and with the state government to enhance public
generate low-carbon energy locally. transport.
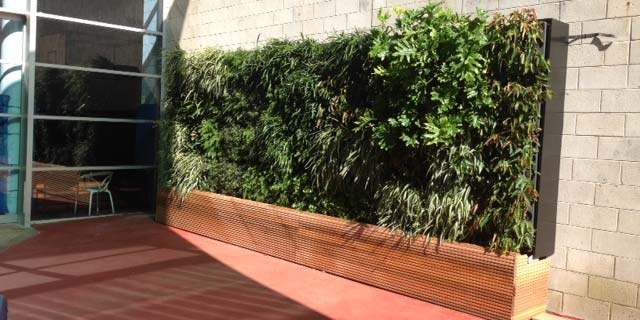
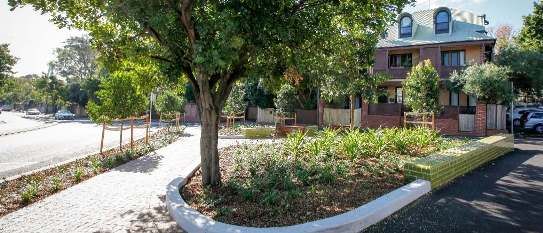
Water sensitive city Green and cool city
To build resilience to the predicted impacts of We are increasing the canopy cover across the
climate change, we need to keep our city cool and city and preserving and increasing native plant
green. We aim to minimise use of potable water and animal habitats. Greening the city reduces
through efficiency and by capturing alternative the urban heat island effect, improves local air
water sources to recycle for non-potable purposes. quality and enhances the liveability of the urban
Stormwater management will improve the health of environment.
our waterways.
The strategy and action plan details how we will deliver
Climate resilient city against targets set for our own operations and how we
Our city will experience more heatwaves, extreme will influence and collaborate with others to contribute
storms and flash flooding events as a result of towards the achievement of targets for the local
climate change. We need to respond to these government area from 2016 to 2021.
changes by collaborating with other agencies to During this five year period, the action plan will be
respond effectively in emergencies and protect reviewed and adjusted annually as technology
vulnerable members of the community. Long term progresses, regulatory reforms occur, we continue to
planning for infrastructure needs to take into learn and stakeholder feedback is continuously
account future climate predictions. incorporated.
5
Green Environmental Sustainability Progress Report            July to December 2016

3. Our future targets
The following are proposed targets from the Draft Environmental Strategy 2016-2021, yet to be endorsed by Council.

City of Sydney Operations

       Low-carbon city                                             Active and connected city

      –   44 per cent reduction in greenhouse gas                  –   Zero increase in fleet emissions from
          emissions by end June 2021 based on                          2014 baseline by end June 2021
          2006 levels
                                                                   Green and cool city
      –   70 per cent reduction in emissions by 2030
          based on 2006 levels                                     –   The average total canopy cover is
                                                                       increased by 50 per cent by 2030 (from
      –   50 per cent of electricity from renewable                    15 to 23 per cent), and increased by 75
          sources by end June 2021                                     per cent by 2050 (to 27 per cent), from a
                                                                       2008 baseline

                                                                   –   Plant 700 new street trees each year until
       Water sensitive city                                            2021

      –   Annual potable water use of 180 L/m2 of                  –   Plant 50,000 new trees and shrubs in City
          irrigated open space by end June 2021                        parks and street gardens each year until
                                                                       2021
      –   Zero increase in potable water use by end                –   Tree species diversity will not consist of
          June 2021 from 2006 baseline, achieved                       more than 40 per cent for any particular
          through water efficiency and recycled water                  plant family, 30 per cent for any genus or
                                                                       10 per cent for any one species by 2021
      –   Zero increase in potable water use by 2030
          from 2006 baseline, achieved through                     –   Habitat sites in the city are protected and
          water efficiency and recycled water                          the area of bush restoration sites is
                                                                       increased by 100 per cent by 2023 from a
       Zero waste city                                                 2012 baseline of 4.2 hectares
      –   70 per cent resource recovery of waste                   –   Indigenous fauna species diversity,
          from City-managed properties by end June                     abundance and distribution is maintained
          2021                                                         or increased by 2023 based on a 2012
                                                                       baseline
      –   80 per cent resource recovery of
          construction and demolition waste                        –   A progressive increase in the number of
          generated and managed by City operations                     habitat features for priority fauna species
          by end June 2021                                             is established along potential habitat
                                                                       linkages by 2023
      –   50 per cent resource recovery of waste
          from City parks, streets and public places
          by end June 2021

6
Green Environmental Sustainability Progress Report         July to December 2016

Local Government Area                                           Zero waste city
Since the targets for Sustainable Sydney 2030 were set,         –   70 per cent recycling and recovery of
the City of Sydney local government area (LGA) has                  residential waste from the local government
undergone significant growth and is expected to continue            area by end June 2021
to grow.
                                                                –   70 per cent recycling and recovery of
                                                                    commercial and industrial waste from the
Regardless of future growth, the 2030 targets set by the
                                                                    local government area by end June 2021
City of Sydney are absolute.
                                                                –   80 per cent recycling and recovery of
                                                                    construction and demolition waste from the
      Low-carbon city                                               city by end June 2021

      –   70 per cent reduction in greenhouse gas               Active and connected city
          emissions by 2030 based on 2006 levels
                                                                –   33 per cent of trips to work during the AM
                                                                    peak undertaken by walking by 2030, by
      –   Net zero emissions by 2050
                                                                    city residents

      –   50 per cent of electricity demand met by              –   10 per cent of total trips made in the city
          renewable sources by 2030                                 are undertaken by bicycle by 2030

      Water sensitive city
                                                                –   80 per cent of trips to work during the AM
      –   Zero increase in potable water use by 2030                peak are undertaken by public transport by
          from 2006 baseline, achieved through water                2030, by city residents and those travelling
          efficiency and recycled water                             to Central Sydney from elsewhere

      –   50 per cent reduction in the annual solid
          pollution load discharged to waterways via            –   30 per cent of city residents who drive (with
          stormwater by 2030                                        an unrestricted drivers licence) are
      –   15 per cent reduction in annual nutrient load             members of a car sharing scheme by 2030
          discharged to waterways via stormwater by
          2030                                                  Green and cool city

                                                                –   The average total canopy cover is
                                                                    increased by 50 per cent by 2030 (from 15
                                                                    to 23 per cent), and increased by 75 per
                                                                    cent by 2050 (to 27 per cent), from a 2008
                                                                    baseline

7
Green Environmental Sustainability Progress Report July to December 2016
4. Sustainability at
the City of Sydney
The City’s Procurement teams have developed a suite of
reports to track usage on Cabcharge and Petty Cash.
The City’s commitment to Introduction of these reports have reduced Taxi travel by
environmental leadership to 2030 over 50%, while introducing staff to healthier and more
sustainably friendly modes of transport such as walking or
is demonstrated by our riding one of the City’s bike fleet.
ambitious targets for emissions,
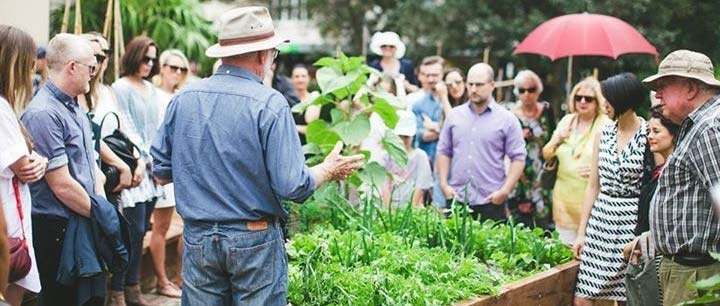
Sustainable events management
energy, water, waste and green The City runs many events each year to celebrate the
space. diverse cultural, sporting and recreational aspects of
Sydney. These include both small events and larger
events such as Sydney New Year’s Eve and Chinese
Environmental Commitment New Year.
The City’s Environment Policy3 applies to all City of We recognise the importance of a balanced approach to
Sydney’s operations, assets, activities and staff. event management which takes into account the city's
An Environmental Management System (EMS) supports economy, ecology, society and culture. Our goal is to
the City’s commitment to ensuring sustainable asset reduce the impact of events we manage and approve on
management and operations. the environment. The City’s Sustainable Event
The Green report is the City of Sydney’s state of the Management Policy and Guidelines encourage, and in
environment report and fulfils the reporting requirements some cases require, that events run by the City:
of the NSW Local Government Act 1993 No. 30 Section – minimise waste generation
428A and the Integrated Planning and Reporting – maximise recycling
guidelines. – minimise energy consumption
– maximise use of renewable energy
Sustainable Procurement – minimise water consumption
– conserve bio-diversity
The City of Sydney is committed to doing business with
ethical and socially responsible suppliers. The City sees – minimise impacts on climate change and
our suppliers as partners in our sustainability program. We – promote principles of sustainability
take great care in selecting the companies who supply us
with products and services, and expect each of them to Sydney New Year’s Eve
operate in line with international, national and local
The City undertook a greenhouse gas assessment of
standards and appropriate codes of practice.
Sydney New Year’s Eve for the period 2008 to 2015. In
The City became a founding member of Supply Nation in
the most recent assessment, the estimated total carbon
2010, the first and pre-eminent supplier diversity
organisation in Australia which connects Australia’s emissions were 552 tCO2-e. This represented a net
leading brands and government with Indigenous reduction of 14.6 per cent in a like for like comparison
businesses across the country. The City’s Procurement when compared with the base year emissions of 2012.
and Social Economic teams developed and presented a The City will continue to implement sustainability actions
social procurement workshop for Aboriginal & Torres to reduce carbon emissions related to the event. These
Strait Islander businesses, aimed at providing these include the use of LED lighting, reuse of materials,
businesses with an understanding on how to search, and maximising recycling, and assessment of supplier
bid, for business opportunities offered by the City. This environmental sustainability policies and practices.
very successful workshop will be replicated at the
upcoming Supply Nation “Connect 2017” conference.
3 City of Sydney Environmental Policy can be seen in Appendix 2.
8
Green Environmental Sustainability Progress Report                July to December 2016

5. Low-carbon
 city

Cities contribute around 70 per
cent of the world’s carbon
emissions and can play a
significant role in creating a net
zero future.
In Sustainable Sydney 2030, we set a 2030 target to
reduce emissions both across the city and in our
operations by 70 per cent below 2006 levels. In our draft
Environmental Action 2016-2021 Strategy and Action
Plan, we have strengthened our renewable energy
targets for both our own operations and in our local
government area.
Our ambitious plans across the city and our own operations
will help us to use less energy and improve energy
efficiency, comfort and productivity.

ADVOCACY
Energy market reform
Under the current National Electricity Rules, full network
charges are still payable if a building with solar photovoltaic
panels or trigeneration sends surplus power to the building
next door. This fails to reward the savings a building has
made by not using the long-distance electricity network of
poles and wires.
The City and others proposed regulatory changes to the
National Electricity Rules to improve financial returns for
local generators. Unfortunately the Australian Energy Market
Commission rejected this proposal. This is highly
disappointing as the rule change would have had a positive
effect on the uptake of building and district-scale renewable
energy generation across Australia.

9
Green Environmental Sustainability Progress Report               July to December 2016

     City of Sydney Operations

Carbon Neutral Program
                                                            Renewable Energy
The City has been measuring, reducing and offsetting all
of its operational greenhouse gas emissions since           The City has committed $2 million each year to install
2006/07. In 2011, the City of Sydney became the first of    renewable energy onto our properties, to generate clean
any level of Government in Australia to be certified as     energy locally where and when it is required.
Carbon Neutral under the Australian Government              Offset
National Carbon Offset Standard (NCOS).                     The City reduces its carbon liability by avoiding and
The City remains carbon neutral by continuing to            reducing emissions and using offsets for emissions that
implement emissions saving projects, developing a           can’t be avoided.
greenhouse gas emissions inventory with independent         The last independent audit took place in November 2016
verification, and through the provision of accredited       for submission to NCOS for the FY2015/16 period. The
offsets equivalent to 100 per cent of the organisation’s    emissions total for the City’s operations was 39,566
emissions.                                                  tCO2-e. Chart 1 tracks our actual annual operational
                                                            emissions by category.
How we do it
Measure
Any carbon neutral claims must be accurate and verified      Relevant links
independently.                                                    –   Carbon Neutral Program
Avoid and reduce                                                  –   NCOS Public Disclosure Summaries
The City has been achieving real energy and                       –   Auditors Assurance Statements
greenhouse gas emissions savings in our buildings,
                                                                  –   Offsets certificates
street lighting, and fleet operations.

   Chart 1. City of Sydney operations greenhouse gas emissions

10
Green Environmental Sustainability Progress Report July to December 2016
Our operational targets
Greenhouse – 44 per cent reduction in greenhouse gas emissions by end June 2021, based on 2006 levels
gas – 70 per cent reduction in greenhouse gas emissions by 2030 based on 2006 levels
emissions
Renewable – 50 per cent of electricity demand met by renewable sources by end June 2021
energy
How we are tracking under construction such as the Green Square
Annual greenhouse Aquatic Centre.
gas emissions City of Sydney’s greenhouse gas
Chart 14 tracks annual
ANNUAL emissions from operations Energy consumption data
greenhouse gas The table below shows energy consumption data for the
emissions by category
to the Sustainable Below 2005/06 levels
25% organisation. The City organisational data is up to June
2016. The most recent data that has been independently
Sydney 2030 target of a As at 2015/16 verified.
70 per cent emission Electricity Natural gas Total energy
Organisation
reduction against the (MWh) (GJ) (GJ)
2005/06 baseline and Baseline 42,427 21,894 174,631
tracks identified projects the City is progressing over the
Most recent
short term for its own operations. As at June 2016, the 31,084 33,967 145,871
(Jun 2016)
City’s reported emissions have fallen 25 per cent below
the 2005/06 baseline. Chart 2 incorporates projects Difference6 -11,343 +12,073 -28,760
currently in progress and their proposed effects. It is Difference (per
-27 per cent +55 per cent -16 per cent
anticipated that, as projects currently in progress begin to cent)
deliver scoped benefits, overall emissions will reduce
accordingly.
Emissions from grid electricity are calculated based on The table below describes the sources for the annual
the emissions factor for NSW, currently 0.84 tCO2- operations greenhouse gas emissions data7.
e/MWh for scope 2 and 0.12 tCO2-e/MWh for scope 3
emissions. Greenhouse gas emissions are calculated Title Source
using National Greenhouse Factors5.
Buildings, parks STEvE (the System for Tracking
and street lighting EVerything Environmental).
Changes from last reporting period Fleet Fleet Services (converted from Shell and
Park Fuels fuel consumption data).
Results can be attributed to a number of influences:
– Seasonality of property data. Other GHG Sourced from most recent Carbon
Inventory. All data annual and averaged
– Seasonality of street lighting data. across quarters for reporting purposes.
– Emissions reported to the end of December 2016
are estimated at 26% below 2005/06 levels.
For more information see Appendix 1: Data Management
– Renewable electricity generated from solar PV is
Plan.
3% to December 2016. The renewable target is
expected to be achieved over the next few years
by installing more solar power on assets currently
4 This chart has been updated since the previous report to include 2015/16 annual emissions. 5 https://www.environment.gov.au/climate-change/greenhouse-gas-
Installing trigeneration to Town Hall House is likely to be the next biggest emissions saving. measurement/publications/national-greenhouse-accounts-factors-aug-2016.
The upgrade of street lighting owned by Ausgrid would also significantly reduce the City’s 6 Calculation: Difference = (Most recent - Baseline)
emissions. Difference (per cent) = (Difference / Baseline) x 100
7 Based on most recent estimated data.
11Green Environmental Sustainability Progress Report July to December 2016
How we will get there
Chart 28 indicates reductions of the Council’s operational emissions against the 2005/06 baseline. It also shows the
initiatives the City has undertaken to date to achieve an estimated 26 per cent emissions reduction by Dec 2016
(pending verification), and the estimated contributions of the initiatives we will implement across our operational
portfolio to reduce our emissions by at least 44 per cent by 2021 and by 70 per cent by 2030. We will maintain our
certified carbon neutral status each year through the purchase of verified offsets for those emissions we cannot
eliminate, as we have since 2007.
The City’s greenhouse gas emissions vary due to a range of factors such as the buying and selling of buildings and
assets, how we manage our assets, climatic influences, changes to services, and other factors. To assess this variation,
the “Portfolio Change” and “Management Improvement" components have been included in this graph. It should be noted
that irrespective of portfolio changes, the City’s emissions targets are absolute. The waterfall chart shows the contribution
of completed and planned programs towards meeting our target.
Chart 2. City of Sydney operations greenhouse gas emissions targets to 2021. Estimated contribution of initiatives.
2006 Baseline
– 2006 emissions: Independently verified greenhouse gas emissions
inventory including emissions from energy, waste and transport
– Building upgrades (-6 per cent) reflects estimated savings from
Complete efficiency upgrades in the most resource intensive properties
– Portfolio change (+3 per cent) includes removal of some assets e.g. – Ausgrid LED lighting (-10 per cent) - The City pays for the electricity
Lawson Square and Domain Parking Station; and addition of others used by all street lighting in the local government area, however
including: Ian Thorpe Aquatic Centre, 343 George Street, Mountain some of these lights are owned by Ausgrid. We will advocate for
Street, Surry Hills Community Centre Ausgrid to upgrade all its street lighting to more efficient LED
– Management improvements (-11 per cent) shows emissions bulbs. This element is shown as striped to indicate it is not within the
reductions achieved outside of the major efficiency initiatives. This City’s control
includes improved energy measurement and monitoring, behaviour – The contribution of grid renewables (-0.2 per cent) is calculated on
changes, small works, and the influence of annual weather changes the assumption that the current government’s Renewable
By 2021 Energy Target of 33,000 gigawatt hours by 2020 will be achieved
– Future portfolio (+8 per cent) increase assumes the construction of – Solar PV (-6 per cent) on our own properties can deliver 15 per cent
new childcare centres, Green Square sites, pedestrian lighting and other of electricity demand if battery storage provides a cost effective
projects solution and the City can take advantage of virtual net metering
between our sites
– Co/Trigeneration (-5 per cent) - reductions will be accomplished
through the operation of co/trigeneration facilities at TownHall House – Off-site renewables (-11 per cent) can be purchased by the City
Cook and Phillip Park Aquatic Centre and Ian Thorpe Aquatic through the GreenPower scheme or directly from a renewable
Centre project
8 The waterfall chart is updated as new information becomes available.
12Green Environmental Sustainability Progress Report July to December 2016
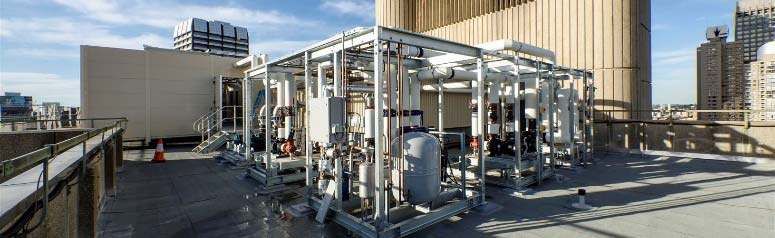
PROJECT UPDATE PROJECT UPDATE
Trigeneration Solar Photovoltaic (PV) Installation
In July 2012 Council awarded a tender to install solar
The trigeneration system at Town Hall House has been photovoltaic panels to multiple sites that it owns including
installed and supplies low carbon electricity as well as heating properties, sports fields, town halls, libraries, Council
and/or cooling to both Town Hall House and Sydney Town Hall. depots, and community centres.
The project has passed the halfway mark, with around
It is expected that the system will cut carbon emissions by more 3,190 panels installed across 31 sites so far, including the
than 40,000 tonnes over its 30-year lifetime, producing less heritage listed Sydney Town Hall.
than half the emissions that of the coal-fired plants that supply
When complete, this multi-million dollar installation is
the majority of Sydney’s electricity.
expected to produce almost two GWh (gigawatt hours) of
clean renewable energy, saving almost 1,700 tCO2-e
PROJECT UPDATE annually. The output of the panels will be reviewed
Cogeneration regularly.
Cogeneration at Ian Thorpe Aquatic Centre: The
Panels Peak Emission Energy
design phase of a D&C contract commenced in
installed capacity savings9 production
November 2016 with installation to be completed by Period
(kW) (tCO2-e) (MWh
November 2017.
p.a.)10
Cogeneration at Cook + Phillip Park Aquatic Centre:
The design for a cogeneration unit will occur in tandem Project to date 3,190 788 1,021 1,064
with redesign of the other energy services at the centre.
Total contract
This energy services’ design phase commenced in 5,148 1,186 1,667 1,684
(target)
January 2017, with cogeneration to be installed by
December 2018.
The installation of the panels is funded using budget previously
allocated to purchasing Green Power. The City also remains
ADVOCACY carbon neutral through the purchase of carbon offsets. Further
LED streetlights installations are underway, however the City is running out of
The City has upgraded the lamps in all the sites that are both suitable for solar and with sufficient demand
streetlights it owns to energy-efficient LEDs. The for the energy produced. This is required to minimise exports to
remainder of the streetlights in our LGA are owned the grid at rates that are uneconomic.
by Ausgrid - however the City pays the electricity The City is working with the industry, government, the property
bills and takes responsibility for the carbon sector and clean energy proponents to propose changes to the
generated. National Electricity Rules to recognise the value of local
generation, which could go part way to overcoming the ‘export
We are advocating for Ausgrid to upgrade all its to the grid’ barrier. This extends across Australia and is not just
streetlights in the local government area to limited to the City of Sydney. Other options are sharing energy
efficient LED lamps to save energy. with tenants, private energy networks, and storage solutions.
9 Projected emissions savings for panels installed in the reporting period 10 Cumulative energy production for the project to date.
13Green Environmental Sustainability Progress Report July to December 2016
Solar PV installations cont.
No. Location Status
No. Location Status
1 343 George Street Installed
28 Pine Street Creative Arts Centre Installed
2 Abraham Mott Gymnasium Installed
29 Pirrama Park Installed
3 Alexandria Canal Depot Installation Pending
30 Redfern Community Centre Installed
4 Alexandria Child Care Centre Installed
31 Redfern Oval Grandstand Installed
5 Alexandria Park Changing Rooms Installed
32 Redfern Town Hall Installed
6 Alexandria Town Hall Installed Surry Hills Library and Community
7 Andrew Boy Charlton Pool Installed 33 Installed
Centre
8 Bay Street Depot Installation Pending Sydney Park CARES Facility
34 Installed
9 Bourke Street Depot Installed (Sydney Park Cycling Centre)
East Sydney Early Learning 35 Sydney Park Nursery Installed
10 Installed
Centre 36 Sydney Park Pavilion Installed
11 Epsom Road Depot Installed 37 Sydney Town Hall Installed
12 Erskineville Oval Installed 38 The Crescent Child Care Installed
Erskineville State Emergency 39 Tote Building Installed
13 Installed
Services 40 Ultimo Community Centre Installed
14 Erskineville Town Hall Installed
41 Victoria Park Pool Installed
15 Flinders Street Bicycle Hub Installation Pending
42 Waterloo Library Installed
16 Glebe Town Hall Installed
Green Living Centre (Harry
17 Installation Pending
Burland)
Green Square Community and Solar hot water installations
18 Installation Pending
Creative Centre No. Location Status
Green Square Infrastructure
19 Installation Pending 1 Abraham Mott Hall Installed
Centre
Heffron Hall (East Sydney 2 Alexandria Child Care Centre Installed
20 Installation Pending
Community Centre) 3 Bourke Street Depot Installed
21 Green Square Child Care Centre Installation Pending 4 Jane Evans Day Centre Installed
Huntley Street Early Learning
22 Installed 5 Juanita Nelson Community Centre Installed
Centre
23 Juanita Nielsen Community Centre Installation Pending 6 King George V Recreation Centre Installed
24 King George V Recreation Centre Installed Kings Cross Neighbourhood Service
7 Installed
Centre and Library
25 Mountain St (Wilcox Mofflin) Installation Pending
8 Pyrmont Community Centre Installed
26 Paddington Town Hall Installed
27 Perry Park Basketball Centre Installation Pending 9 Redfern Community Centre Installed
10 Rosebery Child Care Centre Installed
11 State Emergency Service Facility Installed
12 Ultimo Community Centre Installed
13 East Sydney Early Learning Centre Installed
14Green Environmental Sustainability Progress Report July to December 2016
PROJECT UPDATE PROJECT UPDATE
Building upgrades Environmental Sustainability Platform
In partnership with the NSW Office of Environment and (ESP)
Heritage (OEH) Energy Efficient Government program the City Description: Develop the ESP to gather and utilise
has commenced a program of building energy audits at the environmental data, providing strategic information to help
reach to Sustainable Sydney 2030 targets and the means to
sites within its portfolio that are the most energy intensive. report in accordance with international initiatives.
OEH has supported energy audits at seven sites in 2016 with a
further eight sites being audited by the City, with a focus on The project includes an Open Data Portal where data is made
both energy and water, in 2017. Based on the finding of these available to everyone for the wider benefit of the community
audits, capital and operational improvement projects will be and to encourage an accessible and connected city.
prioritised and implemented to assist progress towards Outcomes: The Open Data Portal was launched in November
emission and water reduction targets. 2016 and the City has commenced loading datasets to the
portal. The portal can be accessed at
PROJECT UPDATE http://data.cityofsydney.nsw.gov.au/.
Utilities consumption management
The City has recently procured a new environmental PROJECT UPDATE
sustainability Software as a Service platform referred to as Fleet
Sustainability Management and Reporting Tool (SMART), to
Description: Fleet emissions contribute approximately seven
manage, monitor and report on utilities and other sustainability
per cent of the City’s total emissions. Having taken advantage
metrics for all assets owned and/or managed by City of
of all currently available tools and technologies, Fleet
Sydney. SMART will provide City asset managers and staff with
Management are now focussing on low-risk and eco-driving
improved visibility of electricity, gas, and water usage, and
strategies. Low-risk driving practices almost always contribute
waste generation. It will also facilitate the delivery of actions
to lower fuel or battery use and fewer emissions.
and targets outlined in the City’s draft Environmental Action
2016-2021 Strategy and Action Plan. The platform is scheduled The City has rolled out its new ‘Low-risk and Eco-driving
to be fully operational by end 2017. Handbook’ and is providing ongoing training to staff with the
aim of further reducing emissions. Low risk driving and eco
driving complement each other, and contributions to one
PROJECT UPDATE usually benefit the other.
Environmental Management System Outcomes: Maintain fleet emissions at 2014 levels until 2017.
(EMS) Status: On-going. 2015/16 fleet emissions were 2,160 tCO2-e
Description: Implement environmental management processes which beat the target by 190 tCO2-e. Completion by end 2017.
to ensure all City staff are aware of their responsibilities in For more information on fleet see Section 9 – Active and
regards to environmental management. connected city.
Priorities for 2016/17 include strengthening environmental
controls, development of Sustainable Design Technical
Guidelines for capital works projects, environmental data
management review and implementation of the Environmental
Sustainability Platform.
Outcomes: Continuous improvement of environmental
management in progress.
15Green Environmental Sustainability Progress Report July to December 2016
The local government area
Local government area targets
Greenhouse gas – 70 per cent reduction in greenhouse gas emissions by 2030 based on 2006 levels
emissions
– Net zero emissions by 2050
Renewable – 50 per cent of electricity demand met by renewable sources by 203011
energy
How the local government area is tracking Energy consumption data
Annual greenhouse gas emissions The table below shows energy consumption data for the
Chart 3 tracks actual LGA. Please note, LGA data is shown to June 2015,
emissions from the which is the most up to date data available13.
Local government area ANNUAL
local government greenhouse gas emissions
area. By mid-2015 Electricity Natural gas Total energy
LGA
(latest available
data), emissions had 17% Baseline
(MWh)
4,159,436
(GJ)
3,038,529
(GJ)
18,012,502
reduced by 17 per Decrease
cent. Below 2006 levels Most recent 3,618,538 3,510,162 16,536,901
(to June
The City recently
2015)
updated the way we
report emissions in order to become compliant with the Difference -540,898 +471,633 -1,475,600
highest standard offered by the Global Protocol for Difference
-13per cent +16per cent -9per cent
Community-Scale Greenhouse Gas Emission Inventories (per cent)
(GPC)12 – the new international benchmark for reporting
city emissions.
For more information see Appendix 1: Data Management
Plan.
Chart 3: Local government area greenhouse gas emissions
11 The renewable electricity target incorporates renewable electricity both within the grid and classified as additional to the grid.
12 http://www.ghgprotocol.org/city-accounting
13 Calculation: Difference = (Baseline – Most recent)
Difference (per cent) = (Difference / Baseline) x 100
16Green Environmental Sustainability Progress Report July to December 2016
How we will get there
Chart 4 shows the estimated contributions of the initiatives we expect could lead to reduction of the city’s emissions by
70 per cent by 2030.
Since 2007 total greenhouse gas emissions across the local government area have continued to fall and this is despite
significant growth in the economy (32 per cent), the number of new residents (25 per cent) and businesses, new
developments and other economic indicators.
Most greenhouse gas emissions in the City of Sydney local government area are due to buildings. Emissions are
falling due to improved energy efficiency awareness and practices, and the increase of renewable energy in the grid
and locally. However, as buildings become more efficient, and as more people live and work in the area, emissions
from transport are growing as a proportion of the total.
Chart 4: Local government area greenhouse gas emissions target. Estimated contribution of initiatives.
– Energy efficiency (-34 per cent) calculated – Transport (-4 per cent) emissions reductions
on the basis of existing and new state and would be realised by use of vehicles with
federal government policies and programs lower emissions intensity, and by changing
– Renewable energy (-22 per cent) reflects 50 per the mode split to move away from car travel
cent of electricity being provided by renewable and towards public transport and walking
sources and cycling
– Co/trigeneration (-3 per cent) is based on historic – Offsets and future opportunities (-6 per cent)
average installation rates includes savings that could be made from
– Waste diversion/advanced waste treatment transport, waste, renewable energy, energy
(-7 per cent) reflects savings from avoided efficiency, regulatory and/or technological
landfill emissions improvements, or other opportunities.
Offsets could be purchased by those entities
generating emissions
17Green Environmental Sustainability Progress Report July to December 2016
ADVOCACY
High environmental standards for urban
renewal precincts
Two upcoming urban renewal precincts in our local area –
Central to Eveleigh/Waterloo, and the Bays Precinct –
present the opportunity to deliver world-leading
environmental sustainability outcomes. The NSW state
government will be redeveloping these sites, and the City
will advocate for high environmental standards for these
areas as they will be bringing tens of thousands of new
residents into our LGA – and we want their environmental
footprint to be as small as possible.
PROJECT UPDATE
Green Square Town Centre
ADVOCACY
The Green Square Town Centre (the town centre) is a 14
hectare precinct that will be a major retail, cultural and Increase BASIX targets
commercial centre only 3.5km from Sydney’s CBD. The town BASIX and the National Construction Code are the
centre will transform South Sydney’s oldest industrial area into mandatory planning instruments that set the minimum
a new and vibrant neighbourhood, including over 7,000 new standard for energy and water efficiency of new buildings.
residents. It is imperative that urban renewal projects can The BASIX standard was set 12 years ago and has not
demonstrate leadership in sustainability. This ideal has guided been updated, so it falls short of current best-practice.
the City’s approach to the town centre development to date and Standards must be raised now to ensure we don’t build
will continue to as we work to achieve a Green Star more new poor-performing buildings that will lock-in
Communities rating for the town centre. carbon emissions for decades to come. The NSW
Green Star Communities strategies and initiatives are closely government needs to increase BASIX targets for
aligned to the Sustainable Sydney 2030 strategy (SS2030). minimum environmental performance in residential
The Green Star rating tool assesses the sustainability buildings.
performance of community and precinct-wide projects across
five impact categories including Governance, Livability,
Economic Prosperity, Environment, and Innovation. Each of
these categories has credits which align to the SS2030 10 Relevant links
strategic directions guiding the future plans of the City. – Sustainable Sydney 2030
The City is working with private developers in the town centre – Energy Efficiency Master Plan – improving energy
to achieve the Green Star Communities rating. This process will productivity: 2015-2030
recognise existing commitments to deliver leading initiatives, – Decentralised Energy Master Plan - Renewable
such as Australia’s largest residential stormwater harvesting Energy: 2012-2030
and treatment scheme, and further refine actions to lead to
better sustainability outcomes for Green Square and the city as
– Carbon Neutral Program
a whole.
The City prides itself on being sustainable and by achieving a
Green Star Communities rating for the Green Square Town
Centre, the City can gain formal recognition for its
achievements and serve as a model for other urban renewal
communities to follow.
POWERED BY LOW CARBON RENEWABLE ENERGY
A private electricity distribution system will enable solar
power and electricity from a cogeneration unit to be shared
between several community buildings at Green Square.
This private distribution system will reduce the
community’s reliance on grid power and lower the carbon
footprint of these community buildings.
18Green Environmental Sustainability Progress Report July to December 2016
Water is crucial to the social,
6. Water economic and environmental
wellbeing and survival of our city.
sensitive Our city’s forecast population
city growth to 2030 will increase the
use of our green public spaces,
placing pressure on these
spaces to remain green and our
waterways to stay clean.
Our operational targets
Water – Zero increase in potable water use by end June 2021 from 2006 baseline, achieved
consumption through water efficiency and recycled water
– Annual potable water use of 180L/m2 of irrigated open space by the end of 2021
The City is transforming to be a water sensitive city that City of Sydney Operations
is resilient, cool, green and productive. Our water
management approach to meet these targets involves:
– Using less water through changes in behaviour How we are
and using water efficient fixtures and fittings tracking City of Sydney’s ANNUAL water
Annual water consumption from operations
– Capturing alternative water sources to recycle
and use for non-potable purposes consumption
– Reducing stormwater pollution, minimising local Chart 514 shows annual
water consumption by
5%
flood risk, enhancing greening and urban cooling Increase
through retrofitting the stormwater management category. This chart Above 2006 levels
network with raingardens, wetlands, swales and has been updated to as at FY2015/16
gross pollutant traps reflect recent
improvements in our data management processes.
These improvements have identified additional water
Our approach will drought-proof our city to ensure we meters that have previously not been included in our
can use water when it is hot and dry. Our waterway reports. The inclusion of these meters has resulted in an
health will be improved and non-potable water supplies increase in all years’ consumption figures including the
will be safe- guarded for use in the next century and baseline. The baseline has increased from 413
beyond. megalitres per annum (MLpa) to 431 MLpa. The 2014/15
The predicted impacts of climate change and population and the 2015/16 periods show total water consumption
growth will strain our potable water supplies, with potable above the City’s interim target of zero increase from the
water demand in the local government area estimated to 2005/06 baseline by 2016 at 462 and 452 MLpa
be 30 per cent higher in 2030 than in 2006. respectively. This represents a 5% increase for
FY2015/16 relative to the baseline.
The 2014/15 increase was largely due to a mains water Other temporary increased water consumption has been
leak at the Epsom Road Depot, which has been rectified. noted at Sydney Park due to plant establishment and
14
All water data has been updated in this report to reflect recent improvements in data
management processes.
19Green Environmental Sustainability Progress Report July to December 2016
wetland top up requirements during the upgrade works. Estimates for Q1 and Q2 2016/17 indicate a continued
This consumption has reduced as the upgrade works are reduction in potable water consumption with an
nearing completion. estimated annual consumption to end December 2016 as
432 ML, approaching the 2005/06 baseline. It is
anticipated that the estimated result may be overstated.
Note that Q2 2016/17 data is still 90% estimated. Actual
data for this period will be reported in June 2017.
Chart 5: City of Sydney operations potable water use
– All data sourced directly from Sydney Water and contained within and reported from the STEvE system.
– Parks and Public Domain - Includes parks, reserves, playgrounds, street closures, garden beds and nature strips. Also included are water
features that are in the public domain.
– Commercial buildings- Includes income producing buildings, such as Customs House, parking stations and retail shops. It also includes
properties acquired for strategic purposes that do not fall into the above categories.
– Operations - Includes depots and workshops.
– Community buildings- Includes childcare centres, libraries, community centres and town halls.
– Aquatic Facilities – Includes Victoria Park Pool, Andrew (Boy) Charlton Pool, Cook and Phillip Park Aquatic Centre, Ian Thorpe Aquatic Centre
and Prince Alfred Park Pool.
– Exceptions - Only sites where the City has ‘operational control’ are included. Properties where a whole building is leased and the tenant has full
building operations and maintenance obligations, such as the Queen Victoria Building and the Capitol Theatre, are excluded.
– Note - A number of City buildings are used for multiple purposes – for example Customs House is used for office and retail, along with library and
exhibition uses. In allocating each property to one of the above categories, the dominant water user was the determining factor. Over time the
categorisation of a property may change depending on the use.
Water consumption data Calculation
Baseline Current (end Difference Difference Difference = (Current - Baseline)
Organisation
(ML) 2015/16) (ML) (kL) (per cent) Per cent Difference = (Difference /
City of Sydney operations 431 452 21 5 Baseline) x 100
For more information see Appendix 1: Data Management
Plan
20Green Environmental Sustainability Progress Report July to December 2016
How we will get there
Chart 6 shows the estimated contributions of the initiatives we plan to implement across our operational portfolio to meet
our target to maintain our potable water use at 2006 levels. The ‘Complete’ section illustrates savings from initiatives to
date. Based on estimated data for July to December 2016 we are on track to meet our interim target of zero increase
from the 2005/06 baseline by the end of 2016. This chart will be updated in the next report to reflect actual data for 2016.
Chart 6 City of Sydney operations potable water use target. Estimated contribution of initiatives.
.
The City’s existing initiatives to keep our city cool and Key points related to achievement of the 2021 target are:
green and our waterways clean include:
– Looking toward 2021, the City will be required to
– Installing smart meters to detect and fix leaks in our increase service delivery as the population of our
parks and properties. local area grows. This will see an increase in water
– Connecting our parks and buildings to alternative demand from our portfolio of buildings (+15 per cent)
water supplies, such as harvested stormwater and and from new parks (+11 per cent).
rainwater. – Building retrofits (-7 per cent) reflects estimated
– Upgrading park irrigation systems to be more efficient savings from retrofits of the City’s most resource-
– Retrofitting our high water-using properties with water intensive properties.
efficient fixtures and fittings. – Recycled water in parks and buildings (-12 per cent)
– Incorporating raingardens and swales during estimates the savings that could be achieved from
streetscapes and open space upgrade projects to identified future City stormwater harvesting schemes
reduce stormwater pollution discharged to our including Green Square Town Centre.
waterways. – Recycled water schemes along George Street and in
Greater Green Square (-9 per cent) could achieve
significant reduction in potable water demand for the
City, but are highly dependent upon the support of the
state government and the private sector.
21Green Environmental Sustainability Progress Report July to December 2016
PROJECT UPDATE The 2012 Parks Water Savings Action Plan has been
Water Consumption in Parks reviewed and a new four year action plan to support the
2021 Environmental Action plan is being developed.
Improvements to the data capture, and record keeping
Since 2006, the area of parks and open are continuing, with our focus on data reliability. A
contract to manage harvested stormwater systems and
spaces requiring irrigation in the Local track overall system performance was established in
Government Area (LGA) has increased September 2015. A project has commenced to deliver a
by 52 per cent. new centralised monitoring and control system for parks
water use. The implementation of this system will be
These include Wentworth Park, Redfern Park, Redfern
critical in ensuring efficient operations of the City’s
Oval, Pirrama Park, Harmony Park, Prince Alfred Park,
irrigation, water recycling systems, water features and
Paddington Reservoir Gardens, Peace Park, Lillian
sports field lighting. The benefits of the new system will
Fowler Reserve, Mary O’Brien Reserve and Coulson
be real time energy and water consumption tracking,
Street Reserve. The total irrigated area as of June 2016
monitoring of asset performance and better controls over
is 810,538 m2 against the baseline of 531,953 m2.
key park operations. Implementation of this system will
Council has committed to a new interim target for water begin in early 2017 with completion in June 2017.
usage in city parks of 180 L per square metre of irrigated
On-going training and specifications that establish the
space by the end of 2016. Between December 2015 and
City’s targets are providing greater efficiency in water
December 2016 City parks and open spaces were
use. As new technologies and systems become
estimated to use 208 L per square metre of irrigated
available, the City will explore each option for future
space. Water consumption is likely to reduce further after
alternate water supply.
establishment periods of newly constructed parks are
complete. A report has been submitted exploring options for
improvements in water monitoring and efficiency for ten
The 2012 Parks Water Saving Action Plan outlined nine
key water use sites with key recommendations now in
actions to contribute to achieving the City’s sustainable
implementation.
water targets. These include staff training, new
technologies and improvements to reporting.
Irrigation
Increase in intensity (L
Actual potable water
Financial Year Irrigated area (m2) irrigated area from potable
use (kL)
baseline (%) water/m2
irrigated area)
2006 132,946 531,953 - 250
2014 166,025 808,479 52.0 205
2015 185,679 808,479 52.0 230
2016 173,230 810,538* 52.4 214
This table has been updated to reflect the addition of previously unallocated water meters as described for chart 5.
*As per June 2016.
22Green Environmental Sustainability Progress Report July to December 2016
PROJECT UPDATE
Sydney Park Water Reuse Scheme
New planting, lighting, seating and picnic areas have
The City of Sydney is finalising the been installed and pathways improved. Wetlands have
second stage of Sydney Park's water been connected via a picturesque series of water
cascades and signage has been erected providing
reuse scheme with the plant and pump information about the water treatment and ecological
equipment operational. The project will function of the wetlands.
contribute to the City’s 2030 targets to Water harvesting is the diversion and storage of
reduce stormwater pollutants entering stormwater that would otherwise drain away. Once
captured, the water can be treated to remove stormwater
our waterways and to replace drinking pollutants and make it suitable for re-use. The $11.3
water through local water capture and million upgrade will allow up to around 850 million litres
reuse. of stormwater to be captured and cleaned each year.
The works involve diverting stormwater via a new
underground pipe into the Sydney Park wetlands from
This project is being partially funded by the Australian the stormwater channel that runs within the park near the
Government’s Water for the Future initiative through the corner of Euston Road and Sydney Park Road.
National Urban Water and Desalination Plan.
Water will be treated using a gross pollutant trap which
The Sydney Park Water Reuse Scheme Stage II follows removes litter, coarse sediment and organic matter from
the successful implementation of Stage I, completed in stormwater via a physical screen, and a bio retention
2010. In 2012/13 Stage I harvested and treated an system which collects water in shallow depressions and
estimated 50 million litres of stormwater, providing a filters it through plant roots and soil. Water drawn from
sustainable water source for the wetlands. the system for reuse, will receive further treatment
Stage II expands the capacity of the wetlands to supply through filtration and ultra violet (UV) cleansing
water for irrigation within the park, as well creating the processes.
potential to supply recycled water for future offsite reuse A sustainable water supply protects the wetlands from
in the local government area. problems such as poor plant establishment, blue green
The project includes landscape improvement works to algae blooms and rapid growth of unwanted, aquatic
enhance the park’s eco-systems, features and recreation plants such as azolla, which blocks sunlight.
opportunities.
23Green Environmental Sustainability Progress Report July to December 2016
PROJECT UPDATE PROJECT UPDATE
Green Square Water Reuse Stage 2 Raingardens
The best opportunity to develop water recycling projects Raingardens are one of the simplest forms of water
in the City of Sydney area is within urban renewal areas sensitive urban design (WSUD) and they are ideal for
as they provide the density and scale required for highly urbanised catchments. The City continues to
efficient investment in recycled water infrastructure. install raingardens to improve water quality and flow.
Infrastructure provision can be planned and installed at Raingardens allow stormwater run-off to be collected and
the time of development, which is cheaper and more absorbed, watering the plants and improving the water
efficient than retrofitting. Redevelopment also allows quality by a process of filtration through a special soil
private water utilities to offer water services across an (bio-filtration media). This process removes key
entire precinct, improving commercial viability. As well, pollutants (suspended solids, heavy metals and high
the City can use planning controls to encourage the concentrations of nutrients such as phosphorous and
delivery of recycled water services. nitrogen) prior to the water entering into the main storm
The City is developing a utility led water reuse scheme in water system, which ultimately discharges into our
the Greater Green Square area outside of the town waterways and bays.
centre. Unlike Green Square Water Reuse Stage 1 which A total of 154 raingardens have been installed to date
captures stormwater for reuse, Stage 2 will collect locally and we continue to install them where viable as part of all
generated wastewater for treatment and reuse. The infrastructure projects the City undertakes.
scheme will be owned and operated by a private water
utility and the City will provide space for recycled water
infrastructure. PROJECT UPDATE
Victoria Park Improvements
PROJECT UPDATE
We are undertaking improvement works in Victoria Park,
Harold Park Stormwater Harvesting Scheme Camperdown to provide a better recreation space for
everyone to enjoy. We are also improving the water
quality of Lake Northam in the centre of the park.
The Johnston’s Creek Masterplan identified opportunities
to treat and harvest stormwater from the Toxteth Incorporation of WSUD into public open space, road and
catchment to provide a non-potable water source for streetscape works and retrofitting the drainage network
irrigation of the new public park at Harold Park. A with stormwater pollutant traps are direct actions from of
separate water re-use study identified opportunities to the Decentralised Water Master Plan to reduce pollution
harvest additional stormwater from the Wigram discharged to waterways via stormwater. Victoria Park
Catchment to extend the recycled water network to upgrade presents an excellent opportunity to incorporate
Jubilee Oval and Federal Park North. This will contribute WSUD at a relatively low cost and at minimal disruption
to the City’s water consumption and stormwater quality to the community as works can be integrated with
targets by providing an alternative water source to planned upgrade works.
maintain our parks and reduce pollution entering Rozelle The Victoria Park upgrade works include installation of
Bay. two new stormwater pollutant traps for Lake Northam, a
The new water reuse scheme includes a treatment new recirculation system, pump and weir to improve
system at Harold Park, underground storage tanks in water quality and a new bio-retention zone and wetland
Harold Park and Jubilee Oval, a rising main and designed with reed plants to clean and filter stormwater
electrical connections from Harold Park to Jubilee Oval runoff in the lake.
and Federal Park North and new irrigation systems in Construction commenced in January 2017 and is
Harold Park and Federal Park North. The water reuse expected to finish in early 2018.
scheme is in the final stages of commissioning and will
be fully operational in March 2017.
Relevant links
The new public park in Harold Park also includes a
– Decentralised Water Master Plan: 2012-2030
series of open spaces and areas of habitat linked by the
existing cliff line, paths connecting neighbourhoods and – Towards 2030: Water Management
parklands, playgrounds, picnic areas and open grass – City of Sydney's plans for decentralised water (video)
spaces, historical interpretations and art opportunities, – Sydney Park wetlands
lighting and park furniture.
24You can also read