Green PE Transnational Technology and Product Roadmap - Power ...
←
→
Page content transcription
If your browser does not render page correctly, please read the page content below

Green PE
Transnational Technology and
Product Roadmap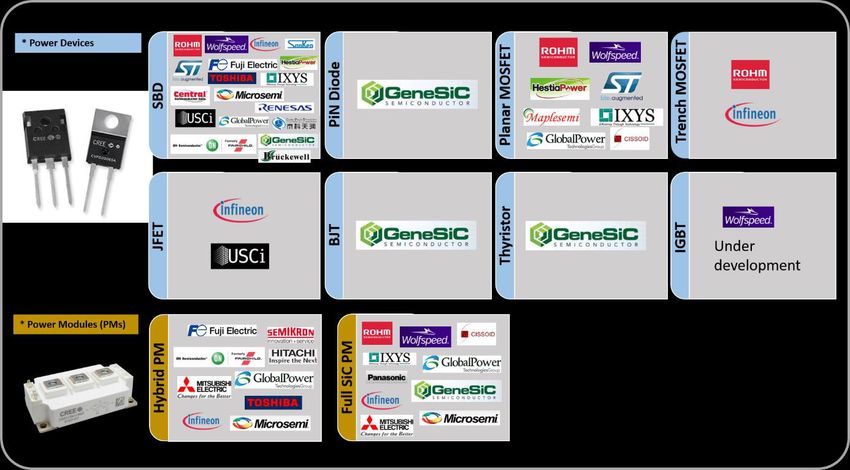
Authors:                           Lead Partner:

Mietek Bakowski, Jang-Kwon Lim,    University of Southern Denmark
Konstantin Kostov, RISE Research   Alsion 2
Institutes of Sweden AB            6400 Sønderborg
                                   Denmark

                                   Contact: Horst-Günter Rubahn
                                   rubahn@mci.sdu.dk
                                   Phone: +45 6011 3517

                                   www.sdu.dk/en/om_sdu/institutter_
                                   centre/mci_mads_clausen
Published in January 2019          www.balticgreenpower.eu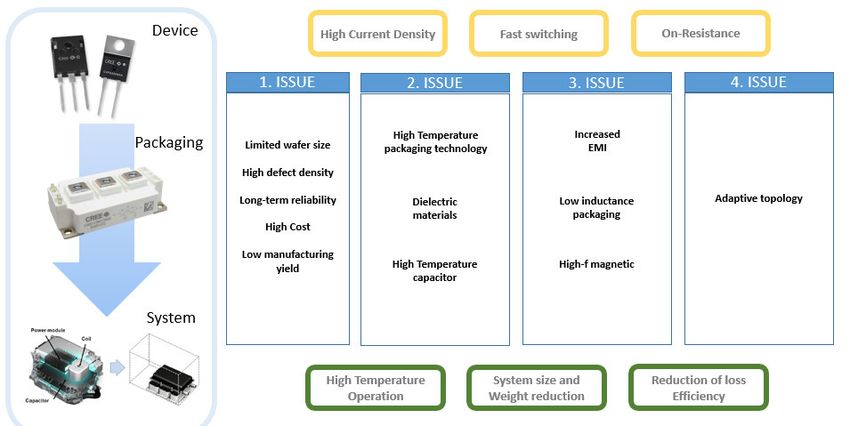
TABLE OF CONTENT

1         Introduction....................................................................................................... 7
2         Energy perspective .......................................................................................... 8
    2.1        Global challenges ....................................................................................................8

    2.2        New paradigm .........................................................................................................8

3         Efficient electric energy conversion ..............................................................10
    3.1        Applications of power electronics...........................................................................10

      3.1.1 Saving potential by wide use of PE ....................................................................10

      3.1.2 Efficient energy conversion with WBG electronics – boosted saving potential....12

      3.1.3 The concept of “Green Electronics” ....................................................................13

    3.2        Value proposition...................................................................................................13

    3.3        Application opportunities versus maturity of the WBG technology .........................13

    3.4        PE market .............................................................................................................14

4         WBG electronics ..............................................................................................16
    4.1        SiC ........................................................................................................................16

    4.2        GaN.......................................................................................................................17

5         WBG substrates...............................................................................................18
    5.1        SiC substrates .......................................................................................................18

      5.1.1 Status and trends ...............................................................................................18

      5.1.2 Suppliers and market .........................................................................................19

    5.2        GaN substrates .....................................................................................................21

      5.2.1 Status and trends ...............................................................................................21

      5.2.2 Suppliers and market .........................................................................................21

6         WBG devices....................................................................................................24
    6.1        SiC discretes and power modules .........................................................................24

      6.1.1 Overall Status and trends...................................................................................24

      6.1.2 Suppliers and market .........................................................................................24
Transnational Roadmap
      6.1.3 Suppliers and market .........................................................................................26

           6.1.3.1        Discrete devices – Diodes ........................................................................26
           6.1.3.2        Discrete devices – MOSFETs ..................................................................27
           6.1.3.3        Discrete devices – Transistors .................................................................27
           6.1.3.4        Power modules ........................................................................................28
    6.2       GaN discretes and power modules ........................................................................29

      6.2.1 Status and trends ...............................................................................................29

      6.2.2 Suppliers and market .........................................................................................30

7         Renewable energy sources ............................................................................31
    7.1       PV and wind ..........................................................................................................31

      7.1.1 Photovoltaic (PV) ...............................................................................................31

           7.1.1.1        Power devices & modules ........................................................................32
           7.1.1.2        Manufacturers ..........................................................................................35
           7.1.1.3        Markets ....................................................................................................36
      7.1.2 Wind turbines .....................................................................................................38

           7.1.2.1        Power devices & modules ........................................................................38
           7.1.2.2        Manufacturers ..........................................................................................39
           7.1.2.3        Markets ....................................................................................................40
    7.2       Marine energy .......................................................................................................40

      7.2.1 Power devices & modules ..................................................................................41

      7.2.2 Manufacturers ....................................................................................................41

      7.2.3 Markets ..............................................................................................................42

    7.3       Energy storage ......................................................................................................42

      7.3.1 Power devices & modules ..................................................................................42

      7.3.2 Manufacturers ....................................................................................................42

      7.3.3 Markets ..............................................................................................................42

8         Switch mode power supplies .........................................................................43
    8.1       Power devices & modules .....................................................................................43

    8.2       Manufacturers .......................................................................................................45

    8.3       Markets .................................................................................................................45

9         Electric and hybrid vehicles ...........................................................................46

                                                                                                                        Page 2 of 70
Transnational Roadmap
  9.1        Power devices & modules .....................................................................................46

  9.2        Manufacturers .......................................................................................................48

  9.3        Markets .................................................................................................................48

10      Industrial motor drives ....................................................................................50
  10.1       Power devices & modules .....................................................................................50

  10.2       Manufacturers .......................................................................................................51

  10.3       Markets .................................................................................................................52

11      Railways ...........................................................................................................53
  11.1       Power devices & modules .....................................................................................53

  11.2       Manufacturers .......................................................................................................54

  11.3       Markets .................................................................................................................55

12      UPS, data centers, base stations for telecom ...............................................56
  12.1       Power devices & modules .....................................................................................56

  12.2       Manufacturers .......................................................................................................58

  12.3       Markets .................................................................................................................58

13      Emerging applications ....................................................................................60
  13.1       Power devices & modules .....................................................................................60

  13.2       Manufacturers .......................................................................................................63

  13.3       Markets .................................................................................................................63

14      WBG market potential .....................................................................................65
  14.1       Power devices & modules .....................................................................................65

  14.2       Inverter market ......................................................................................................65

  14.3       Technical challenges .............................................................................................66

  14.4       Price development .................................................................................................68

15. List of Literature ................................................................................................69
16. Appendix List .....................................................................................................70

                                                                                                                       Page 3 of 70
Transnational Roadmap
LIST OF FIGURES
Figure 1 Power device positioning by voltage and low-to high-end applications. Based on information
from [3]................................................................................................................................................... 13
Figure 2 Power device market (2010-2021) for discrete devices, power modules, and power ICs.
Based on information from [3]. .............................................................................................................. 14
Figure 3 Market size for power devices from 2010 to 2021 in M$ (Source: Yole Inverter Technology
Trends and Market Expectations May 2016 data). ............................................................................... 14
Figure 4 Market share distribution of power electronic applications (Source: Yole Inverter Technology
Trends and Market Expectations May 2016 data). ............................................................................... 15
Figure 5 Market share portion of power electronic applications (Source: Yole Inverter Technology
Trends and Market Expectations May 2016 data). ............................................................................... 15
Figure 6 Regional SiC substrate suppliers. © Green Power Electronics 2017. .................................... 19
Figure 7 SiC wafer supplier status considering material polytypes, doping, and orientation. © Green
Power Electronics 2017. ........................................................................................................................ 19
Figure 8 Market share estimate for n-type SiC substrate players. Based on information from [1]. ...... 20
Figure 9 Market size projection for SiC n-type substrates 2015-2025, reaching a CAGR of 18 % Based
on information from [1]........................................................................................................................... 20
Figure 10 Average price estimation for SiC n-type substrate. Based on information from [1]. ............. 21
Figure 11 Regional players map for GaN-on-Si epitaxy. © Green Power Electronics 2017. ................ 22
Figure 12 Outsourcing GaN epiwafers market volume (Unit, 6” equivalent) during 2016-2021. Based
on information from [2]........................................................................................................................... 22
Figure 13 Market size of outsourcing GaN epi-wafers. Based on information from [2]. ....................... 23
Figure 14 SiC power devices and modules makers according to different types of power devices ©
Green Power Electronics 2017. ............................................................................................................. 24
Figure 15 Market share comparison of SiC device makers. Based on information from [1]. ................ 25
Figure 16 Expectation of SiC power device market split by applications, reaching a CAGR of 20%
(Source: Yole Power SiC Materials Devices Modules Applications June 2016 data). .......................... 25
Figure 17 SiC device market split by diode and transistor during 2015-2025. Based on information
from [1]................................................................................................................................................... 26
Figure 18 Commercially-available SiC diode suppliers. © Green Power Electronics 2017. ................. 26
Figure 19 Commercially-available SiC MOSFET suppliers. © Green Power Electronics 2017. ........... 27
Figure 20 Commercially-available SiC transistor suppliers (other types compared to MOSFET). ©
Green Power Electronics 2017. ............................................................................................................. 27
Figure 21 Estimation of SiC transistor market split by applications. Based on information from [1]. .... 28
Figure 22 Commercially available SiC-based power module suppliers. © Green Power Electronics
2017. ...................................................................................................................................................... 28
Figure 23 Diode market portion split by discrete, hybrid module, and full SiC module. Based on
information from [1]................................................................................................................................ 29
Figure 24 GaN device market split by voltages (200 and 600 V) during 2015-2021. Based on
information from [2]................................................................................................................................ 29
Figure 25 GaN power device market split by application 2015-2021, reaching a CAGR of 86 %. Based
on information from [2]........................................................................................................................... 30
Figure 26 Existing GaN power device suppliers (including devices commercially available, under
development, demonstrated, and in sampling). © Green Power Electronics 2017. ............................. 30
Figure 27 Market forecast in units for SiC diodes and transistors in PV during 2015-2021. Based on
information from [1]................................................................................................................................ 32

                                                                                                                                           Page 4 of 70
Transnational Roadmap
Figure 28 Market share for SiC diodes and transistors in PV during 2015-2021. Reproduced from [1].
............................................................................................................................................................... 33
Figure 29 Market forecast for GaN devices in PV during 2015-2021 in units. Reproduced from [2]. ... 34
Figure 30 Market for GaN devices in PV during 2015-2021. Based on information from [2]. ............... 34
Figure 31 Manufacturers in different parts of the supply chain for PV market. © Green Power
Electronics 2017. ................................................................................................................................... 35
Figure 32 Market forecast segmented by inverter size during 2015-2021. Based on information from
[3 and 4]. ................................................................................................................................................ 36
Figure 33 Installed PV capacity forecast during 2015-2021. Based on information from [3 and 4]. ..... 36
Figure 34 Market forecast for PV inverter during 2016-2025, showing a CAGR of 3.2 %. Based on
information from [3 and 4]...................................................................................................................... 37
Figure 35 PV market split in 2015. Produced by [3]. ............................................................................. 37
Figure 36 Market forecast for SiC diodes in Wind Turbines in units. Based on information from [1]. ... 38
Figure 37 SiC diode market in Wind Turbines. Based on information from [1]. .................................... 39
Figure 38 Regional wind turbines manufacturers © Green Power Electronics 2017. ........................... 39
Figure 39 Comparison of market shares between 2014 and 2015. Based on information from [3]...... 40
Figure 40 Regional manufacturers for tidal turbine converter © Green Power Electronics 2017. ........ 41
Figure 41 SiC device market for PFC in units. Based on information from [1]. .................................... 43
Figure 42 SiC device market for PFC. Based on information from [1]. ................................................. 44
Figure 43 GaN device market for PFC in units. Based on information from [2]. ................................... 44
Figure 44 GaN device market for PFC. Based on information from [2]. ............................................... 45
Figure 45 SiC device market for EV/HEV application in units. Based on information from [1]. ............ 46
Figure 46 SiC device market for EV/HEV application. Based on information from [1]. ......................... 46
Figure 47 GaN device market for EV/HEV application in units. Based on information from [2]............ 47
Figure 48 GaN device market for EV/HEV application. Based on information from [2]. ....................... 47
Figure 49 Electric vehicle manufacturers © Green Power Electronics 2017. ....................................... 48
Figure 50 Annual demand for EV/HEV by vehicle type in units. Based on information from [3]. .......... 49
Figure 51 Market forecast for EV/HEV inverter by vehicle type. Based on information from [3]. ......... 49
Figure 52 SiC device market for motor drives in units. Based on information from [1]. ........................ 50
Figure 53 SiC device market for motor drives. Based on information from [1]. .................................... 50
Figure 54 AC motor drive market split in 2015. Based on information from [3]. ................................... 51
Figure 55 AC motor drive inverters market. Based on information from [3]. ......................................... 52
Figure 56 SiC device market for trains in units. Based on information from [1]. ................................... 53
Figure 57 SiC device market for trains. Based on information from [1]. ............................................... 54
Figure 58 Train manufacturers market split in 2015. Based on information from [3]. ........................... 54
Figure 59 Inverter market for different train types. Based on information from [3]................................ 55
Figure 60 Market forecast for SiC diodes and transistors for UPS during 2015-2021 in units. Based on
information from [1]................................................................................................................................ 56
Figure 61 Market of SiC diodes and transistors for UPS during 2015-2021. Based on information from
[1]. .......................................................................................................................................................... 57
Figure 62 GaN device market for UPS in units. Based on information from [2]. ................................... 57
Figure 63 GaN device market for UPS. Based on information from [2]. ............................................... 57
Page 5 of 70Transnational Roadmap
Figure 64 Large UPS manufacturer market split in 2015. Based on information from [3]. ................... 58
Figure 65 Inverter market size for UPS split by power range. Based on information from [3]. ............. 59
Figure 66 GaN device market for wireless power in units. Based on information from [2]. .................. 60
Figure 67 GaN device market for wireless power. Reproduced by [2]. ................................................. 61
Figure 68 GaN device market for envelop tracking in units. Based on information from [2]. ................ 61
Figure 69 GaN device market for envelope tracking. Reproduced by [2]. ............................................ 62
Figure 70 GaN device market for Lidar in units. Based on information from [2]. .................................. 62
Figure 71 GaN market for Lidar. Based on information from [2]. .......................................................... 63
Figure 72 Whole inverter market in units split by application. Based on information from [3]. ............. 65
Figure 73 Inverter market forecast split by application. Based on information from [3]. ....................... 66
Figure 74 Expected benefits from device to system with SiC-based power devices vs issues. © Green
Power Electronics 2017. ........................................................................................................................ 67
Figure 75 SiC MOSFET cost breakdown. The cost of the SiC MOSFET is calculated to be 3.05, 3.12
and 3.4 $/device, respectively, counting from left to right. Based on information from [1]. ................... 68
LIST OF TABLE
Table 1 Paradigm shift. © Green Power Electronics 2017. ................................................................... 13
Table 2 Quality of SiC wafers and epilayers © Green Power Electronics 2017.................................... 18
Page 6 of 70Transnational Roadmap
1 Introduction
This output document formulates a roadmap for wide bandgap (WBG) electronics in the
perspective of the increasing demand for electric energy and climate change. New WBG
semiconductor materials facilitate revolutionary changes in the power electronics (PE) and
enable a drastic increase of electric energy conversion efficiency and an increase in the power
density of electric systems. The implementation of new efficient PE should speed up the
electrification and efficient use of electric energy in many application areas with large energy
savings as a result.
This roadmap provides general background information to the localised roadmaps of the
development towards the implementation of green energy in the Baltic Sea Region presented
in a separate document (Regional Mapping of the sectorial specialization for different
countries/regions).
This roadmap aims to increase knowledge among industry (firms, component producers,
system providers, consulting and financing, business incubators, business development
agencies), research institutes (R&D institutions, technology parks, technology platforms),
governmental organizations (policy maker, regulatory bodies, public procurement), and society
about chances and barriers for the market uptake of Advanced Power Electronics.
The roadmap is meant to raise awareness among industry, especially small and medium sized
enterprises (SME), research institutes, governmental bodies, and society in the Baltic Sea
Region and beyond about the importance, market attractiveness and benefits of Advanced
Power Electronics.
Page 7 of 70Transnational Roadmap
2 Energy perspective
The importance of power electronics and of the new WBG materials has to be seen in the
perspective of the energy demand and climate change. One of the greatest challenges for
mankind is the accelerating global demand for electric energy. Improved efficiency in
production, distribution and consumption of electricity is a key factor on the road to a
sustainable energy future. Efficient power electronics and WBG technologies play an important
role.
2.1 Global challenges
The individual energy consumption in Europe has been growing almost exponentially in the
history of mankind accelerating from the middle ages and throughout the industrial era and it
continues to grow. A similar growth of energy consumption is now taking place in the
developing part of the world. At present, 25 % of the world population is consuming 75 % of
the energy. At the same time the world population is growing rapidly. The world population is
predicted to reach 9 billion people in year 2050, which is a 5-fold increase since 1950. Most of
this demographic explosion takes part in the developing countries. Consequently, a large
increase in global energy demand is expected in the coming years.
There are two environmental challenges related to the production and consumption of energy.
One is the limited supply of fossil energy resources (oil, gas and coal) and second is the climate
warming due mainly to the CO2 emissions.
Moreover, the demand for electricity is growing steadily. The consumption of electrical energy
worldwide is estimated to grow by 160 % by year 2050. Access to this basic commodity is very
unevenly distributed in the world and the biggest increase will take place in the developing
world. The electricity is generally thought of as an environmentally friendly and clean energy
source. However, about 70% of the electrical energy generation in 2025 is predicted to rely
still on fossil energy sources, and only about 20 % on renewable energy sources and 10 % on
nuclear power.
The focus on energy efficiency comes from two sources - one is the necessity to preserve
natural resources by transforming them into electrical energy in the most efficient way, and
second is saving electrical energy by using it in the most effective way mainly by reducing
losses in the electrical power systems.
2.2 New paradigm
Power electronics is the key technology in controlling the flow of electrical energy from the
source to load. The share of total electrical energy in industry, transportation, as well as home
and office appliances, which is controlled by power electronics e.g. in variable speed drives
(ac motors) was estimated to increase from 40 % to 80 % since 2000.
Energy saving, improved energy efficiency and environmental protection have become top
priority political issues in Europe. The demand for electricity is expected to grow much faster
compared to other energy sources until 2050. The consumption of electrical energy is
predicted to grow from 40% to over 60% of all energy consumption. It becomes urgent to
reduce consumption by increasing efficiency and to improve generation by increased use of
renewable energy sources. Power electronics assume a key role in this perspective.
Page 8 of 70Transnational Roadmap
Efficiency of power electronic systems depends on losses in active and passive components.
The efficiency can be greatly improved by replacing the silicon devices by silicon carbide (SiC)
or gallium nitride (GaN) ones. The specific material properties of SiC translate into high value
added for electronic power systems. Specifically, high electric field breakdown in combination
with reasonably high electron mobility and high thermal conductivity translate into improved
efficiency, dynamic performance and reliability of electronic and electric systems. It is relatively
straight-forward to envisage savings on cooling requirements connected with increased
working temperature of the devices well above the 125 to 150 C typical of silicon power
devices as well as reduced noise, size and weight of systems due to greatly increased
switching frequency. To overcome both limitations has long been desirable especially in high
voltage applications above 1 kV where bipolar silicon devices must be used. Such devices are
necessarily slow and suffer from high switching losses due to substantial recovery charge
which makes them the limiting component in the performance of many systems.
The appearance of wide bandgap (WBG) power devices on the market will bring about and
accelerate new developments in the areas of packaging, passive components (capacitors),
circuit and system design as well as improvements in construction and operation of electric
motors. It will not be in general most effective just to substitute Si devices by WBG ones in
existing circuits. It will be necessary to adopt new solutions in order to utilize the full potential
of increased operational frequency, working temperature and reduced size of active devices.
The advent of WBG power devices will reinforce thinking in terms of the total power system
including electrical, mechanical and electromechanical components. It will provide an incentive
towards an increased integration of electronics with electromagnetic and mechanical parts of
the system. The electrical motors will have to be improved as well in order to facilitate the
integration and utilisation of the benefits of high frequency operation.
The most dynamic R&D areas in the near future are advanced device concepts and high
temperature WBG power semiconductor materials such as SiC, GaN, and diamond, compact
high power density system design for Si and WBG semiconductors, new interconnection
technologies for ultra-high power density systems and high temperature electronics, advanced
materials for isolation, high thermal conductivity, high temperature compact passives and
sensors, in lighting smart and simple dimming concepts, high efficiency light sources
(LED/OLED) and their power electronic drivers, load management by power electronics in
distributed energy generation networks, multi-domain/level modeling and simulation, stress
analysis and built-in reliability, improved system reliability and fault-tolerant systems.
Page 9 of 70Transnational Roadmap
3 Efficient electric energy conversion
Power electronics is the enabling technology for efficient use, distribution and generation of
electrical energy. Advanced power electronics could for example realize savings of more than
50 % in energy losses in converting from mains or battery voltages to that used in electronic
equipment.
Power electronics is key technology for sustainable development. Sustainable development
demands increasing use of electric energy. Increasing demand of electric energy demands
electric energy saving and efficient use of electric energy. The generation, distribution and use
of electric energy requires electric energy conversion which in turn requires power electronics.
Those are the major drivers for power electronic systems and highly efficient electric energy
conversion.
3.1 Applications of power electronics
Use of efficient power electronics is needed in many applications like a) electrification of
transport (automobiles, busses, trains, airplanes, forklift trucks, …), b) industrial electric motor
drives (pumps, funs, compressors, conveyers, steel mills, …), c) elevators and escalators, d)
heat pumps and air conditioners, e) home appliances, f) high-frequency industrial applications
(resonant converters), g) electric grid (HVDC, flexible AC transmission systems (FACTS)).
3.1.1 Saving potential by wide use of PE
The energy saving potential of widely used modern power electronics is related to highly
efficient variable speed motor drives with energy recovery used in various applications, to
smart power supplies enabling high efficiency over a wide load range and zero-power standby
function as well as to energy efficient and low-emission mobility with hybrid and electric
vehicles.
Power electronics is, furthermore, enabling a sustainable energy supply based on renewable
energy sources such as wind and solar. Power electronics facilitates efficient transfer of the
energy from these intermittent sources to the electricity grid. It also enables the connection of
various energy storing solutions that will help managing the stability of the power grid.
The estimated energy savings potential of wide introduction of power electronics into systems
is more than 25 % of the current electricity consumption by 25 EU member states.
Some examples of savings potential and key role of power electronics are:
(a) Electric motor drives including industrial motor drives, elevators and escalators, heat
pumps and air conditioning, home appliances and traction drives are estimated to
account for 50% of total electricity consumption in Europe.
The energy savings potential by introducing Variable Speed Drives (VSDs) is estimated
to be 30 – 40 % for most applications. The technical potential for energy savings is
relevant for about 40 – 50 % of all motors depending on the application, and given that
VSDs have already been applied to about 15 – 20 % of all motors the remaining
potential is estimated to be about 30 %. There is an additional energy saving of 20 %
through the recuperation of electrical machines during breaking, which is frequently
used in elevators and traction application of trains and heavy vehicles with power
electronic converters. Combining all these figures, the total electrical energy-savings
potential of VSDs is about 5 – 6 % of the current electrical energy consumption.
Page 10 of 70Transnational Roadmap
(b) Mobility and transportation is responsible for 30 % of energy consumption and is the
fastest growing sector of European economy.
Power electronics is an enabling technology for the development of drive trains and
battery-charging for the hybrid and electrical vehicles. Hybrid and electric buses using
electric vehicle propulsion technology are increasingly becoming part of transportation
systems. They offer considerable fuel savings and reduce emissions. Power
electronics is a necessary part of the drive train of these buses.
Furthermore, the increasing electrification of previously mechanical and hydraulic
vehicle functions and introduction of such x-by-wire applications like electric power
steering or electric braking, require the use of power electronics.
Aviation is responsible for ~12 % of the transport energy consumption and is the
fastest-growing energy consumer in the EU, with an increase of 73 % between 1990
and 2006. Air transport demand is predicted to double in the next 10 - 15 years and
triple in 20 years. Power electronics is also an enabling technology for the more electric
aircraft, where various bleed air and hydraulic power functions are replaced with
electrical equivalents. Which enables a significant improvement in efficiency, system
flexibility, aircraft reliability and specific fuel consumption.
(c) Smart grid and renewables are on the priority actions list by the European Commission
in its Action Plan for Energy Efficiency. One of the priority actions is to make power
generation and distribution more efficient. Transmission and distribution (T&D) losses
of electrical energy are typically between 6 % and 8 %. A European Task Force T&D
Working Group has identified a number of energy-efficient technologies for grids,
including power electronics technologies such as HVDC, FACTS, power electronic
transformers, distributed generation and micro grids. Power electronics is necessary to
interface distributed generators such as wind turbines and solar cells to the grid.
Power electronics has been identified as a key technology in all four pillars of Smart
Grids:
(1) Integration of renewables: wind turbine converters, HVDC for offshore wind park
connection, SVC/STATCOM for grid code compliance, energy storage for
improving stability and decreasing power fluctuations, solar inverters,
(2) Integration of electric vehicles: (fast) charging of electric vehicles, traction drive
for hybrid electric vehicles, dynamic energy storage to absorb peaks due to
simultaneous charging of electric vehicles,
(3) Reliability and efficiency: efficient long distance transmission with HVDC,
variable speed drives in industrial plants and pumped hydro stations, energy
storage for emergency and peak power, power quality solutions for industry,
(4) Demand response: converter interface to distributed generation with built-in load
management capability drives in pumped hydro station with remote control from
control center.
(d) Data centers and base stations.
Electrical energy demanded by data centers and servers in Western Europe was 56
TWh in 2007 and is forecast to increase incrementally to 104 TWh in 2020. In a typical
data center, less than half of this power is delivered to the compute load, which includes
microprocessors, memory and disk drives. The rest of the power is lost in power
conversion, distribution, and cooling. The use of advanced power electronics
techniques, like new DC distribution networks, can lead to a 10 % reduction of the
required energy. The integration of ICT technologies and power electronics and
Page 11 of 70Transnational Roadmap
improving energy management can save an additional 20 %. Further research on
reliability, implementation and cost reduction can further improve these numbers.
Estimates indicate that the telecom industry consumes 1 % of the global electricity, and
more than 90 % is consumed by network operators. Almost 30 % of electrical energy
savings can be achieved in radio base stations (RBS) by employing efficient power
electronics technologies such as efficient power amplifiers and techniques for low
consumption in standby mode. In ICT applications power supplies require ultra-high
power density along with high efficiency at the same time. With the new power devices
and optimized passive components this target can be achieved.
The annual electricity consumption related to standby functionalities and off-mode
losses in the EU was estimated to have been 47 TWh in 2005. It has been estimated
that the total annual energy savings potential for standby consumption in the EU is
35TWh, and power semiconductor manufacturers claim that more than 90 % standby
consumption reduction is feasible.
(e) Lighting in commercial, industrial and residential building, and street lighting
The savings are related to new technologies based on solid-state lighting (light emitting
diodes, LED) requiring electronic power conversion. By operating LEDs with pure
digital controlled power converters, the lifetime is significantly longer along with an
additional energy saving potential.
(f) Intelligent buildings by control of lighting and energy consumption and occupancy
sensing.
3.1.2 Efficient energy conversion with WBG electronics – boosted saving potential
WBG materials (primarily SiC and GaN) enable a revolutionary development in the field of
electrical energy conversion. Electronic devices based on these materials enable dramatically
lower losses, higher frequencies and compact highly efficient electrical power systems. The
losses can be reduced by at least 50 % in most of the PE applications using WBG technologies.
The total savings potential by introduction of WBG based PE in all the applications is thus
estimated to be for
(a) Electric motor drives more than 20 % of the current electrical energy consumption
assuming that WBG based VSDs are used in 50% of applications with additional energy
savings of 50%. Other assumptions as in section 3.1.1 including the 20 % recovery of
the energy at breaking.
(b) E-mobility and transportation the total potential depends on the degree and pace of the
electrification. Introduction of WBG electronics should accelerate electrification process
enabling 4-6 % increase of efficiency of converters resulting in the increased range on
the same battery charge and in the reduced fuel consumption and thus reduced CO2
emissions from hybrid vehicles due to the compactness and thus reduced weight of the
electric systems.
(c) Smart grid and renewables more than 2-4 % of the total transmitted and distributed
electrical energy. Environmental gains are dominant however 50 % savings from the
level of the state of the art inverters is feasible.
(d) Data centers and base stations about 50 % reduction of losses from the levels of the
state of the art power electronics seems to be a good estimate.
(e) Lighting and (f) Intelligent buildings saving potential should be significant also in these
applications.
Page 12 of 70Transnational Roadmap
3.1.3 The concept of “Green Electronics”
Green Electronics is an interdisciplinary electronic technology for efficient use of electric
energy based on PE, microelectronics, ICT (Information and Communication Technologies)
and electronic materials. The concept fits the paradigm shift to the more electricity dependent
and electric energy-oriented society.
Table 1 Paradigm shift. © Green Power Electronics 2017.
New Paradigm Enabling technologies
Energy efficiency Power electronics
System perspective ICT
System integration WBG materials
System optimization Magnetic, dielectric & insulating materials
System cost Interconnection materials
High power density 3D & low inductive packaging
Heterogeneous integration HT packaging & efficient cooling
3.2 Value proposition
Development of advanced power electronic products and systems for renewable energy
sources, electrification of vehicles and transportation and smart grids means competitive
advantages for national products on the global market and opportunity of industrial renewal
and growth for the national economy.
3.3 Application opportunities versus maturity of the WBG technology
WBG electronics will make gradual intrusions into the PE market dominated today by Si
devices. All different semiconductor materials and technologies will be utilized depending on
the application, maturity and price.
The next five years are decisive and very promising for SiC and GaN devices. System
manufacturers are developing new prototypes with these devices and in the next several years
the results will reach the market. By 2020 WBG materials will be implemented in specific areas
in each application segment.
GaN GaN
SiC
MOSFET
Product range
Triacs
IGBT
Bipolar Thyristor
IGCT
etc. …
200V 600V or less 1200V or 3.3kV and more
more
Voltage
Figure 1 Power device positioning by voltage and low-to high-end applications. Based on information
from [3].
Page 13 of 70Transnational Roadmap
3.4 PE market
The power electronics market is expected to remain steady after 2018.
According to [3], the power electronics market contracted in 2015, despite most indicators
pointing towards continuing growth.
25000 0,5
Discretes
Power Modules
Power IC 0,4
20000
Annual Growth Rate, %
PE Market Size, $M
0,3
15000
0,2
10000 0,1
0,0
5000
-0,1
0 -0,2
10 11 12 13 14 15 16 17 18 19 20 21
20 20 20 20 20 20 20 20 20 20 20 20
Year
Figure 2 Power device market (2010-2021) for discrete devices, power modules, and power ICs. Based
on information from [3].
Even though every device will see an increase with CAGR of +3.4 %, power modules & IPMs
will have the biggest growth, reaching a CAGR of +9.4 %.
According to [3], modules will increase considerably, while discrete (IGBT & MOSFET)
expansion will be slowed down.
25000
Power Device Market in M$
20000
15000
10000
Rectifiers
Thyristors
Bipolar
5000 X-FET
IGBT
Module & IPM
Power IC
0
10 11 12 13 14 15 16 17 18 19 20 21
20 20 20 20 20 20 20 20 20 20 20 20
Year
Figure 3 Market size for power devices from 2010 to 2021 in M$ (Source: Yole Inverter Technology
Trends and Market Expectations May 2016 data).
Page 14 of 70Transnational Roadmap
The global power electronics market is expected to steadily increase during 2015-2021.
Particularly, the automotive industry is expanding with the evolution of electric vehicles (EVs)
and hybrid electric vehicles (HEVs).
Power Electronic Applications Market Share, $M
25000
20000
15000 IT/Electronics power supply
White goods/large consumer appliances
Industry
Automotive
10000 Lighting
Telecommunication
Medical
Transportation
5000 Energy generation
T&D
Military & Aerospace
Others
0
12 013 014 015 016 017 018 019 020 021
20 2 2 2 2 2 2 2 2 2
Year
Figure 4 Market share distribution of power electronic applications (Source: Yole Inverter Technology
Trends and Market Expectations May 2016 data).
In total power electronic market, the applications of automotive, industry, IT/electronics
power supply have a big portion in a market share. The decreased market portion of
IT/Electronics power supply is due to the increased market of automotive industry.
Power Electronic Applications Market Share, %
100
80
60 IT/Electronics power supply
White goods/large consumer appliances
Industry
Automotive
40 Lighting
Telecommunication
Medical
Transportation
20 Energy generation
T&D
Military & Aerospace
Others
0
12 013 014 015 016 017 018 019 020 021
20 2 2 2 2 2 2 2 2 2
Year
Figure 5 Market share portion of power electronic applications (Source: Yole Inverter Technology
Trends and Market Expectations May 2016 data).
Page 15 of 70Transnational Roadmap
4 WBG electronics
4.1 SiC
The total SiC device market was estimated to be worth more than 200 M$ in 2015 and a
projection for 2021 is 600 M$ with a mean growth rate (CAGR) of 20 %.
The growth is fueled by more players entering the market from material to device level,
increased availability of SiC devices and increase in number of users of SiC devices.
The switch mode power supply (PFC) market is still leading SiC application with 100 M$ worth
in 2015.
The market of Photovoltaic (PV) applications is expected to reach more than 180 M$ in 2021.
The modification of micro-inverter topology caused the decrease in the use of SiC diodes,
however the performance and price benefits of SiC on the system level for string PV inverters
are now widely acknowledged motivating the use of both SiC diodes and SiC MOSFETs.
For EV and HEV applications the main market increase before 2021 is expected to be in on-
board chargers. Regardless of the fact that many leading OEMs are testing SiC devices, no
significant adoption of the SiC for power train inverter or DC/DC converter is expected before
2021 due to the high cost and relative lack of SiC MOSFET maturity. The pioneers like Toyota,
Nissan and Honda will however continue to develop and test SiC based solutions.
The continued intense development and implementation of the SiC solutions is expected in the
Traction applications during the coming 5 years in both auxiliary and propulsion systems at 1.7
kV and 3.3 kV. The mainly hybrid solutions (SiC diodes and Si IGBTs) by Hitachi, Mitsubishi
Electric, Toshiba and Fuji will be followed by others. The present concerns about the reliability
issues must be overcome before a widespread adaptation of SiC technologies can take place.
When it comes to SiC devices, the 85 % of the SiC device market worth 170 M$ in 2016 is
attributed to SiC diodes. The performance and the value added have been gradually improved
and confirmed since the commercialization in 2001. Also, the price has been gradually reduced
as more and more suppliers has entered the market since the 2009 reaching a number of 18
suppliers by May 2016. Considering the low integration effort, relative maturity of the diode
technology and continued falling price the diode market is estimated to continue grow with a
CAGR of 14 % and reach 400 M$ in 2021.
The SiC MOSFET has become the switch concept that will dominate the market. Both
DMOSFET and Trench MOSFET will be developed and available at the market during the
coming years. The strong argument for the DMOSFET is a long-established process
guaranteeing the reliability and for Trench MOSFET a better performance at the cost of more
difficult process.
There are four main issues hindering the market growth of SiC MOSFETs. They are
confirmation of long-term reliability, more independent sources of devices, device cost and
integration issues (gate drivers). There are at present only four MOSFET suppliers, however
more suppliers are expected to enter the market within nearest two years (Infineon, GE, Hestia-
Power, Global Power Technologies, Panasonic, and Fairchild). The high device cost is mainly
related to the high cost of SiC substrates and the lower yield compared to diodes.
Considering all the above the SiC switch market is estimated to be worth only 27 M$ in 2015,
representing less than 15 % of the total SiC device market. However, as more suppliers enter
the market after 2018, the market is expected to reach about 200 M$ by 2021, representing
more than 30 % of the total SiC device market.
Page 16 of 70Transnational Roadmap 4.2 GaN The GaN power business was only 6.8 M$ in 2015. A couple of developments during 2015 and 2016 constitute a positive change in market development. Since 2016 not only low voltage GaN (
Transnational Roadmap

5 WBG substrates
5.1 SiC substrates
The increase in substrate size has been dramatic over the last 15 years, motivated by the
prospect for SiC technology to enter production phase. Today 100 mm wafers can be
purchased, and 150 mm and 200 mm wafers have been demonstrated. The introduction of
150 mm (6 inch) substrates can be the turning point for SiC device production since much of
the equipment used for processing Si can also be used for SiC.
Market introduction of the SiC technology requires in addition to the reasonable wafer size an
adequate quality of the semiconductor material. All the SiC power devices require at least one
epitaxial layer with controlled doping and thickness to be grown on top of the highly doped
substrates. The major limiting factor for the quality of SiC epitaxial films is the substrate
material itself. Even if the development of SiC substrates has been successful during the last
fifteen years the quality is still much poorer compared to the Si substrates.
Best SiC epitaxial layers still contain a high density of detrimental defects like Threading Edge
Dislocations (TEDs) (2000 – 5000 cm-2), Threading Screw Dislocations (TSDs) (300 – 1000
cm-2), Basal Plane Dislocations (BPDs) (0.1 – 10 cm-2), Stacking Faults (SFs) (0.1 – 1 cm-2)
and micropipes (0 - 0.02 cm-2), the majority of which propagate from the bulk of the substrate
into the epi-layers [Kimoto]. In addition, other defects that are generated during epitaxial growth
include different growth pits (102 – 104 cm-2) most likely caused by substrate surface damage
introduced during cutting and polishing. The maximum chip size is still about 50% of that for Si
IGBTs. Production of large area power devices requires further significant improvement of
substrate quality.

5.1.1 Status and trends
Table 2 Quality of SiC wafers and epilayers © Green Power Electronics 2017.

   Extended defects         Density in substratets (cm-2)        Density in epilayers (cm-2)
       Micropipe
Transnational Roadmap
5.1.2 Suppliers and market
According to [1], the U.S., Europe, and Asia have their own SiC wafer suppliers.
Regional SiC Substrate Suppliers
U.S Europe Asia
Hebei Tongguang
(logo to be confirmed)
Figure 6 Regional SiC substrate suppliers. © Green Power Electronics 2017.
According to [1], all companies supply 4H n-type substrates for power electronics
applications.
SiC Wafer Supplier Status
Material polytypes, doping, and orientation
Supplier 4H 4H 6H 6H
Epiwafers
n-type semi-insulating n-type semi-insulating
CREE √ ” , de o 8” √ ” √
Denso √ ”
Dow Corning √ ” √
Hebei Tongguang √ ”
SiCrystal (affiliated to ROHM) √ ” √ ” √ ROHM
II-VI √ ” , de o 8” √ ” ,o or off-axis √ ” ,o or off-axis
Nippon Steel √ ” √
Norstel √ ” √ ” √
POSCO de o ”
Nitride Crystals √ ”
SKC (former Crysband) √ ”
SICC √ ” √ ” √
TankeBlue √ ” ,de o ” √ ” √ ” √ ”
√ : Maximum wafer diameter fully commercially available, off-the-shelf, as of today
Figure 7 SiC wafer supplier status considering material polytypes, doping, and orientation.
© Green Power Electronics 2017.
Page 19 of 70Transnational Roadmap
According to [1], Cree still leads the SiC market with approximately 40 % market share in
2014 and 2015.
0,45
of n-type SiC substrate suppliers, %
0,40
2014
2015
0,35
Estimation of market share
0,30
0,25
0,20
0,15
0,10
0,05
0,00
EE ing d) I el tel e C rs
CR de II-V Ste Nors Blu SIC Othe
orn inclu on ke
w C
M p p T an
Do OH Ni
(R
s tal
ry
SiC SiC Substrate suppliers
Figure 8 Market share estimate for n-type SiC substrate players. Based on information from [1].
According to [1], the volume increase was partially offset by a reduction in selling prices, but
the market continues to grow.
180
SiC N-type substrate market size, $M
160 CAGR 2015 - 2025: 18 %
140
120
100
80
60
40
20
0
15 016 017 018 019 020 021 022 023 024 025
20 2 2 2 2 2 2 2 2 2 2
Year
Figure 9 Market size projection for SiC n-type substrates 2015-2025, reaching a CAGR of 18 % Based
on information from [1].
According to [1], the price of both 4” and 6” substrates continues to decrease. 4” to 6”
transition has begun (about 20 % of wafers in the SiC power business is estimated to be 6”).
The wafer is the major cost contributor and the cost pressure of a SiC power device is
Page 20 of 70Transnational Roadmap
transferred to the material suppliers. Some players with a strong position ask suppliers to
align with their targets. In addition, some suppliers are willing to provide wafers at pricing 20-
40 % lower in large quantities.
Average Price Estimation of SiC N-type Substrate, $
1400 3.0
6"/4" ratio n-type (4 inch)
1200 p-type (6 inch)
2.5
1000
2.0
6"/4" ratio
800
1.5
600
1.0
400
0.5
200
0 0.0
2014 2015 2016 2017 2018 2019 2020 2021
Year
Figure 10 Average price estimation for SiC n-type substrate. Based on information from [1].
5.2 GaN substrates
GaN substrates for device manufacturing can be obtained by homoepitaxy on bulk GaN
substrates or by heteroepitaxy mainly on SiC or Si bulk substrates. The cost and size of the
bulk substrates determines the cost of the GaN substrates for device manufacturing. This is
the main driving force behind GaN-on Si epitaxy development.
5.2.1 Status and trends
GaN substrates facilitating homoepitaxy and development and production of GaN-on-GaN
devices are still small in size and contain orders of magnitude higher dislocation densities
compared to the SiC substrates. Small size of the GaN substrates is a major factor when it
comes to the manufacturing cost.
Alternative way of obtaining GaN substrates for device development and manufacturing is by
GaN-on-Si epitaxy. Problems of the lattice and thermal expansion coefficient mismatch
leading to the wafer bow and cracking has been solved to a large extent. Remaining issues
are yield, large dislocation densities and process reproducibility and stability. Reliability
issues are as yet not in focus. However large dislocation densities cause serious device
problems influencing blocking capability and reliability and giving rise to excessive leakage
currents and dynamic on-resistance instabilities related to the charge trapping at the defect
sites and impurities.
5.2.2 Suppliers and market
According to [2], more and more players are entering the GaN-on-Si field. GaN-on-Si is the
dominant solution, however an increasing interest in GaN-on-GaN technology at the R&D
level amongst GaN HEMT players and wafer/epi suppliers is observed.
Page 21 of 70You can also read