Greenhouse gas emissions in Minnesota: 1990-2016 - Pollution Control Agency Department of Commerce - Minnesota Pollution Control ...
←
→
Page content transcription
If your browser does not render page correctly, please read the page content below

Climate change

      January 2019

      Greenhouse gas emissions
      in Minnesota: 1990-2016
      Biennial report to the Legislature tracking the state’s contribution to emissions
      contributing to climate change.

      Pollution Control Agency
      Department of Commerce

lraq-2sy19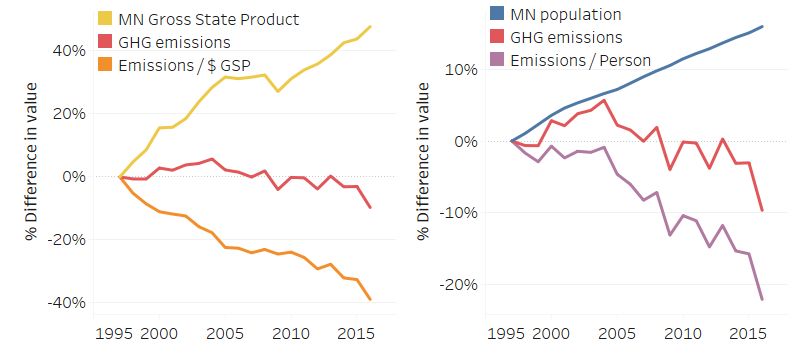
Legislative charge
Minn. Stat. § 216H.02 Greenhouse gas emissions control.
Subd. 1. Greenhouse gas emissions-reduction goal. It is the goal of the state to reduce statewide
greenhouse gas emissions across all sectors producing those emissions to a level at least 15 percent
below 2005 levels by 2015, to a level at least 30 percent below 2005 levels by 2025, and to a level at
least 80 percent below 2005 levels by 2050. The levels shall be reviewed based on the climate change
action plan study.
Minn. Stat. § 216H.07 Emissions-reduction attainment; policy development process.
Subd. 3. Biennial report. (a) By January 15 of each odd-numbered year, the commissioners of commerce
and the Pollution Control Agency shall jointly report to the chairs and ranking minority members of the
legislative committees with primary policy jurisdiction over energy and environmental issues the most
recent and best available evidence identifying the level of reductions already achieved and the level
necessary to achieve the reductions timetable in section 216H.02. (b) The report must be in easily
understood nontechnical terms.

Authors                                                    Editing and graphic design
Anne Claflin                                               Editor: Ralph Pribble
Fawkes Steinwand                                           Graphic design: Paul Andre, Anne Claflin
                                                           Administrative: Barb Olafson
Contributors/acknowledgements
Peter Ciborowski                                           Estimated cost of preparing this
Christopher Davis (Department of Commerce)                 report (as required by Minn. Stat. § 3.197)
Michelle Gransee (Department of Commerce)
Marcus Grubbs (Department of Administration)
                                                            Total staff time: 160 hrs.    $5,660
Laura Millberg
                                                            Production/duplication        $20
Katie Pratt (Environmental Quality Board)
Steve Rakow (Department of Commerce)                        Total                         $5,680
Amanda Jarrett Smith
                                                           The MPCA is reducing printing and mailing costs
                                                           by using the Internet to distribute reports and
                                                           information to wider audience. Visit
                                                           www.pca.state.mn.us for more information.
                                                           MPCA reports are printed on 100% post-
                                                           consumer recycled content paper
                                                           manufactured without chlorine or chlorine
                                                           derivatives.

Minnesota Pollution Control Agency
520 Lafayette Road North | Saint Paul, MN 55155-4194 |
651-296-6300 | 800-657-3864 | Or use your preferred relay service. | Info.pca@state.mn.us
This report is available in alternative formats upon request, and online at www.pca.state.mn.us.
Document number: lraq-2sy19
Contents
Summary: Report to the Legislature ...................................................................................................2
Introduction ......................................................................................................................................3
   Greenhouse gas emissions in Minnesota ......................................................................................................... 3
Tracking Minnesota’s emission reduction progress .............................................................................4
   Missing our first milestone: 2015 emissions .................................................................................................... 5
   Changing economy, changing emissions .......................................................................................................... 6
   Greenhouse gas emission intensity................................................................................................................ 10
Moving forward: What else are we doing?........................................................................................11
   Reducing state government emissions .......................................................................................................... 11
   Participating in national and international climate change initiatives........................................................... 11
   Greening up our energy generation ............................................................................................................... 12
   Paving the way for cleaner transportation..................................................................................................... 13
   Developing policies that encourage us to adapt to a changing climate......................................................... 14
The takeaway ..................................................................................................................................15
Appendix: Methodology...................................................................................................................16

2019 Greenhouse Gas Legislative Report • January 2019 • lraq-2sy19                                               Minnesota Pollution Control Agency
                                                                                                                Minnesota Department of Commerce
                                                                          1
Summary: Report to the Legislature
The primary driver behind Minnesota’s rapidly changing climate is the emissions of greenhouse gases
(GHGs). This report summarizes what we know about the role of GHGs in Minnesota and what the
Minnesota Pollution Control Agency (MPCA), Department of Commerce, and other state agencies are
doing to track and reduce GHG emissions, comply with relevant state and federal laws, and prepare for
the coming impacts of a changing climate.
Key points:
• While Minnesota’s overall GHG emissions declined 12% relative to 2005 levels, we missed the
Next Generation Energy Act’s goal of a 15% emissions reduction by 2015.
• Emissions from electricity used by Minnesotans are down by about 29% since 2005. This means
the electricity generation sector has met the Act’s 2015 goal, and has nearly reached the 2025
emissions reduction goal. Moreover, Minnesota’s utilities have committed to additional coal
plant closures that will further reduce GHG emissions from this sector in the future.
• Transportation is now the largest source of GHG emissions in Minnesota. This sector will require
ongoing, focused effort to reduce emissions to the levels necessary to meet statutory goals.
• Growth in our forests contributed to the sequestration of carbon and reduced total GHG
emissions. If this growth can be sustained over long periods of time, Minnesota’s forest
resources can help us achieve our emission reduction goals.
• Agricultural nutrient management is the largest source of nitrous oxide (N2O) emissions, but
many best management practices that protect water quality from nutrients and sediment also
can help reduce GHG emissions.
2019 Greenhouse Gas Legislative Report • January 2019 • lraq-2sy19 Minnesota Pollution Control Agency
Minnesota Department of Commerce
2Introduction
According to the Minnesota Climatology Office, our state’s climate is
changing rapidly, and these changes – driven largely by human Between 2005 and 2016, total
activities that cause emissions of greenhouse gases – are affecting our GHG emissions in Minnesota
health, well-being, ways of life, and natural resources. State agencies fell by 12%. We did not meet
our 2015 reduction goal of
are working to protect Minnesotans facing these challenges, and are
15%.
helping to lead and shape the national conversation about the impacts
of climate change and ways we can adapt.
Tracking GHG emissions and understanding their sources are important ways the MPCA helps
Minnesotans navigate our changing climate. Collecting and analyzing data helps identify opportunities
and challenges for reducing GHG emissions. The Minnesota Department of Commerce protects the
public interest by ensuring that energy resources are reliable, affordable, and increasingly clean.
Understanding Minnesota’s GHG emissions and emission sources helps Minnesotans mitigate and adapt
to a changing climate.
To learn more about climate change in Minnesota and what the MPCA is doing to track GHG emissions,
visit our website at https://www.pca.state.mn.us/air/climate-change-minnesota.
Greenhouse gas emissions in Minnesota
GHGs are gases that warm the atmosphere and surface of the planet. Human activity has been
increasing the amount of GHGs in the atmosphere, leading to changes in the earth’s climate. The
primary GHGs are carbon dioxide (CO2), nitrous oxide (N2O), methane (CH4), sulfur hexafluoride (SF6),
and two classes of compounds called hydrofluorocarbons (HFCs) and perfluorocarbons (PFCs). Figure 1
shows the relative proportions of GHG emissions in Minnesota in 2016.
CO2 is the most abundant GHG and has had the largest effect on our climate. Other GHGs are emitted in
smaller amounts, but can trap heat more effectively than CO2, and some stay in our atmosphere for a
very long time. “Global warming potential” is a relative measure of how much heat a GHG traps in the
atmosphere. Because we need to compare these different emissions and pollutants, we use the effect of
CO2 on our climate as a common reference. In this report, emissions are reported as “CO2-equivalent”
(CO2-e) tons, meaning emissions are stated in terms that reflect their global warming potential.
2019 Greenhouse Gas Legislative Report • January 2019 • lraq-2sy19 Minnesota Pollution Control Agency
Minnesota Department of Commerce
3GHGs come from a variety of sources:
• Fossil fuel combustion is responsible for Figure 1. GHG emissions in Minnesota in 2016
most CO2 emissions in the U.S. The (CO2-equivalents)
majority of fossil fuels used today are
for generating electricity and fueling
vehicles.
• Animal agriculture is responsible for the
majority of methane (CH4) emissions.
Methane also is emitted from the
anaerobic decomposition of organic
material.
• Over 50% percent of nitrous oxide (N2O)
emissions are caused by agricultural
HFCs
nutrient management practices.
• The majority of HFC emissions are from PFCs, SF6
their use in refrigerants, such as in air
conditioning, in both vehicles and
buildings.
• PFCs and SF6 only account for a small portion of GHG emissions and are emitted as the result of
technical applications, like semiconductor manufacturing and electricity transmission.
In Minnesota, CO2 emissions account for about 73% of total emissions, while methane and nitrous oxide
each account for about 13%.
Tracking Minnesota’s emission reduction progress
In 2007, the Legislature passed the Next Generation Energy Act (NGEA), which set interim and long-term
goals for the reduction of GHG emissions in the state. Figure 2 shows the goals, establishing a 2050
reduction of 80% below the 2005 baseline 1.
Figure 2. Next Generation Energy Act (2007) greenhouse gas emissions reduction goals. These goals are codified
in Minn. Stat. § 216H.02.
1Data revisions and changes in methodology can cause the baseline to change, but continuity is provided when making relative
year-to-year emissions comparisons.
2019 Greenhouse Gas Legislative Report • January 2019 • lraq-2sy19 Minnesota Pollution Control Agency
Minnesota Department of Commerce
4Missing our first milestone: 2015 emissions
Although mitigation actions have prevented an increase in GHG From 2005 to 2015, GHG
emissions, Minnesota did not reach the NGEA’s 2015 emissions emissions decreased by 5%.
reduction goal of 15% relative to the 2005 baseline. Across all sectors, Thus, Minnesota did not meet
GHG emissions fell by about 5% from 2005 to 2015; without actions the 2015 interim goal of a 15%
taken within the state, GHG emissions would have risen over that reduction.
time. This decrease was driven primarily by steep declines in GHG
emissions from electricity generation.
Table 1 shows Minnesota’s progress in reducing emissions from 2005 through 2016, while Figure 3
shows how emissions have changed during that time.
Table 1. Actual GHG emissions in Minnesota compared to GHG emissions reduction goals set in the Next
Generation Energy Act (2007), 2005-2016.
Actual emissions Actual percent decrease Emissions goal (million Goal percent decrease
Year
(million tons CO2-e) from baseline* tons CO2-e) from baseline*
2005 174.6 --- --- ---
2015 165.6 5 148.4 15
2016 154.2 12 --- ---
*Emissions reduction goals in the act are based on actual emissions in Minnesota for the year 2005. Thus, the baseline for
reduction is equal to 174.6 million tons CO2-e.
Figure 3. Minnesota’s GHG emissions, 1990-2016, compared to the 2015 and 2025 goals of the Next Generation
Energy Act. Although emissions are decreasing, we did not meet the 2015 emissions reduction goal.
2019 Greenhouse Gas Legislative Report • January 2019 • lraq-2sy19 Minnesota Pollution Control Agency
Minnesota Department of Commerce
5Changing economy, changing emissions
Despite missing the NGEA’s 2015 interim goal, Minnesota is making progress in many areas. This section
discusses GHG emissions changes across seven economic sectors in Minnesota: transportation,
electricity generation, agriculture and forestry, industrial, residential, commercial, and waste.
Figure 4 compares GHG emissions in each of the seven economic sectors from 2005 to 2016.
Figure 4. Minnesota’s GHG emissions from economic sectors, 2005-2016. The dark line in the column for the
electricity generation sector represents the division between emissions from electricity generated in Minnesota
(below the line) and emissions from imported electricity (above the line).
2019 Greenhouse Gas Legislative Report • January 2019 • lraq-2sy19 Minnesota Pollution Control Agency
Minnesota Department of Commerce
6Transportation
Emissions in the transportation sector include on-road The trend towards larger vehicles and
vehicles, airplanes and other aviation equipment, trains, more miles traveled is preventing more
leaky vehicle air conditioning units, and natural gas significant emissions reductions in the
transmission pipelines. More than 70% of emissions from transportation sector.
the transportation sector come from light-duty trucks, This sector will require ongoing, focused
passenger vehicles, and medium to heavy-duty trucks. effort to reduce emissions to the levels
GHG emissions from transportation have decreased by 8% necessary to meet our goals.
since 2005, and account for about one quarter of the GHG
emissions in Minnesota. In 2016, emissions from transportation and electricity generation were about
the same 2. Since emissions from electricity that is generated in Minnesota have been reduced over time
and are expected to decrease further, transportation is now the largest source of GHG emissions
generated within the borders of Minnesota.
Our personal choices have an impact on emissions. On-road vehicles are the largest category of
greenhouse gas emissions within the transportation sector. Federal regulations have resulted in newer
vehicle models that are generally more fuel-efficient and therefore produce fewer GHG emissions than
older, similar vehicles. However, at the same time Minnesotans are choosing to drive larger, less-
efficient and more-polluting vehicles instead of smaller, more-efficient cars. Minnesotans are also
driving more miles in those larger vehicles. While federal fuel efficiency standards are putting downward
pressure on vehicle GHG emissions, the trend towards larger vehicles and more miles traveled is
preventing more significant emissions reductions in this sector. The increased emissions from driving
larger vehicles more miles offset reductions otherwise achieved by newer, fuel-efficient vehicles.
The state can support greater GHG reductions from transportation while ensuring that Minnesotans
have access to varied transportation options. State government is doing its part by using hybrid or fully
electric vehicles and supporting community actions to use alternative transportation. Read more in the
“Moving forward” section about what we are doing to help meet the NGEA goals.
Electricity generation
GHG emissions from electricity generation are mostly the result of fuel
In 2016, GHG emissions combustion used to generate electricity consumed by Minnesotans,
from electricity generation including electricity generated outside of Minnesota. Other sources
were about 29% lower than include methane from coal storage and hydroelectric reservoirs, CO2
in 2005. from flue-gas desulfurization, and SF6 from electricity transmission and
distribution.
Historically, the electricity sector has been the largest source of GHG emissions in Minnesota; in 2016,
however, emissions from electricity generation and transportation were about the same2. Emissions
from the electricity sector have declined 29% since 2005. The decrease is largely due to reductions in the
amount of coal burned to generate electricity and increased use of renewable energy.
2Comparisons between sectors depend on the categories and boundaries chosen and on the methods used to estimate
emissions. See the appendix for further discussion of methods.
2019 Greenhouse Gas Legislative Report • January 2019 • lraq-2sy19 Minnesota Pollution Control Agency
Minnesota Department of Commerce
7Our total GHG emissions from electricity generation include emissions from electricity generated
outside of our state borders, but which we use here. We can also look at just the GHG emissions from
electricity generated at facilities within the state. Emissions from in-state generation fell 24% from 2005
to 2016. The amount of electricity that we generate in Minnesota increased at a faster rate than the
total amount of electricity Minnesotans consume, which reduces the amount we estimate as imported.
In reality, electricity freely flows across boundaries; we created an accounting framework, based on
available data, which takes responsibility for emissions from in-state facilities and in-state consumption
of electricity generated elsewhere. In Minnesota and surrounding states, however, coal is being
replaced by renewable wind and solar energy, along with natural gas. Recent decisions in utilities’
integrated resource plans will reduce GHG emissions from this sector further.
Agriculture and forestry
Emissions sources in the agriculture and land use sector
include livestock, animal feedlots, manure, fertilizer, crop Growing Minnesota forests are
cultivation practices, anaerobic decomposition of organic contributing to significant carbon
sequestration. If we can sustain stand
material, and related fuel combustion of off-road
growth, our forest resources can help us
implements like tractors and combines. Carbon also is reach our emissions reduction goals.
sequestered in forest regrowth, which is captured in the
emissions from this sector.
Compared to the 2005 baseline, emissions from the agriculture and forestry sector have decreased
about 12%, but emissions have been highly variable between 2005 and 2016. The largest source of N2O
emissions is nutrient management, which includes fertilizer use, nitrogen fixation, mineralization, and
runoff. N2O emissions from crop agriculture increased by about 12% from 2005 to 2016.
We can achieve reductions from this sector by improving best management practices, as many BMPs for
nutrient use and sedimentation also act to decrease GHG emissions. Some of the more promising
practices for reducing GHGs from agriculture include improved efficiency of nitrogen use (through
optimized fertilizer application rates, timing, and placement), conservation cover, riparian buffers and
related vegetative filter strips and field borders, and cover crops.
Animal agriculture is the largest source of methane emissions, specifically from manure management
and cattle digestion. Methane emissions from animal agriculture increased by about 8% from 2005 to
2016. Our lakes, rivers, and reservoirs are another large source of methane emissions, from the
breakdown of biological materials in sediments.
Carbon is sequestered in our forests as they grow. Although there is not a stable or predictable trend,
the carbon stored in Minnesota’s forests between 2005 and 2016 increased, which then offset GHG
emissions from other agricultural activities.
Industrial
Emissions sources in the industrial sector include fuel combustion, taconite processing, petroleum
refining, magnesium casting, lead recycling, peat mining, industrial wastewater treatment, solvent use,
and the manufacture of steel, glass, insulating foam, and semiconductors.
Since 2005, emissions from this sector have increased by about 3 million tons CO2-e; in 2016, emissions
were about 17% above the baseline.
2019 Greenhouse Gas Legislative Report • January 2019 • lraq-2sy19 Minnesota Pollution Control Agency
Minnesota Department of Commerce
8There has been an overall increase in energy used in the industrial sector since 2005, but industrial
energy use has decreased from its peak in 2014. Within the total energy trends, coal use has continued
to decline steadily. Natural gas use has increased since 2005, but has remained relatively stable since
2010, peaking in 2014.
CO2-e emissions data for individual sources with MPCA air permits are available on our website, at
https://www.pca.state.mn.us/air/permitted-facility-air-emissions-data.
Residential
Emissions sources in this sector include fuel combustion for heating and in-home appliances, like water
heaters or clothes dryers, and from other sources, including fertilizer use, product use, food additives,
and refrigerant leakage from air conditioners and refrigerators. Emissions from electricity use are all
included in the electricity generation sector rather than divided between consumers in each sector.
Since 2005, emissions from the residential sector have increased by about 0.9 million tons CO2-e; in
2016, emissions were about 11% above the 2005 baseline.
Carbon is also stored in wood construction materials for periods long enough that carbon is effectively
removed from the atmosphere, reducing total emissions.
Commercial
Emissions sources in this sector include fuel combustion, solvent use, and medical N2O emissions.
Institutional emissions are counted in this sector, as well. Commercial-sector emissions have shown an
increase of just 1% above the 2005 baseline in Minnesota.
Waste
Emissions sources in the waste sector include energy use in waste processing, incinerator fuels and
waste incineration, and methane from landfill gas and wastewater treatment. Carbon is also stored, or
sequestered from the atmosphere, as wood waste in demolition and construction landfills, which offsets
emissions.
Compared to the 2005 baseline, GHG emissions from waste have decreased by about 6%. This is a
change from 2014, when waste emissions were greater than they were in 2005.
The MPCA has been working to address methane emissions as the administrator of the state’s closed
landfill program.
2019 Greenhouse Gas Legislative Report • January 2019 • lraq-2sy19 Minnesota Pollution Control Agency
Minnesota Department of Commerce
9Greenhouse gas emission intensity
Employment in Minnesota’s clean As Minnesota’s economy and population grow, our GHG
energy sector grew faster than total emissions have declined, which shows that we can support
state employment between 2000 healthy communities and ecosystems, as well as a strong
and 2014. economy. These trends indicate we can continue to curb GHG
In 2017, there were about 59,000 emissions, while still growing and thriving.
clean energy jobs – over 2% of our
Measuring the amount of GHG emissions compared to other
entire 2017 workforce.
economic trends is one way to understand how GHG emissions
relate to our economy. Trends show that Minnesota has begun to
disconnect our economic growth from our GHG emissions. Minnesota’s gross state product has grown
since 1997, while GHG emissions have remained relatively flat. What this means is that our state
economy can grow without increasing GHG emissions. In fact, Minnesota’s experience shows that strong
economic growth occurs at the same time that we are reducing GHG emissions. Figure 5a shows this
relationship.
Minnesota’s experience shows that we can grow our population while reducing our per capita GHG
emissions. While the population in Minnesota is increasing, and is projected to continue increasing,
there is a net decrease in how much each individual on average is emitting. Figure 5b shows this
relationship.
Figure 5a (left). Minnesota’s GHG emissions per dollar gross state product (GSP), 1997-2016.
Figure 5b (right). Minnesota’s GHG emissions, per capita, 1997-2016.
2019 Greenhouse Gas Legislative Report • January 2019 • lraq-2sy19 Minnesota Pollution Control Agency
Minnesota Department of Commerce
10Moving forward: What else are we doing?
Here are some ways that the MPCA and the Minnesota Department of Commerce are working with
other state agencies, Minnesota businesses, and other state and national partners to further reduce
GHG emissions in Minnesota.
Reducing state government emissions
The Office of Enterprise Sustainability is providing leadership
to all state agencies in efforts to curb GHG emissions. So far,
these efforts, including expanding the use of EVs and
installation of solar panels, have reduced state government
emissions by about 17% from 2005 to 2017.
These efforts were initiated by Governor Mark Dayton’s
Executive Order 17-12, which directs state agencies to reduce
waste, conserve energy, and save money. One of the
objectives of the executive order was to reduce GHG
emissions created during day-to-day enterprise operations.
State agencies came together to identify reduction strategies, including reducing fuel consumption in
state vehicles, reducing energy consumption in buildings, and implementing existing renewable energy
policies.
Due to these efforts, state government is over halfway to the order’s goal of 30% reduction by 2025,
with half of the decrease coming from electricity savings, reduced square footage of workspaces, and
on-site renewable energy generation across state agency offices. Future initiatives include transitioning
many light-duty fleet vehicles to electric, exploring the use of more biofuels in medium- and heavy-duty
vehicles, implementing a building retro-commissioning program to conserve energy, and installing solar
panels at state office and workspace locations.
For more information about how state government has reduced GHGs, check out the Office of
Enterprise Sustainability’s 2017 report, at
https://mn.gov/admin/assets/2018%20annual%20report_web_tcm36-355173.pdf.
Participating in national and international climate change initiatives
Minnesota is a member of various national and international coalitions working to reduce GHG
emissions and move forward with actions to mitigate climate change. In 2015, Minnesota joined the
Under2 Coalition, an international group comprising over 200 state, regional, and national governments
committed to keeping global temperature increases to under 2 degrees Celsius. The coalition aims to
find pathways for “deep decarbonization,” innovative policy solutions, and systems to improve
emissions reporting and policy development. More information can be found at
https://www.under2coalition.org/.
In 2017, Minnesota also joined the U.S. Climate Alliance, a bipartisan group of state governors
committed to reducing GHG emissions consistent with the goals of the United Nations Paris Agreement.
As a member of the alliance, Minnesota agrees to implement policies that advance the goals of the Paris
Agreement, track and report progress to the global community, and accelerate new and existing policies
to reduce carbon pollution. More information can be found at https://www.usclimatealliance.org/.
2019 Greenhouse Gas Legislative Report • January 2019 • lraq-2sy19 Minnesota Pollution Control Agency
Minnesota Department of Commerce
11Most recently, in September 2018, Minnesota joined the Powering Past Coal Alliance, an international
group of state, regional, and national governments, businesses, and organizations dedicated to
advancing the transition of power generation away from coal. Members of this alliance believe that
moving away from coal power generation is necessary to promote clean air, healthy communities,
sustainable economic growth, and a safe climate. As a part of this alliance, Minnesota is committed to
work with our utility partners to move towards a future of renewable energy generation and to reduce
our reliance on coal. More information can be found at https://poweringpastcoal.org/.
Greening up our energy generation
Minnesota has made great progress toward a clean energy future by substantially reducing GHG
emissions from electricity generation. Local utilities continue to close coal plants and replace that power
generation with a mix of renewables backed by natural gas. Minnesota’s work on clean energy shows
we can reduce GHG emissions cost-effectively while our economy continues to grow.
The electricity generation sector’s steep reductions in
GHG emissions in Minnesota have resulted from
policies to reduce demand for electricity and shift
generation to cleaner energy sources. These policies
worked in tandem with market forces that make
many renewable resources more cost-effective than
coal facilities. Efficiency projects are often the most
cost-effective way to reduce GHG emissions from
electricity generation, so they were the first area
where Minnesota focused reduction efforts, requiring
utilities to invest in energy efficiency for homes and
businesses. Utilities have taken advantage of market developments as well: technology improvements
and federal tax policies that have lowered the cost of wind and solar energy development, the
continued low price of natural gas, and electricity consumers’ growing preference for “green” energy.
Over the past two decades, Minnesota adopted several requirements for electricity generation and
renewable energy:
• In 2001, the Legislature allowed utilities to charge customers for the cost of air pollution-
reduction projects. This law has encouraged utilities to replace coal generation with gas and
wind.
• In 2007, the Legislature adopted the state Renewable Energy Standard (RES) that created
renewable energy requirements for all utilities operating in Minnesota. By 2025, the RES
requires that a weighted 27% of all retail electricity sales in Minnesota come from renewable
energy sources. Minnesota’s utilities are on track to meet this requirement.
• Also in 2007, the state implemented electric utility requirements to reduce 1.5% of retail sales
through programs that target the users of electricity, building on previous successful efficiency
programs.
• In 2013, the Legislature adopted a solar energy standard for the state’s investor-owned utilities
that requires that, by the end of 2020, at least 1.5% of total retail sales are generated by solar
energy.
2019 Greenhouse Gas Legislative Report • January 2019 • lraq-2sy19 Minnesota Pollution Control Agency
Minnesota Department of Commerce
12Additionally, several electricity generating facilities, especially those powered by coal, have either
recently been retired or are planned to be retired soon. The planned retirements are listed in Table 2.
Table 2. Planned in-state electricity generating unit retirements for Minnesota utilities.
Facility Fuel type Size Retirement date
Minnesota Power
Boswell Energy Center 1 Coal 67 MW 2018
Boswell Energy Center 2 Coal 67 MW 2018
Taconite Harbor Energy Center unit 2 Coal 76 MW 2020
Taconite Harbor Energy Center unit 3 Coal 83 MW 2020
Silver Bay Power: 2 units Coal 130 MW 2021
Otter Tail Power Company
Hoot Lake Combustion Turbine units Coal 141 MW 2020
Great River Energy
Stanton Station (North Dakota) Coal 187 MW 2018
Xcel Energy
Benson Power Biomass Plant Biomass 55 MW 2018
Sherburne County 1 Coal 680 MW 2026
Sherburne County 2 Coal 682 MW 2023
Paving the way for cleaner transportation
Minnesota state agencies, local governments, non-profits, and
electric utilities are working to accelerate electric vehicle (EV)
adoption in Minnesota by educating Minnesotans about the
benefits of EVs and leading and supporting initiatives to build out
EV charging infrastructure across the state. The state’s ongoing
transition away from coal to renewable energy is amplifying the
benefits of EVs, which can take advantage of GHG emission
reductions in the power sector. Special electricity rates for EV
owners can encourage Minnesotans to charge their EVs at night,
which provides benefits to the power grid.
Minnesota is receiving $47 million under the national Volkswagen settlement, and is targeting 15% (the
maximum allowed by the settlement) of our Phase I funds to begin building a statewide network of EV
charging stations. This will help expand the reach of EVs and reduce barriers to their adoption. More
information about how Minnesota is using VW settlement funds can be found at
www.pca.state.mn.us/vw.
In addition to promoting electrification, the MPCA serves as an advisor and technical resource for a wide
range of other transportation planning and funding efforts across the state. Transportation planning can
2019 Greenhouse Gas Legislative Report • January 2019 • lraq-2sy19 Minnesota Pollution Control Agency
Minnesota Department of Commerce
13have a big impact on vehicle emissions by promoting investment in infrastructure that supports
alternative modes of transportation, like public transit, walking, and biking. We work with partners to
encourage land-use planning that provides opportunities for people to live within walking or biking
distance of the places they need to get to every day, and to promote the use of public transit.
Developing policies that encourage us to adapt to a changing climate
Many Minnesota state agency programs and policies relating
to climate change focus on reducing GHG emissions. Adapting
to a changing climate, on the other hand, involves developing
and implementing strategies, initiatives, and measures to
help us prepare for and address the impacts of climate
change.
In its 2017 report, “Adapting to Climate Change in
Minnesota,” the Interagency Climate Adaptation Team
recommended six priority action steps where state
government could be of most help:
1. Build greater resilience to extreme precipitation.
2. Identify opportunities to strengthen the health and resilience of vulnerable populations to
climate effects through cooperation with local governments.
3. Increase focus on preserving natural and restored ecosystems and habitat to increase resilience
of wildlife and native plants.
4. Strengthen agricultural water-management efforts to increase resilience to climate change
impacts.
5. Increase focus on managing climate impacts in cities, towns, and other population centers.
6. Strengthen our climate information infrastructure to support adaptation practices.
The MPCA is implementing several of the above recommendations throughout our work. In 2018, we
adopted a new cross-agency strategic goal focusing on climate adaptation efforts, and we are creating
an information dashboard to display our climate adaptation data. We also are working with community
partners to incorporate resilience into planning and infrastructure, identify and reduce risks for climate-
vulnerable populations, and implement adaptation best practices. To learn more about the MPCA’s
climate adaptation efforts, visit https://www.pca.state.mn.us/air/adapting-changing-climate.
The Minnesota Department of Health is working with the MCPA and other state agencies to deal with
the effects of climate change on human health. The goal of the Minnesota Climate and Health Program
is to help us understand the impacts of climate change, and to educate local public health resources and
the public about potential health risks. More information on MDH’s Minnesota Climate and Health
Program can be found at http://www.health.state.mn.us/divs/climatechange/.
2019 Greenhouse Gas Legislative Report • January 2019 • lraq-2sy19 Minnesota Pollution Control Agency
Minnesota Department of Commerce
14The takeaway
Minnesota has made important progress in reducing GHG emissions, but there is more work to be done
to achieve the goals of the Next Generation Energy Act. Significant GHG reductions from the electricity
generation sector have driven overall emission trends downward since 2005, aided by smaller
improvements in some sectors. These changes show that clean energy laws and programs can and do
reduce GHG emissions, but we need to accelerate the pace of progress.
Emissions from Minnesota’s electricity generation sector will continue to decrease, as renewable
sources account for greater amounts of the energy produced and used here. In order to achieve our
GHG emissions reduction goals, however, we will need to further reduce emissions from what is now
our largest source of in-state emissions, transportation. Supporting and promoting the use of EVs,
supporting the use of cleaner transportation fuels (such as biofuels), encouraging the use of public and
multimodal transportation, and mindful transportation planning are crucial elements in decreasing
GHGs from transportation.
Minnesota has been and will remain a leader in GHG emission trends, but without continued support
and additional effort, we are not likely to achieve the goals of the Next Generation Energy Act.
2019 Greenhouse Gas Legislative Report • January 2019 • lraq-2sy19 Minnesota Pollution Control Agency
Minnesota Department of Commerce
15Appendix: Methodology
Greenhouse gas emission inventory
A technical support document published in 2012 with the emissions report for 1970-2008 provides a
more detailed discussion on the calculation methodology and is available at
https://www.pca.state.mn.us/air/greenhouse-gas-emissions-minnesota-0.
Only emissions that occur within the geographical borders of the state are estimated, with two
exceptions – net imports of electricity into the state to meet Minnesota demand and emissions from the
combustion of aviation fuel purchased in Minnesota, but not necessarily combusted within Minnesota
air space.
GHG inventory protocols require that evaluation of state-level GHG emissions take into account
photosynthetically-removed CO2 stored in biomass in forests, landfills, and structures. Carbon storage
and emissions from forest soils and agricultural soils are tracked separately from the emissions
inventory because it is difficult to estimate specific sources within the larger estimate of carbon flux.
Storage of carbon in forest regrowth is incorporated into the agriculture and forestry sector using a
discounted storage term of 25 years. Long-term storage of carbon in residential structures and
demolition and construction landfills is included in statewide GHG emission totals because it is more
certain that the materials will remain as carbon stores for a long time.
Emissions are estimated for all years from 1970 to 2016, though presented here in an abbreviated
timeline. With a few exceptions, the methods used to develop these estimates are derived from the
following sources:
• US Environmental Protection Agency (2018) Inventory of US greenhouse gas emissions and
sinks: 1990-2016.
• California Air Resources Board, California Climate Action Registry, International Council for Local
Environmental Initiatives, Local Governments for Sustainability, and The Climate Registry (2010)
Local government operations protocol for the quantification and reporting of greenhouse gas
emissions inventories, version 1.1.
• Intergovernmental Panel on Climate Change (2006) IPCC guidelines for national greenhouse gas
inventories. Vol. 1-4.
• Radian Corporation (1996) Methane emissions from the natural gas industry. Volumes 1-15.
Prepared for the US Environmental Protection Agency and the Gas Research Institute.
• The Climate Registry (2008) General reporting protocol, version 1.1.
• Minnesota Pollution Control Agency (January 2012) Greenhouse gas emissions in Minnesota:
1970 – 2008.
Updates to methodology and data sources
Except for changes within the agriculture and forestry sector, the methods used to develop the emission
estimates are largely unchanged from previous reports. The methodological changes made since the last
report were made to improve estimation of total emissions. To assure consistency, these changes were
applied to all prior inventory years, when possible, including the baseline year of 2005. Revised data
used as inputs for estimation were updated when available.
Significant changes were made to estimates of emissions from agriculture and forestry. The methods
used to estimate N2O from agricultural soils were updated to include present scientific understanding
2019 Greenhouse Gas Legislative Report • January 2019 • lraq-2sy19 Minnesota Pollution Control Agency
Minnesota Department of Commerce
16and inventory practice based on an inventory framework from the IPCC (2006). New or revised N2O
emission sources include: dry deposition, crop residues from cultivated acres and grasslands,
mineralization on cropland and grassland, and asymbiotic nitrogen fixation. The emission factor for
pastured histosols was also updated.
Emissions of CO2 from cultivation and pasturing of histosols were recalculated using state-level
information provided by the EPA.
Sources of methane were added to the agriculture and forestry sector to account for the production of
methane in lakes, rivers, streams, and reservoirs.
Forest regrowth was added as a source of carbon sequestration. Given the many unknowns about the
future of our forests, we estimate a higher probability that carbon stored in the forest will remain there
for about 25 years. We have adjusted our inventory estimates to account for that understanding.
Prior to the 2017 Biennial Greenhouse Gas Emissions report, emissions from the transportation sector
had been estimated using fuel sales, with the emissions allocated to different modes of transportation
using vehicle population, vehicle miles traveled, fuel efficiency, and other fleet statistics. The EPA has
developed and improved their motor vehicle emissions simulator (MOVES) to estimate greenhouse gas
emissions as well as criteria air pollutants. This model was used to estimate Minnesota’s transportation
GHG emissions beginning in the last report and covers 2005-2016. The MOVES model uses the same
types of fleet statistics, but estimates energy and fuel consumption as model outputs.
Uncertainty of estimates
The MPCA developed its GHG Emission Inventory system with the following in mind: the long record of
emissions covering periods of years to decades; a consistent time series of estimates; best international
and US practices; high level of data disaggregation; and timeliness. Reflecting these principles, this GHG
inventory is:
Complete: This inventory accounts for and reports on Minnesota GHG emission sources and activities
within the chosen inventory boundary, as described in the MPCA’s GHG Inventory Technical Support
Document. Not all emissions and sinks are included in the statewide total. In some cases, methods
have not been developed or data do not exist to support an estimate.
Consistent: The MPCA uses consistent methodologies to allow for meaningful comparisons of
emissions over time. Changes to the methods are documented and reported.
Transparent: The MPCA administers the production of the GHG inventory to address all relevant
issues in a factual and coherent manner, and to maintain a clear audit trail. Relevant assumptions are
disclosed with appropriate references to the accounting and calculation methodologies and data
sources used.
Accurate: The MPCA administers the GHG inventory to ensure that the quantification of GHG
emissions is systematically neither over nor under actual emissions, and as far as the MPCA can
judge, uncertainties are reduced as far as practicable.
With this report, the MPCA is providing a qualitative discussion of the uncertainty of emission estimates.
Uncertainties around the precision and accuracy of estimates arise and the acknowledgement of
uncertainty is not intended to invalidate the estimates. The uncertainties in the reported greenhouse
gas estimates are reduced as far as is practical. In future inventories, the MPCA may provide quantitative
uncertainty analysis.
2019 Greenhouse Gas Legislative Report • January 2019 • lraq-2sy19 Minnesota Pollution Control Agency
Minnesota Department of Commerce
17This report summarizes GHG emissions by economic sectors, meaning that emissions estimates are the
sum of emissions from activities within the sector. Many methodologies and data sources are used to
estimate emissions from each activity within a sector. Some of the methods for generating the estimates
are very detailed and are the result of site-specific measurements for both activity and emissions, while
some are based entirely on the use of a model with only general data to characterize the source of
emissions.
As a result, it is not accurate to assign a single quality rating to the entire economic sector estimate at
this time. Within each sector, the confidence in data quality can vary. Generally, the more regulated
activities have high-quality activity and emission data.
On the whole, fossil fuel use and emissions are very well understood, especially when aggregated to
state totals. For example, the quantity of natural gas used in the state leaves little uncertainty, but there
is some uncertainty in distributing its use among sectors. Fossil fuel combustion from stationary sources,
such as power plants, creates about 50% of our GHG emissions. These emissions are estimated using
highly reliable methods, like continuous emissions monitors in place for other regulatory reporting
requirements, by mass balance calculations, or by factor calculation from fuel consumption.
All transportation emissions account for about 25% of our GHG emissions. Emissions from on-road
transportation are estimated using the MOVES model, which depends on vehicle population data and
vehicle miles traveled, rather than fuel data. There is some uncertainty from data inputs and from the
underlying equations and assumptions of the model.
The MPCA has undertaken improvement projects which reduce uncertainties to the extent that is
practical and where data allows. Comparisons can be made across time because of the consistent
revision of the inventory. Conclusions about reaching Minnesota’s GHG reduction goals can be drawn
from the inventory when its limits are understood.
2019 Greenhouse Gas Legislative Report • January 2019 • lraq-2sy19 Minnesota Pollution Control Agency
Minnesota Department of Commerce
18You can also read