GROUND DEFORMATION AND ITS CAUSES IN ABBOTTABAD CITY, PAKISTAN FROM SENTINEL-1A DATA AND MT-INSAR - MDPI

 
CONTINUE READING
GROUND DEFORMATION AND ITS CAUSES IN ABBOTTABAD CITY, PAKISTAN FROM SENTINEL-1A DATA AND MT-INSAR - MDPI
remote sensing
Article
Ground Deformation and Its Causes in Abbottabad
City, Pakistan from Sentinel-1A Data and MT-InSAR
Naeem Shahzad * , Xiaoli Ding , Songbo Wu             and Hongyu Liang
 Department of Land Surveying and Geo-Informatics, The Hong Kong Polytechnic University, Hong Kong,
 China; xl.ding@polyu.edu.hk (X.D.); sabriwu@outlook.com (S.W.); allenhongyu.liang@connect.polyu.hk (H.L.)
 * Correspondence: naeem.shahzad@connect.polyu.hk
                                                                                                   
 Received: 24 September 2020; Accepted: 15 October 2020; Published: 20 October 2020                

 Abstract: Land subsidence, as one of the engineering geological problems in the world, is generally
 caused by compression of unconsolidated strata due to natural or anthropogenic activities.
 We employed interferometric point target analysis (IPTA) as a multi-temporal interferometric
 synthetic aperture radar (MT-InSAR) technique on ascending and descending Sentinel-1A the terrain
 observation with progressive scans SAR (TOPSAR) images acquired between January 2015 and
 December 2018 to analyze the spatio-temporal distribution and cause of subsidence in Abbottabad City
 of Pakistan. The line of sight (LOS) average deformation velocities along ascending and descending
 orbits were decomposed into vertical velocity fields and compared with geological data, ground water
 pumping schemes, and precipitation data. The decomposed and averaged vertical velocity results
 showed significant subsidence in most of the urban areas in the city. The most severe subsidence
 was observed close to old Karakorum highway, where the subsidence rate varied up to −6.5 cm/year.
 The subsidence bowl profiles along W–E and S–N transects showed a relationship with the locations
 of some water pumping stations. The monitored LOS time series histories along an ascending orbit
 showed a close correlation with the rainfall during the investigation period. Comparative analysis of
 this uneven prominent subsidence with geological and precipitation data reflected that the subsidence
 in the Abbottabad city was mainly related to anthropogenic activities, overexploitation of water,
 and consolidation of soil layer. The study represents the first ever evidence of land subsidence and its
 causes in the region that will support the local government as well as decision and policy makers for
 better planning to overcome problems of overflowing drains, sewage system, littered roads/streets,
 and sinking land in the city.

 Keywords: land subsidence; Sentinel-1A; multi-temporal InSAR; interferometric point target analysis
 (IPTA); Pakistan

1. Introduction
      Ground subsidence is a common geological hazard worldwide, which is mostly linked to natural
(e.g., earthquake, compression of soil, and change in aquifer) or anthropogenic (e.g., underground
construction activities, groundwater extraction) processes [1]. Subsidence at the local scale specifically
in urban areas can be a serious threat to the economy, such as damages to infrastructures (buildings,
roads, bridges, canals), and to viable and sustainable economic development [2]. Changes in geological
settings, mining, construction of subways, and ground water extraction are among the main causes of
land subsidence in most cities in the world [3,4]. Other than these causes, the subsidence showed high
correlation with changing geology in terms of strata lithology, formation, and structure [5]. The areas
with unconsolidated surficial deposits generally form the most prolific aquifers and subsidence in such
areas is mostly due to the extensive extraction of ground water [6]. This extensive use of underground
water resources and increase in the pumping stations due to increase in the population is causing

Remote Sens. 2020, 12, 3442; doi:10.3390/rs12203442                      www.mdpi.com/journal/remotesensing
GROUND DEFORMATION AND ITS CAUSES IN ABBOTTABAD CITY, PAKISTAN FROM SENTINEL-1A DATA AND MT-INSAR - MDPI
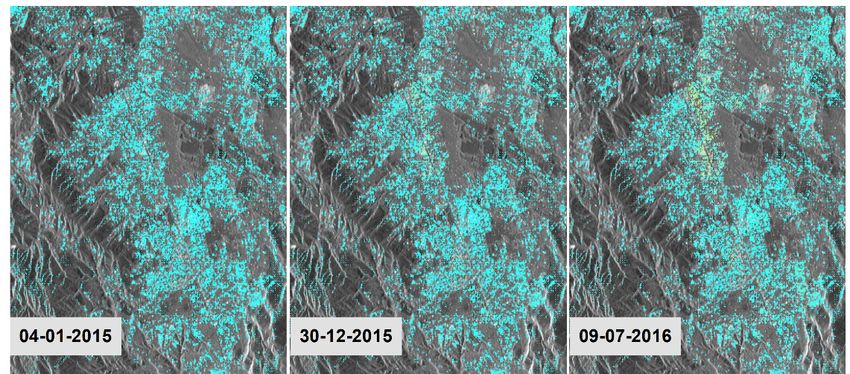
Remote Sens. 2020, 12, 3442                                                                          2 of 18

significant loss in small and large aquifers in most parts of the world, creating problems related to
drainage system, flooding during rainy seasons, and the functioning of structures such as canals [6–8].
Numerous events of localized land subsidence have been reported in the past couple of decades
in various parts of the world, especially due to extensive groundwater discharge [9]. Variation in
seasonal timings and change in precipitation patterns have disturbed the runoff and recharge in aquifer
systems. This change in runoff and recharge is also linked with increased demand of water in cities,
which is one of the hurdles in achieving the sustainable goals of any country. Therefore, the demand
for spatio-temporal monitoring of this hazard has increased to take necessary measures and to achieve
sustainable goals.
      A number of traditional studies describing different methodologies and effective solutions
are available in the literature to monitor and study the ground deformation/subsidence processes.
These traditional point-based monitoring studies include the following: global positioning system
(GPS), leveling, and geological monitoring methods [10,11]. These methods lack in providing enough
samples for ground-based subsidence monitoring and are very difficult to use in areas surrounded by
steep slopes. Interferometric synthetic aperture radar (InSAR) has been proven to be the most efficient
method, widely used to monitor land subsidence all over the world [1,12,13]. This technique is capable
of detecting small changes at an unprecedented level of spatial details (centimeter to millimeter) in
land surface elevation at low cast under ideal conditions [14–16]. So far, the problem incorporated in
InSAR approach due to change in scatterer with time is mainly due to atmospheric and ionospheric
disturbances, which lead to the introduction of decorrelation in the signal [17,18]. This is a common
problem associated with the repeat-pass InSAR technique as a result of discrepancies that arise between
two related SAR signals over the same location at different epochs [19]. Many advanced InSAR
techniques has been developed to overcome this limitation by using multi-temporal InSAR (MT-InSAR)
techniques [20]. MT-InSAR techniques work on the principal of simultaneously processing multi-SAR
images to accurately extract deformation information. Zhang et al. [21] and Crosetto et al. [22] presented
very good reviews of these techniques. These MT-InSAR techniques have been widely applied to
monitor ground subsidence on different SAR data sets, concluding that these techniques have the
ability to overcome (at least partially) the weaknesses of the conventional InSAR approach [23–25].
      In this study, a step-wise and iterative technique, i.e., interferometric point target analysis (IPTA)
multi-baseline technique of persistent scatterer interferometry (PSI), is implemented on Sentinel -1
(4 season × 4 years) data acquired between January 2015 and December 2018 along ascending and
descending orbits in order to investigate, highlight, and understand the causes of subsidence and its
temporal evolution in response to increasing demand of ground water and changes in soil properties
in Abbottabad city of Pakistan (Figure 1). Based on iterative process for calculating high-precision
deformation on point scatterers (PSs), IPTA has been proven to hold strong power in monitoring
deformation using a large number of SAR images [26–29]. The study area has various types of natural
conditions surrounded by mountains and an attractive place thanks to its natural beauty. This is why
the city has experienced rapid urban growth in the past decade. In order to facilitate this increased
urban settlement in the area, the Government of Pakistan (GoP) has implemented various drinking
water supply schemes/projects [30]. As a result of contamination in the surface water and upper level of
groundwater, the need to drill deeper borewells has increased with the increased number of tubewells
in the area. This study is the first ever attempt to examine the spatio-temporal deformation patterns
and their causes in the region. The results obtained by implementing the advanced InSAR technique
will support the local government for better decision making and planning to overcome problems such
as overflowing drains, disturbed sewerage system, sinking land, and littered roads and streets.
GROUND DEFORMATION AND ITS CAUSES IN ABBOTTABAD CITY, PAKISTAN FROM SENTINEL-1A DATA AND MT-INSAR - MDPI
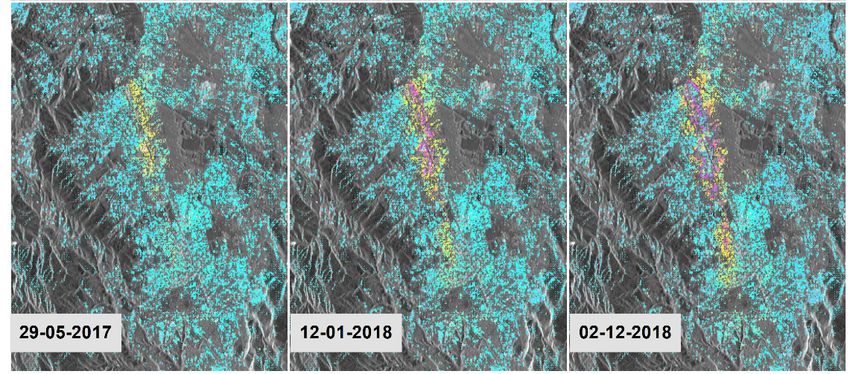
Remote Sens. 2020, 12, 3442                                                                                                 3 of 18
Remote Sens. 2020, 12, x FOR PEER REVIEW                                                                                   3 of 19

                                           Figure
                                           Figure 1. Location map
                                                  1. Location map of
                                                                  of study
                                                                     study area.
                                                                           area.

2. Study Area and Datasets
2.1. Characteristics of the Study Area
      Abbottabad, formerly known as “the city of the maple trees” and a famous hill station in the lower
      Abbottabad,
Himalayas,              formerly known
               is the administrative             as “the city
                                             headquarters        of the
                                                             of the       maple
                                                                     Hazara       trees”ofand
                                                                               division          a famous
                                                                                             Khyber           hill station
                                                                                                       Pakhtunkhwa            in the
                                                                                                                         province
lower  Himalayas,        is the  administrative      headquarters      of  the Hazara    division    of
of Pakistan (Figure 1). Geographically, the study area extends from 34◦ 140 47.0000 N, 73◦ 110 56.0000 EKhyber    Pakhtunkhwa
province
to           of Pakistan
   34◦ 70 46.00   00 N, 73◦ 16(Figure
                                 0 56.0000 1).   Geographically,
                                             E. Endowed               the and
                                                             with scenic     study   areamountains
                                                                                  green      extends from
                                                                                                        located 34°14′47.00″
                                                                                                                   about 125 km   N,
73°11′56.00″     E  to 34°    7′46.00″    N,  73°16′56.00″   E.  Endowed       with  scenic
north of Islamabad (Capital of Pakistan) through Karakoram Highway, the area is a very famous  and  green   mountains       located
about
hill   125 kilometers
     resort   in summer.      north
                                 With of Islamabad
                                          an altitude(Capital
                                                         of 1260of  mPakistan)
                                                                       (4120 ft),through
                                                                                    the areaKarakoram
                                                                                                also serves  Highway,
                                                                                                               as a gatewaythe area
                                                                                                                                  to
is a very  famous      hill   resort   in  summer.   With    an  altitude   of  1260  m  (4120   ft), the
Galliyat regions in west. Geologically, the central part of the study area consists of Quaternary Alluvialarea   also  serves   as a
gateway to Galliyat
(unconsolidated               regions
                       surficial          in west.
                                     deposits        Geologically,
                                                 of sand    and gravel) the surrounded
                                                                             central part by  of Hazara,
                                                                                                  the study     area consists
                                                                                                             Tanawal,    Lokhart, of
Quaternary
and              Alluvial (unconsolidated
      Hazira formation         [31].                surficial deposits of sand and gravel) surrounded by Hazara,
Tanawal,
      Being the part of Orash Valley, rainfall[31].
            Lokhart,      and   Hazira      formation     occurs throughout the year with the highest rainfall during
      Being    the   part   of  Orash
monsoon seasons, making the region prone toValley,  rainfall  occurs     throughout
                                                                  flashflood.          the year
                                                                                  According         withrecent
                                                                                                to the     the highest
                                                                                                                  census rainfall
                                                                                                                             report,
during
the      monsoon
     population         seasons,
                     of the   city hasmaking     the region
                                          increased   at a rateprone     to flashflood.
                                                                 of 3.61%/year             According
                                                                                   from 1998     to 2017to    the recent census
                                                                                                          [32].
report, the population of the city has increased at a rate of 3.61%/year from 1998 to 2017 [32].
2.2. Datasets
2.2. Datasets
      The selection of Sentinel-1 data was based on the fact that this mission provides long-term,
timelyThe
        dataselection     of Sentinel-1
                 with satisfactory            data wasfree
                                           resolution      based    on the
                                                              of cost.       fact data
                                                                          These    that are
                                                                                         thisamission
                                                                                                reliable provides
                                                                                                          source tolong-term,
                                                                                                                        study the
timely data with
deformation      and itssatisfactory
                            evolution over resolution   free ofcan
                                                time, which       cost.   Thesetodata
                                                                     be used            arefuture
                                                                                  predict     a reliable  source
                                                                                                     scenarios      to Therefore,
                                                                                                                 [33].  study the
deformation      and   its  evolution     over  time,  which    can  be  used  to predict   future
in this study, we used Sentinel -1A data along the ascending and descending orbits (incident angle   scenarios   [33]. Therefore,
in this study,
~33.81  and 33.15 we degrees,
                       used Sentinel        -1A data along
                                     respectively).            the ascending
                                                       Interferometric      wideand   descending
                                                                                   swath    (IW) singleorbits
                                                                                                          look (incident
                                                                                                                 complexangle (SLC)~
33.81  and   33.15    degrees,      respectively).   Interferometric       wide   swath    (IW)
the terrain observation with progressive scans SAR (TOPSAR) images, operating in C-band (~5.6 cm  single  look   complex      (SLC)
the terrain observation
wavelength),      acquired from with progressive
                                        European Space  scansAgency
                                                               SAR (TOPSAR)         images, operating
                                                                         (ESA) distributed                  in C-bandprogram,
                                                                                                under Copernicus          (~5.6 cm
wavelength),
were  used to map acquired      from distribution
                        the spatial     European Space       Agency
                                                        of ground        (ESA) distributed
                                                                     deformation     and timeunderseries Copernicus
                                                                                                         deformationprogram,
                                                                                                                          patterns.
were   used     to  map      the   spatial    distribution   of   ground     deformation      and
The 84 acquired ascending orbit images (track 100) were between 4 January 2015 and 2 December 2018,  time  series   deformation
patterns. The 84 acquired ascending orbit images (track 100) were between 4 January 2015 and 2
December 2018, and the 82 descending orbit images (track 107) were between 17 January 2015 and 27
December 2018. All the acquired images were preprocessed for orbital refinement using precise orbit
GROUND DEFORMATION AND ITS CAUSES IN ABBOTTABAD CITY, PAKISTAN FROM SENTINEL-1A DATA AND MT-INSAR - MDPI
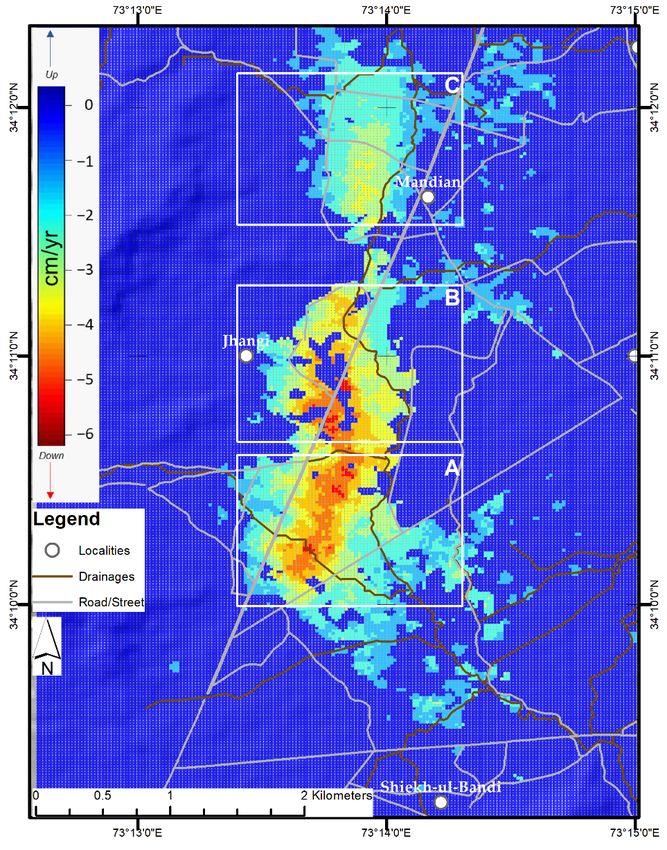
Remote Sens. 2020, 12, 3442                                                                             4 of 18

and the 82 descending orbit images (track 107) were between 17 January 2015 and 27 December 2018.
All the acquired images were preprocessed for orbital refinement using precise orbit determination
(POD) files released by ESA. Moreover, 1 arc second (~30 m) shuttle radar topography mission (SRTM)
digital elevation model (DEM) was downloaded from United States geological survey (USGS) and used
to simulate and remove topographic phases. For processing and co-registration, the acquired images
on 8 August 2017 for ascending data and 13 December 2016 for descending data were selected as
master images. This selection of the master image was based on the joint correlation method presented
in [34].
     Google Earth was used to interpret and analyze the data at different stages. Advanced InSAR
processing software, GAMMA-2017® , developed by GAMMA Remote Sensing AG, Switzerland,
was used to define and implement the IPTA processing chain for the mapping of ground subsidence in
the area.

3. Methodology
    The use of the InSAR technique for ground deformation mapping and monitoring depends on
a number of factors, including operational band (C, X, or L), type of incident surface, topography
and geography of the area, number of acquisitions, and temporal intervals between repeated images.
These factors play an important role in achieving high efficiency of the InSAR technique [35]. To achieve
such efficiency of the results, the IPTA approach was employed to analyze and monitor the ground
subsidence in the area. Although the phase model used for point target analysis is the same as that
used in conventional interferometry, its step-wise iterative process is very helpful in refining the
parameters and to separate the deformation phase from all non-deformation phase components of
Equation (1) [36].
                                 ϕki,unw = ϕki,de f o + ϕki,noise + ϕki,topo + ϕki,atm                 (1)

where ϕki,unw is the unwapped phase of the ith point target in the kth interferogram and is expressed as the
sum of ϕki,atm (atmospheric path delay phase), ϕki,noise (decorrelation phase noise), ϕki,topo (phase residues
due to the digital elevation model (DEM) inaccuracies), and actual ϕki,de f o deformation phase.
     The term ϕki,topo is the phase attributed to the errors introduced by DEM as elaborated in Equation (2)
by [35],
                                                               k
                                                                       
                                             k
                                                        4π Bi,perp 
                                           ϕi,topo =                 ∆ε                            (2)
                                                          λ RSinθ 

where ∆ε is the height error (m) increment; Bki,perp is the perpendicular baseline; and λ, R, and θ are
the radar wavelength, slant range, and look angle, respectively.
     The term ϕki,de f o is actual deformation phase that can be further divided into linear and non-linear
components [35]. The linear component of this deformation phase is presented in Equation (3).

                                                                 4π k
                                                                          
                                          ϕki,de f o−lin =          t vi                                   (3)
                                                                  λ

where tk is the time difference of the kth interferogram and vi is the linear deformation velocity at
the ith point target. Moreover, the efficiency of the models and data storage capacities is one of the
main concerns of the researchers working with limited computer resources. The vector format data
structure used in this approach has provided a great benefit to generate results even with the limited
system resources. The overall processing sequence adopted for IPTA processing in this research study
is presented in Figure 2.
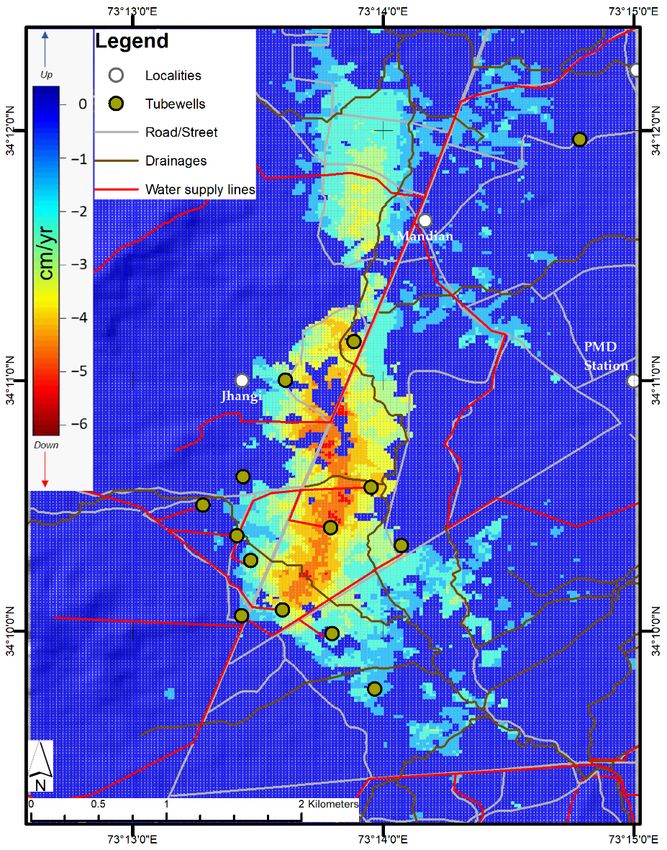
GROUND DEFORMATION AND ITS CAUSES IN ABBOTTABAD CITY, PAKISTAN FROM SENTINEL-1A DATA AND MT-INSAR - MDPI
Remote
RemoteSens. 2020,12,
       Sens.2020, 12,3442
                      x FOR PEER REVIEW                                                                                            55 of
                                                                                                                                      of 18
                                                                                                                                         19
Remote Sens. 2020, 12, x FOR PEER REVIEW                                                                                           5 of 19

                    Figure 2. Processing workflow for interferometric point target analysis (IPTA).
                    Figure
                    Figure 2.
                           2. Processing
                              Processing workflow
                                         workflow for
                                                  for interferometric
                                                      interferometric point
                                                                      point target
                                                                            target analysis (IPTA).
                                                                                   analysis (IPTA).
3.1. Generation of Point List and Differential Interferograms
3.1. Generation of
3.1. Generation     of Point
                       Point List
                              List and
                                     and Differential
                                            Differential Interferograms
                                                           Interferograms
       In order to minimize the contribution of non-deformation phases elaborated in Equation (1),
      In
      In order
generationorderof to  minimize
                  atogood
                       minimize
                             quality  the
                                      theof contribution
                                             contribution      of
                                                               of non-deformation
                                             points is important.   non-deformation
                                                                          In this study, the phases
                                                                                             phases     elaborated
                                                                                                        elaborated
                                                                                                 strategy    used toin in  Equationgood
                                                                                                                          Equation
                                                                                                                       determine        (1),
                                                                                                                                        (1),
generation
generation
quality point  of  a  good
              of atargets,    quality
                     good quality          of  points
                                         of points is
                               i.e., persistent         is  important.
                                                        important.
                                                      scatterers              In
                                                                         In this
                                                                      (PS),       this
                                                                              wasstudy,  study,
                                                                                    basedthe     the   strategy
                                                                                              onstrategy          used    to
                                                                                                             used to determine
                                                                                                  two approaches,              determine
                                                                                                                                     good
                                                                                                                           i.e., temporal
good
quality quality
variabilitypoint
              andpoint    targets,
                   targets,
                     spectral i.e.,   i.e., persistent
                                      persistent
                                 diversity                scatterers
                                                [36].scatterers
                                                       The   ratio (PS), (PS),
                                                                      of the was was
                                                                               mean    based
                                                                                    based    onontwo
                                                                                        (temporal  two     approaches,
                                                                                                         approaches,
                                                                                                      average              i.e., temporal
                                                                                                                          i.e.,  temporal
                                                                                                                 of backscattering)       to
variability
variability
the standard  and    spectral
              anddeviation      diversity
                     spectral diversity        [36].
                                 (sigma) of[36].       The   ratio
                                                      The ratiofrom
                                                  backscatter        of  the  mean
                                                                     of thethis
                                                                              mean     (temporal
                                                                                       (temporal
                                                                                  average           average
                                                                                                    average
                                                                                              was used          of
                                                                                                            for of backscattering)
                                                                                                                    backscattering)
                                                                                                                temporal                 to
                                                                                                                                         to
                                                                                                                               variability.
the
For standard
the  standard     deviation an
                  deviation
      spectral diversity,        (sigma)
                                (sigma)
                                      averagedof backscatter
                                              of backscatter
                                                    coherencefrom  from     this
                                                                     fromthiseach average
                                                                                  average
                                                                                    SLC was   wasused
                                                                                             was    usedtofor
                                                                                                   used     for temporal
                                                                                                                temporal
                                                                                                              select           variability.
                                                                                                                      the PSvariability.
                                                                                                                                 with low
For
For  spectral
     spectral
spectral        diversity,
                 diversity,
            diversity.       anan
                         In order averaged
                                       to havecoherence
                                     averaged       coherence
                                                  enough       from
                                                              PS,      each
                                                                    from
                                                                   the        SLC
                                                                             each
                                                                         point      was used
                                                                                    SLC
                                                                                 targets   was   to select
                                                                                                 used
                                                                                           of both           the PS with
                                                                                                      thetoapproaches
                                                                                                             select  the werelowwith
                                                                                                                            PS     spectral
                                                                                                                                       low
                                                                                                                                   merged
diversity.
spectral     In order
together.diversity.      to have
             For theseInpoints,
                            order theenough
                                      to have    PS,
                                            SLC enoughthe
                                                 values arepoint    targets
                                                             PS,extracted
                                                                   the pointandof  both
                                                                                 targets  the approaches
                                                                                           of both
                                                                                     written        thevector
                                                                                                in the         were
                                                                                                           approaches merged
                                                                                                                 data SLC were    together.
                                                                                                                                   merged
                                                                                                                                point data
For  these
together.
stack.       points,
             For
         Taking  these  the
                   advantage SLCofvalues
                          points,    the
                                       theSLC   are  extracted
                                                 values
                                             long-term     are      and written
                                                           timeextracted
                                                                   series      andthe
                                                                            data,     in maximum
                                                                                          the vector
                                                                                     written             data SLC
                                                                                               in thescene
                                                                                                         vector  datapoint
                                                                                                                        SLC of
                                                                                                                difference     data
                                                                                                                               point stack.
                                                                                                                                      data
                                                                                                                                  three  (3)
Taking
stack.    advantage
scenesTaking             of the
                  advantagewith
          was considered          long-term
                                   of the        time   series
                                            long-term time
                                          perpendicular          data,    the
                                                                  series data,
                                                               baseline        maximum
                                                                            checkthe          scene
                                                                                     of maximum
                                                                                         200 m andscenedifference   of  three
                                                                                                               difference
                                                                                                         temporal    baseline   (3) scenes
                                                                                                                              of three
                                                                                                                                  check(3)of
was
100 considered
scenesdays            with perpendicular
         wastoconsidered
                 generate       with perpendicular
                               interferometric     baseline     check
                                                                Basedofon
                                                       pairs.baseline        200
                                                                           check
                                                                               themofand 200temporal
                                                                                     baseline m chart     baseline
                                                                                                 and temporal       check
                                                                                                          (Figure 3),baseline
                                                                                                                         theseof 100
                                                                                                                                  PS days
                                                                                                                                  check  of
                                                                                                                                      were
to
100generate
      days tointerferometric
translated     togenerate
                     generate          pairs. Based
                              interferometric
                                    point-based          on the
                                                      pairs.
                                                       DEM,         baseline
                                                                Based
                                                                  leading      tochart
                                                                          on the         (Figure
                                                                                    baseline
                                                                                    calculating    3),the
                                                                                                 chart  these  PS were
                                                                                                          (Figure           translated
                                                                                                                    3), these
                                                                                                            point-based           PS wereto
                                                                                                                              differential
generate
translated  point-based
interferogram.               DEM,       leading    to calculating       the  point-based      differential
               to generate point-based DEM, leading to calculating the point-based differential               interferogram.
interferogram.

              Figure 3. Baseline
              Figure 3. Baseline vs.
                                 vs. time plots (left) ascending orbit data
                                                                       data (right)
                                                                             (right) descending
                                                                                     descending orbit
                                                                                                orbit data.
                                                                                                      data.
              Figure 3. Baseline vs. time plots (left) ascending orbit data (right) descending orbit data.
3.2. Interferometric Point Target Processing
 3.2. Interferometric Point Target Processing
       IPTA is basedPoint
3.2. Interferometric     on aTarget
                               2D linear   regression model, in which the phase difference between point
                                      Processing
       IPTA is based on a 2D linear regression model, in which the phase difference between point
targets is analyzed in the temporal domain. This 2D regression is based on the linear dependency of
       IPTA
 targets       is based in
           is analyzed   onthe
                             a 2D  linear regression
                                temporal   domain. Thismodel,   in which is
                                                           2D regression  the  phase
                                                                            based   ondifference
                                                                                       the linear between
                                                                                                   dependencypoint
                                                                                                                of
the topographic phase with the perpendicular baseline (Equation (2)) and the linear dependency of
targets   is analyzed
 the topographic        in the
                     phase      temporal
                             with          domain. Thisbaseline
                                   the perpendicular      2D regression  is based
                                                                  (Equation        on the linear dependency
                                                                             (2)) and              dependency ofof
the deformation phase with time (Equation (3)). This 2D linear regression was applied to generate
the
 the topographic
      deformationphasephasewith
                              withthe  perpendicular
                                    time                baseline
                                          (Equation (3)).  This 2D(Equation  (2)) and the
                                                                    linear regression   waslinear dependency
                                                                                              applied           of
                                                                                                      to generate
initial estimates of deformation phase, residual topography, and phase standard deviation. This phase
the  deformation
 initial estimates phase     with time phase,
                      of deformation      (Equation  (3)). This
                                                 residual       2D linearand
                                                            topography,    regression  was applied
                                                                               phase standard         to generate
                                                                                                  deviation.  This
initial
 phase estimates     of deformation
         standard deviation              phase,a residual
                                 represented               topography,
                                                 quality check   betweenand    phase standard
                                                                          the model               deviation.phase.
                                                                                      fit and differential    This
phase standard deviation represented a quality check between the model fit and differential phase.
GROUND DEFORMATION AND ITS CAUSES IN ABBOTTABAD CITY, PAKISTAN FROM SENTINEL-1A DATA AND MT-INSAR - MDPI
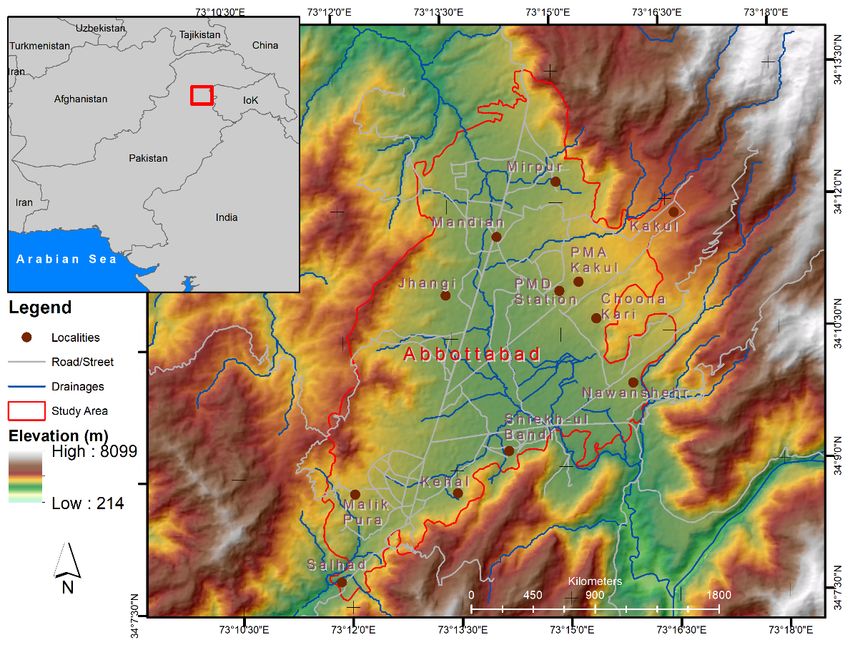
Remote Sens. 2020, 12, 3442                                                                         6 of 18

standard deviation represented a quality check between the model fit and differential phase. In addition
to these terms, the phase model also generated the linear regression phase residual, which was comprised
of phase variations related to atmospheric artifacts as well as non-linear deformation phase component
with decorrelation noise (Equation (4)).

                                     ϕki,res = ϕki,non−lin + ϕki,atm + ϕki,noise                       (4)

     The residual phase at this stage exhibited phase jumps related to unwrapping errors that were
removed iteratively using the minimum cost flow (MCF) algorithm [37]. Because atmospheric phase
screen (APS) and non-linear deformation phases are spatial low-pass signals, we applied the linear least
square spatial filtering method to the unwrapped residual phase in order to calculate the phase attributes
related to APS. The estimated APS is then subtracted from the point-based differential interferogram
stack for all of the PS candidates. As presented in Figure 2, this process was iterated several times to
generate improved quality estimates of the height correction, APS, and refined unwrapped differential
phase. More technical details on processing strategies using the IPTA framework can be found
in [36,38].

3.3. Deformation Rate and Time Series Retrieval
     The final deformation rate and deformation time series histories were retrieved for each point by
implementing the multi-baseline (mb) approach [39]. These final deformation histories and average
annual deformation rates corresponding to point information are converted to line of sight (LOS)
displacement and equiangular (EQA) projection for further analysis.

3.4. Decomposition of LOS Displacements into 2D Displacement Fields
    The mean LOS velocity fields against each PS, extracted from two different orbits, i.e., ascending
and descending, were decomposed into vertical and east–west components. Assuming the negligible
north–south movement [40], the vertical (dv ) and east–west (dh ) components were computed using
Equation (5) [41,42].
                                dasc              asc sinθasc
                                      !                       !      !
                                  los
                                             cosθ     cos∆α      d v
                                        =                                                           (5)
                                ddsc
                                  los
                                            cosθdsc sinθdsc      dh

where θasc and θdsc represent the incident angles of ascending and descending orbits, respectively,
and ∆α is the difference between headings of ascending and descending orbits.

3.5. Causal Factors of Deformation
     The cause of the subsidence is normally considered and interpreted as an individual/single factor,
but urban subsidence especially in areas surrounded by hills with variety of geological units may be
caused by the interaction of two or more factors together. This interaction between causal factors
is very clear and reported in many studies [43]. If changes in such casual factors are left unnoticed,
then the subsidence can lead to significant disaster in the area. Abbottabad, being one of the major
affected cities in the October 2005 earthquake, has attracted a number of researchers for several reasons.
One reason is its location in an intermountain basin with thick Quaternary deposits. Apart from the
number of causal factors of subsidence, we gathered data about natural and anthropogenic factors that
influence land subsidence. Geological layers (Figure 4) were extracted from the map of Geological
Survey of Pakistan (GSP) [44] and refined using the map published in [31].
GROUND DEFORMATION AND ITS CAUSES IN ABBOTTABAD CITY, PAKISTAN FROM SENTINEL-1A DATA AND MT-INSAR - MDPI
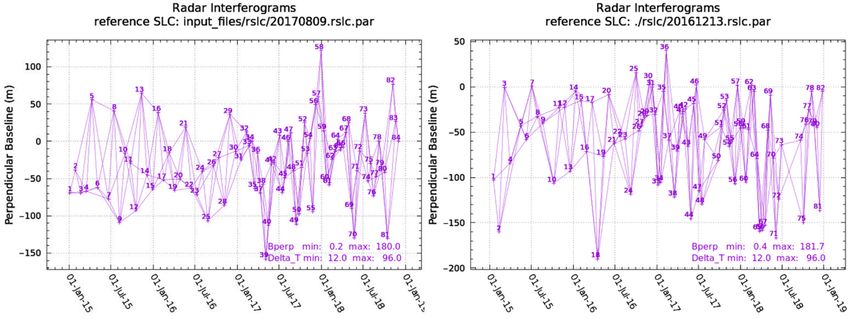
Remote Sens. 2020, 12, 3442                                                                                   7 of 18
Remote Sens. 2020, 12, x FOR PEER REVIEW                                                                     7 of 19

                                   Figure 4. Geological
                                             Geological map of the study area.

       Precipitation data were gathered from Kakul Station of Pakistan Meteorological Department
4. Results
(PMD) from the year 2015 to 2018. Moreover, information related to the increase in drinking water
       The criteria for the generation of interferometric pairs on the basis of multi-baseline can
supply schemes was collected from various reports [45–47] and compiled for the analysis. Because of
guarantee that all of the Sentinel 1A images are involved. These interferometric pairs were assessed
the unavailability of ground water discharge data at these water supply schemes, the analysis with
by applying a standard two-pass D-InSAR algorithm to generate differential interferograms. During
ground water discharge was done with the help of the implemented plans of water supply under such
D-InSAR processing, it was observed that the interferograms with relatively longer temporal
schemes. The pattern of subsidence and the locations of high subsidence zones were compared and
intervals showed the phase variations in some part of the study area. The phase variations could be
analyzed with these developments in the area.
related to topographic residuals and perpendicular baselines. Such phase variation cannot be
categorized
4. Results to a specific phase signal unless multiple D-InSAR products based on time series data are
analyzed. For this purpose, IPTA was employed in Abbottabad city and adjacent surrounding areas
       The criteria
to extract           for theinformation.
            deformation      generation of interferometric pairs on the basis of multi-baseline can guarantee
that all of the Sentinel 1A images are involved. These interferometric pairs were assessed by applying
a standard
4.1. Average two-pass
               SubsidenceD-InSAR
                            Rate Mapalgorithm to generate differential interferograms. During D-InSAR
processing, it was observed that the interferograms with relatively longer temporal intervals showed
       Figurevariations
the phase      5 shows the in average
                               some part velocities  in cm per
                                            of the study    area.year
                                                                   Thealong  LOS
                                                                         phase    directionscould
                                                                                variations     of both
                                                                                                     be ascending
                                                                                                         related to
(left) and  descending     (right)  data, derived   by  implementing    the IPTA  technique.
topographic residuals and perpendicular baselines. Such phase variation cannot be categorized  These    LOS resultsto
were    geocoded    in  WGS   84  coordinate   system   and  superimposed    onto  the shaded
a specific phase signal unless multiple D-InSAR products based on time series data are analyzed. relief map   of  the
study
For this area. Color IPTA
           purpose,    rampswasfrom   blue to red
                                   employed        represent the
                                               in Abbottabad      movement
                                                               city           of land
                                                                    and adjacent       along the areas
                                                                                   surrounding      LOS direction.
                                                                                                          to extract
The  negative   deformation
deformation information.         values  indicate the  movement    away   from the  sensor (i.e., subsidence)    and
positive deformation values are related to movement towards the sensor (i.e., uplift). Owing to lower
positive   values
4.1. Average        (FigureRate
               Subsidence     5), Map
                                  it can be assumed that there is no movement towards the sensor (i.e.,
uplift); therefore, the term “deformation” is represented as “subsidence” in this research paper. It can
       Figure 5 shows the average velocities in cm per year along LOS directions of both ascending (left)
be seen in Figure 5 that the results extracted from both orbits’ data exhibit similar spatial patterns.
and descending (right) data, derived by implementing the IPTA technique. These LOS results were
These similar patterns represent the presence of dominant vertical deformation and negligible
geocoded in WGS 84 coordinate system and superimposed onto the shaded relief map of the study area.
horizontal velocity [42].
Color ramps from blue to red represent the movement of land along the LOS direction. The negative
       The results of average vertical velocity obtained after decomposing LOS velocities of both orbits
are shown in Figure 6. It was observed in Figure 6 that the averaged vertical deformation (subsidence)
rate varies up to −6.5 centimeter (cm) per year in the area. Figure 6 also represents a prominent, un-
GROUND DEFORMATION AND ITS CAUSES IN ABBOTTABAD CITY, PAKISTAN FROM SENTINEL-1A DATA AND MT-INSAR - MDPI
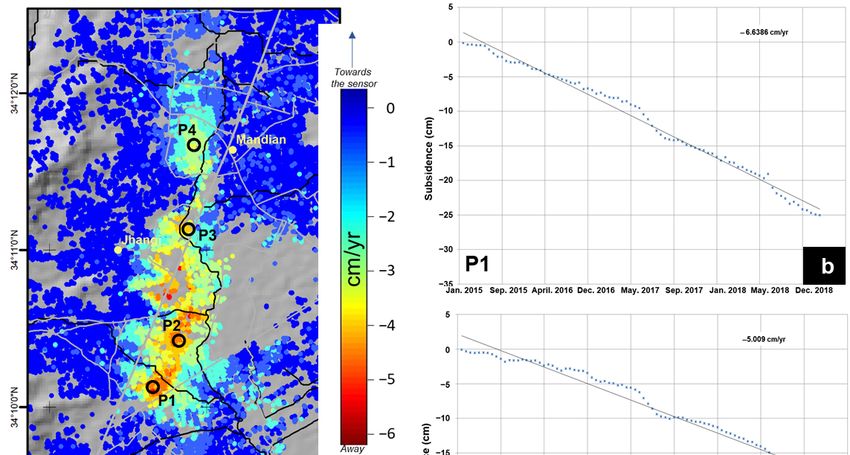
Remote Sens. 2020, 12, 3442                                                                                    8 of 18

deformation values indicate the movement away from the sensor (i.e., subsidence) and positive
deformation values are related to movement towards the sensor (i.e., uplift). Owing to lower positive
Remote Sens. 2020, 12, x FOR PEER REVIEW                                                             8 of 19
values (Figure 5), it can be assumed that there is no movement towards the sensor (i.e., uplift); therefore,
the term “deformation” is represented as “subsidence” in this research paper. It can be seen in Figure 5
even subsidence pattern and the most prominent pattern with values from −6.5 to −2 cm/year was
that the results extracted from both orbits’ data exhibit similar spatial patterns. These similar patterns
identified along the old Karakoram highway (locally known as road Nowshera-Abbottabad road,
represent the presence of dominant vertical deformation and negligible horizontal velocity [42].
N35), which is settled in the foothills of the Himalayas, including the cantonment area of the city.

       Figure
       Figure 5.
              5. Average
                 Average line
                         line of
                              of sight
                                 sight (LOS)
                                       (LOS) velocity
                                             velocity maps:
                                                      maps: (a)
                                                            (a) ascending
                                                                ascending and
                                                                          and (b)
                                                                              (b) descending
                                                                                  descending orbits’
                                                                                             orbits’ data.
                                                                                                     data.

      Moreover,
      The resultsFigure     6 also
                    of average     represents
                                 vertical       three
                                          velocity    main subsidence
                                                    obtained              regions, i.e.,
                                                              after decomposing      LOSA,velocities
                                                                                             B, and C.ofAboth
                                                                                                            andorbits
                                                                                                                B are
the regions    with high  population    density  and  exhibit higher  subsidence     rates, whereas
are shown in Figure 6. It was observed in Figure 6 that the averaged vertical deformation (subsidence)region  C  falls
into
rate the  medium
      varies   up to to lowcentimeter
                      −6.5    subsidence(cm)
                                           region
                                               perwith
                                                    yearainrelatively
                                                             the area.scattered
                                                                         Figure 6population.     The subsidence
                                                                                    also represents    a prominent,in
region   A  incorporates    residential  societies of Hassan   town,  Amir    alam   awan   town.
un-even subsidence pattern and the most prominent pattern with values from −6.5 to −2 cm/year was   The  subsidence
varies from
identified     −6.5the
             along  cm/year    to −0.5 cm/year
                        old Karakoram     highwayin this region.
                                                    (locally knownRegion   B lies
                                                                     as road      in Mir Alam Town and
                                                                               Nowshera-Abbottabad        road,Jhangi
                                                                                                                 N35),
area
which with   a higher
        is settled     centered
                   in the         value
                           foothills     of −6.5
                                     of the       cm/yearincluding
                                            Himalayas,     up to −1 cm/year     at the outer
                                                                     the cantonment           edges
                                                                                         area of      of the region.
                                                                                                  the city.
Region C is the northern part of the main city, and lies in Kaghan and Sir Syed Colony with relatively
higher altitudes than regions A and B. The subsidence rate varies between −3.0 and −1 cm per year in
this region.
GROUND DEFORMATION AND ITS CAUSES IN ABBOTTABAD CITY, PAKISTAN FROM SENTINEL-1A DATA AND MT-INSAR - MDPI
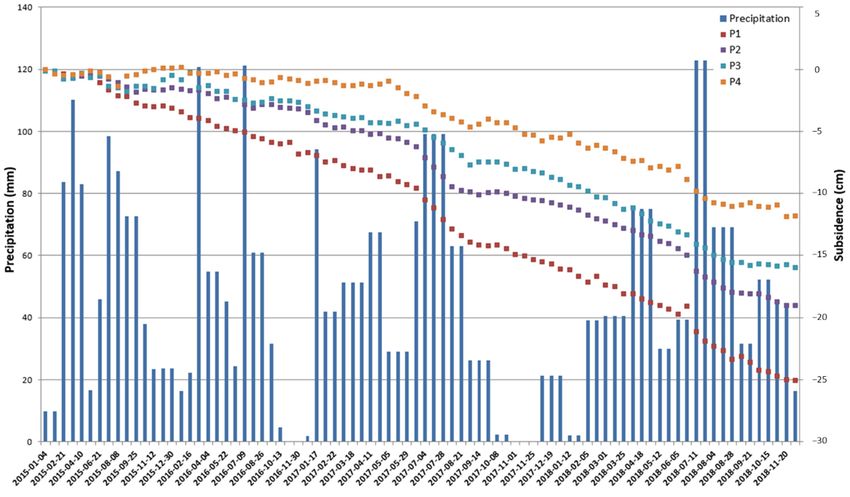
Remote Sens. 2020, 12, 3442                                                                               9 of 18
Remote Sens. 2020, 12, x FOR PEER REVIEW                                                                 9 of 19

      Figure 6.   Meanvertical
               6. Mean   verticalvelocity
                                  velocity map
                                          map in in cm/year.
                                                 cm/year. TheThe
                                                              red red color
                                                                  color     represents
                                                                        represents     downward
                                                                                   downward     movement
                                                                                            movement (i.e.,
      (i.e., subsidence).
      subsidence).

      Moreover,Time
4.2. Subsidence   Figure  6 also represents three main subsidence regions, i.e., A, B, and C. A and B are
                       Series
the regions with high population density and exhibit higher subsidence rates, whereas region C falls
      Themedium
into the   spatio-temporal    evolution region
                    to low subsidence    in the deformation    pattern
                                                 with a relatively      using population.
                                                                   scattered  ascending orbit
                                                                                            The data  at six (6)
                                                                                                subsidence    in
different  stages  overlaid   on  averaged   multi-looked  intensity   (MLI) image   in  RADAR
region A incorporates residential societies of Hassan town, Amir alam awan town. The subsidence   geometry    is
shown    in  Figure  7.  Analyzing    the  increasing  and   expanding    trend of   the  deformation
varies from −6.5 cm/year to −0.5 cm/year in this region. Region B lies in Mir Alam Town and Jhangi       in the
eastward/westward       and southward/westward
area with a higher centered                          directions,
                                 value of −6.5 cm/year   up to −1respectively,  four
                                                                   cm/year at the      typical
                                                                                   outer  edgesPSof(P1,
                                                                                                    the P2, P3,
                                                                                                        region.
and  P4) were  selected  for detailed  regional time series analysis  (Figure 8a–e). Time  series trends
Region C is the northern part of the main city, and lies in Kaghan and Sir Syed Colony with relatively    show
the  deformation
higher             evaluation
        altitudes than  regionsextracted
                                  A and B. using  ascendingrate
                                            The subsidence    datavaries
                                                                   and scattered  at different
                                                                         between −3.0   and −1 locations
                                                                                                cm per yearover
                                                                                                              in
the
thisdeforming
     region.    area. The locations of these points are shown in Figure 8a.

4.2. Subsidence Time Series
     The spatio-temporal evolution in the deformation pattern using ascending orbit data at six (6)
different stages overlaid on averaged multi-looked intensity (MLI) image in RADAR geometry is shown
in Figure 7. Analyzing the increasing and expanding trend of the deformation in the eastward/westward
and southward/westward directions, respectively, four typical PS (P1, P2, P3, and P4) were selected
for detailed regional time series analysis (Figure 8a–e). Time series trends show the deformation
GROUND DEFORMATION AND ITS CAUSES IN ABBOTTABAD CITY, PAKISTAN FROM SENTINEL-1A DATA AND MT-INSAR - MDPI
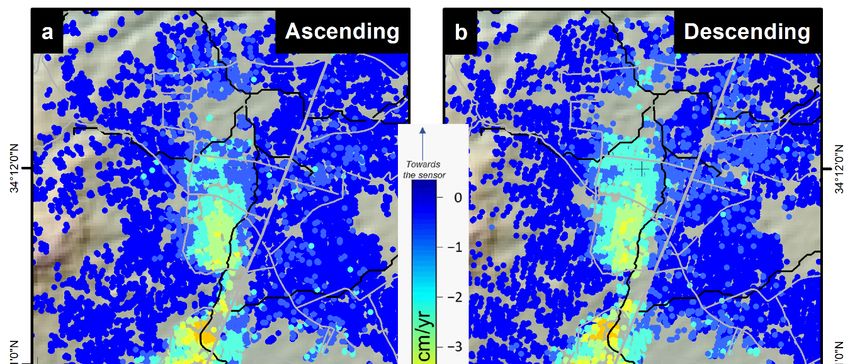
Remote Sens. 2020, 12, 3442                                                                                  10 of 18

evaluation extracted using ascending data and scattered at different locations over the deforming area.
The locations of these points are shown in Figure 8a.
     Based on LOS deformation obtained using ascending data, the temporal variations in the
subsidence values of P1 vary from 0 to −25 cm, with an average rate of −6.63 cm/year. P2, which lies
in the upper part of subsidence zone A, exhibits an average rate of −5 cm/year and the trend varies
from 0 to −18 cm. P3, which lies in the upper part of subsidence zone B, varies from 0 to −16 cm,
with an average rate of −4.3 cm/year. P4, which lies in northern part of study area and in the center of
subsidence zone C, shows lower values varying from 0 to −12 cm, with an average rate of −3 cm/year.
The temporal variations of these points are shown altogether in Figure 8b–e. These variations show
a non-linear trend in the subsidence. The variations in time series patterns show that deformation
slows down and is sustained for a certain period of time. One of the possible reasons for this variation
could be the seasonal changes in the underground water levels, particularly after the monsoon season
every Sens.
Remote year.2020, 12, x FOR PEER REVIEW                                                          10 of 19

      Figure
      Figure 7.
              7. SixSix
                      different  stages
                         different      of of
                                    stages cumulative   landland
                                               cumulative     subsidence   pattern
                                                                  subsidence        in RADAR
                                                                                pattern  in RADARgeometry. The
                                                                                                      geometry.
      background    image  is the averaged  intensity image  of the study area. One  color cycle corresponds
      The background image is the averaged intensity image of the study area. One color cycle corresponds    to
      10 cm/year
      to 10       displacement.
            cm/year  displacement.

     Based on LOS deformation obtained using ascending data, the temporal variations in the
subsidence values of P1 vary from 0 to −25 cm, with an average rate of −6.63 cm/year. P2, which lies
in the upper part of subsidence zone A, exhibits an average rate of −5 cm/year and the trend varies
from 0 to −18 cm. P3, which lies in the upper part of subsidence zone B, varies from 0 to −16 cm, with
an average rate of −4.3 cm/year. P4, which lies in northern part of study area and in the center of
subsidence zone C, shows lower values varying from 0 to −12 cm, with an average rate of −3 cm/year.
The temporal variations of these points are shown altogether in Figure 8b–e. These variations show
a non-linear trend in the subsidence. The variations in time series patterns show that deformation
slows down and is sustained for a certain period of time. One of the possible reasons for this variation
could be the seasonal changes in the underground water levels, particularly after the monsoon season
every year.
Remote Sens. 2020, 12, 3442                                                                                             11 of 18
 Remote Sens. 2020, 12, x FOR PEER REVIEW                                                                             11 of 19

       Figure8.8. Time
      Figure      Time series
                          seriesevaluation
                                 evaluationofofaveraged
                                                  averagedLOS  deformation
                                                             LOS           presented
                                                                 deformation         using
                                                                              presented    ascending
                                                                                        using        data:data:
                                                                                               ascending   (a)
       location  of PSs, (b) P1, (c) P2, (d) P3, and (e) P4.
      (a) location of PSs, (b) P1, (c) P2, (d) P3, and (e) P4.

5.5.Discussion
    Discussionand
               andAnalysis
                  Analysis
       Beingpart
     Being     partofofthethe  valley
                           valley   andand   foothills,
                                         foothills,       the exhibits
                                                     the city  city exhibits
                                                                         heavyheavy      flash floods.
                                                                                 flash floods.    SeveralSeveral
                                                                                                            drainage  drainage
                                                                                                                        systems
 systems
were        were introduced
      introduced      in the areaintothe
                                       moveareathetoflooded
                                                     move the     flooded
                                                              water    fromwater
                                                                              the cityfrom   thenearby
                                                                                        to the    city to river
                                                                                                           the nearby
                                                                                                                  channels river
                                                                                                                              via
 channels    via  Darkhan      Katha  into  Dor   River.  With   the  passage    of  time,  the  situation
Darkhan Katha into Dor River. With the passage of time, the situation of flooded and standing water in        of flooded    and
 standing
the          water in the
    city is becoming     more city is becoming
                                 severe,           more severe,
                                          which results             which the
                                                           in paralysing     results
                                                                                city in  paralysing
                                                                                      with              theespecially
                                                                                            traffic jams,    city with traffic
                                                                                                                          during
 jams, especially
rainfall seasons [48]. during    rainfall
                           To better       seasons [48].
                                       understand            To betterthe
                                                       this scenario,     understand
                                                                              subsidence  this  scenario,
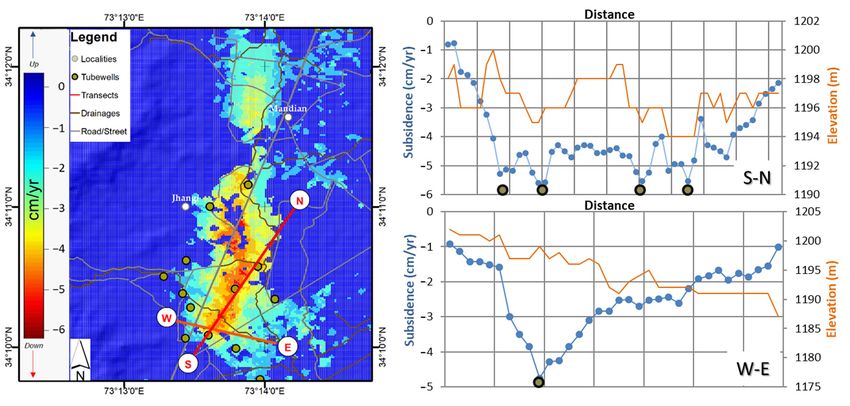
                                                                                             profiles   alongthetwosubsidence
                                                                                                                      transects,
 profiles
west       along
      to east  (W–E)twoandtransects,
                               south towest   to east
                                          north   (S–N),(W–E)
                                                          wereand     south to
                                                                 analyzed.        northobserved
                                                                               It was     (S–N), werethat analyzed.
                                                                                                           the magnitude It wasof
 observed     that  the   magnitude     of  LOS     subsidence    along    these   transects
LOS subsidence along these transects decreases in value while moving from W–E or S–N, keeping  decreases     in  value    while
                                                                                                                              the
 moving    from    W–E    or  S–N,  keeping    the  maximum      values   in  the  centers  of  the
maximum values in the centers of the transects and causing a bowl-shaped profile, particularly along transects   and   causing
 a bowl-shaped
the W–E transect,    profile,  particularly
                        and some               alonginthe
                                      major dips        theW–E    transect,profile
                                                            subsidence        and somealongmajor   dips transect
                                                                                              the S–N     in the subsidence
                                                                                                                     (Figure 9).
The comparison of these subsidence profiles with the actual ground elevation profileswith
 profile  along   the  S–N   transect  (Figure   9). The  comparison      of these  subsidence     profiles     canthe   actualin
                                                                                                                     be seen
 ground
Figure  9. elevation    profiles
           It is clear from        can 9bethat
                               Figure       seen   in Figure
                                                these          9. It is regions
                                                       bowl-shaped      clear from     Figure 9 that
                                                                                  of subsidence         these
                                                                                                    zones       bowl-shaped
                                                                                                            in this  part of the
 regions of subsidence zones in this part of the city are basically responsible for the standing water
Remote Sens. 2020, 12, 3442                                                                                       12 of 18

Remote Sens. 2020, 12, x FOR PEER REVIEW                                                                          12 of 19
city are basically responsible for the standing water during the rainfall season, limiting human activity;
navigation;
 during the and    severe
              rainfall    destruction
                       season,  limitingtohuman
                                           roads, streets,
                                                  activity;and buildings,and
                                                            navigation;   making  them
                                                                             severe      prone to to
                                                                                     destruction   seepage
                                                                                                     roads,
as well. and buildings, making them prone to seepage as well.
 streets,

                              Figure9.
                              Figure 9. Subsidence
                                        Subsidence profile
                                                   profile along
                                                           alongthe
                                                                 theS–N
                                                                    S–Nand
                                                                        andW–E
                                                                           W–Etransects.
                                                                               transects.

     In
      Ingeneral,
         general,most
                  most subsidence
                         subsidence areas
                                        areas inin Abbottabad
                                                   Abbottabad belong
                                                                  belong toto residential
                                                                               residential area
                                                                                            area and commercial area.
The
 The subsidence
      subsidence inin these
                       these areas
                              areas isis of
                                          of course
                                              course due
                                                       due to
                                                            to some
                                                                some underground
                                                                       underground activities
                                                                                          activities related
                                                                                                      related toto various
                                                                                                                    various
anthropogenic   (e.g., ground   water    withdrawal)     and  natural   (e.g., soil  consolidation)
 anthropogenic (e.g., ground water withdrawal) and natural (e.g., soil consolidation) processes.     processes.    In most
                                                                                                                         In
cases, the land
 most cases, thesubsidence    patternpattern
                 land subsidence         represents   an integrated
                                                 represents            effect of
                                                              an integrated       bothofofboth
                                                                                effect     theseoffactors.  In suchIncases,
                                                                                                   these factors.      such
the anthropogenic
 cases,              factors act
        the anthropogenic         as a speed
                              factors    act as up   tool forupthe
                                                  a speed          naturally
                                                                 tool for theoccurring
                                                                                 naturallyevents    suchevents
                                                                                             occurring     as subsidence
                                                                                                                   such as
and  degradation.   Because    of  the  increase   in  population    with   time,   this subsidence
 subsidence and degradation. Because of the increase in population with time, this subsidence and      and   degradation
can be relatedcan
 degradation    to the  increase
                   be related  tointhethe  demand
                                        increase      of the
                                                   in the     underground
                                                          demand                natural resources
                                                                     of the underground       natural (water   discharge).
                                                                                                        resources    (water
The  detailed relationships   of  land   subsidence     with  the  categorized    factors  are discussed
 discharge). The detailed relationships of land subsidence with the categorized factors are discussed        below.
below.
5.1. Soil Consolidation
5.1. Soil Consolidation soil is postulated as a primary driver of land subsidence in most of the major
     Unconsolidated
cities Unconsolidated
       and areas of the world
                           soil is[6]. Figure 4 as
                                   postulated    shows   that most
                                                     a primary       of the
                                                                 driver   of central  part of the in
                                                                              land subsidence      study
                                                                                                      mostarea
                                                                                                            of is
                                                                                                               thelocated
                                                                                                                    major
in  alluvial  sediments    with   grey  brown    shale  and  minor   limestone     in the west;
 cities and areas of the world [6]. Figure 4 shows that most of the central part of the study areadolomite,   dark   grey
                                                                                                                        is
shale,  light  grey medium    to  thick bedded    limestone   in the  south;   and  dolomite   limestone
 located in alluvial sediments with grey brown shale and minor limestone in the west; dolomite, dark       comprised   of
sandstone
 grey shale,  and  shale
                light    in the
                      grey       north [31].
                             medium           Figure
                                         to thick      10 shows
                                                    bedded        the relationship
                                                              limestone               between
                                                                           in the south;     andthese   geological
                                                                                                    dolomite        units
                                                                                                               limestone
and   averageof
 comprised      vertical subsidence
                  sandstone            rates.
                               and shale   in It
                                              thecan  be observed
                                                    north           in Figure
                                                           [31]. Figure  10 shows10 that
                                                                                      themost    of the subsidence
                                                                                          relationship               area
                                                                                                          between these
belongs    to unconsolidated     deposits  (alluvial   surfaces).
 geological units and average vertical subsidence rates. It can be observed in Figure 10 that most of
       Keeping in area
 the subsidence     viewbelongs
                          the importance     of unconsolidated
                                    to unconsolidated     depositsdeposits,
                                                                     (alluvialwhich     makes mattresses of aquifers,
                                                                                 surfaces).
the three-layered structure analysis as presented by [46] showed that the first layer is comprised of clay
and silt along the inter-beds of gravel, with a thickness of 30 to 40 m in the west and 70 to 80 m in the
central part of the subsidence area; the second layer majorly consists of gravel with a conspicuously
increased thickness of about 40 m in the center and southern part of the subsidence area; and the
third layer of the unconsolidated soil in the region is underlying bedrock, represented by shale in
the west and dolomite and limestone in the east. The thickness of the second layer increases while
moving in a westerly direction along the transect W–E, which follows exactly the western extent of
the subsidence region. This structural analysis showed a strong correlation with the overall extent
subsidence. Although most of the land subsidence occurred in alluvium deposits, the direct correlation
between this type of soil with subsidence may not be solely possible, but the direct correlation of this
type of geological unit with the existence of aquifer and its exploitation (changing the unconsolidated
Remote Sens. 2020, 12, 3442                                                                                          13 of 18

surface to consolidated surface) could provide a better understanding of the land subsidence process
in this populated part of the city.
Remote Sens. 2020, 12, x FOR PEER REVIEW                                                      13 of 19

                   Figure 10.
                   Figure 10. Relationship
                              Relationship between
                                           between geological
                                                   geological units
                                                              units and
                                                                    and average
                                                                        average subsidence
                                                                                subsidence rate.
                                                                                           rate.

5.2. Effect
      Keepingof Ground
                  in view Water    Withdrawal of unconsolidated deposits, which makes mattresses of aquifers,
                             the importance
the three-layered
     Anthropogenic      structure    analysis
                           factors mostly      as presented
                                             include            by [46]development,
                                                       infrastructure    showed that the     first activities,
                                                                                        mining      layer is comprised
                                                                                                               and ground  of
clay  and   silt along   the   inter-beds   of gravel,  with   a thickness  of 30 to 40  m
water exploitation. Abbottabad city and the surrounding area are mostly dependent on surfacein  the  west   and  70 to 80  m
in theand
water    central
              ground part   of the
                         water.   Thesubsidence
                                        increase inarea;    the second layer
                                                     the contamination           majorly
                                                                            of water due to consists
                                                                                               mixingof     gravel with
                                                                                                         of minerals   froma
conspicuously
surrounded          increased
                 hills            thickness
                       was bringing           of aboutdiseases
                                         water-borne      40 m in into
                                                                    the center  and southern
                                                                        the community            part of themore
                                                                                           and becoming         subsidence
                                                                                                                     severe
area;  and   the  third   layer  of  the  unconsolidated     soil in the  region is underlying
with time [49]. In order to handle this situation, Government bodies implemented a number of safe   bedrock,   represented
by shale water
drinking     in the schemes
                       west andindolomite
                                     the area. and
                                                 Onelimestone
                                                       of the majorin the
                                                                       andeast.
                                                                             mostThe   thickness
                                                                                   recent  schemes   of was
                                                                                                         the aided
                                                                                                              secondbylayer
                                                                                                                         the
increases    while    moving     in  a  westerly   direction   along  the  transect
Japanese Government and implemented by Japan International Cooperation Agency (JICA) W–E,   which      follows  exactlyafter
                                                                                                                         the
western   extent    of the   subsidence    region.  This  structural  analysis  showed    a strong
conducting a survey in 2009 [46]. Under this project, combined use of surficial and underground water correlation  with  the
overall
was      extent subsidence.
     proposed       by repairingAlthough        most of the
                                      the old tubewells     andland  subsidence
                                                                  building        occurred ininalluvium
                                                                             new tubewells         the areasdeposits,
                                                                                                               with densethe
direct  correlation     between     this type  of soil with   subsidence    may  not be  solely
population. For this purpose, a network of water supply lines connecting surface water reservoirspossible,   but  the direct
correlation
and  tubewells of this
                    wastype     of geological
                           developed            unit
                                          (Figure     with
                                                   11),     the existenceand
                                                         implemented,       of aquifer
                                                                                handed  and  its to
                                                                                          over   exploitation    (changing
                                                                                                      the Government      in
the unconsolidated
October   2015 [50]. surface to consolidated surface) could provide a better understanding of the land
subsidence      processthe
     By comparing          in this  populated
                              subsidence         part
                                            of the     of with
                                                    area  the city.
                                                                the existing and implemented water supply scheme,
it can be seen in Figure 9 that the crests along profiles W–E and S–N belong to the locations of tubewells.
5.2. Effect of Ground Water Withdrawal
Similarly, it can be seen in Figure 11 that the extent and pattern of the subsidence zone follow the
       Anthropogenic
distributed    locations offactors   mostly include The
                              tubewells/boreholes.        infrastructure     development,
                                                             edges of subsidizing      zones mining      activities,
                                                                                               are at relatively        and
                                                                                                                    higher
ground water
altitudes  than theexploitation.
                        central partAbbottabad
                                       of the citycity
                                                     andand     the the
                                                           follow    surrounding
                                                                         locations ofarea  are tubewells
                                                                                        other   mostly dependent         on
                                                                                                             in this area.
surface
As        waterinand
     elaborated          ground
                     Section        water.
                              5.1, the      Theinincrease
                                       aquifers     the study inarea
                                                                  the are
                                                                       contamination     of water
                                                                          identified in the          due
                                                                                             first and     to mixing
                                                                                                       second    layers ofof
minerals
the          from surrounded
      underground                    hills wasinbringing
                      soil and groundwater                     water-borne
                                                   these aquifers     moves withdiseases  into
                                                                                    varying      the level
                                                                                              water   community
                                                                                                            from 1190and to
becoming
1210   m mean more    severe
                 sea level      with therefore,
                            (M.S.L);   time [49].    In order
                                                 it was           to handle
                                                          emphasized     by thethis
                                                                                 JICAsituation,
                                                                                       team duringGovernment
                                                                                                      the handing   bodies
                                                                                                                       over
implemented
of  the project toa number
                    monitor of thesafe drinking
                                    water        water
                                           discharge   in schemes    in the major
                                                          order to avoid     area. One  of issues,
                                                                                    future the major   and
                                                                                                    such  as most    recent
                                                                                                              subsidence
schemes
in  the area.was
               The aided
                    increasebyof the   Japanese
                                  3.5 percent      Government
                                               population    per year and   implemented
                                                                        since  1999 in 2017,by     Japan an
                                                                                              including    International
                                                                                                               increase of
Cooperation
17  percent from Agency
                    2009 to(JICA)
                              2015 after  conductingincreased
                                    [47], ultimately    a survey thein 2009  [46]. Under
                                                                        drinking           this project,
                                                                                   water demand           combined
                                                                                                     in the   area.     use
of surficial and underground water was proposed by repairing the old tubewells and building new
tubewells in the areas with dense population. For this purpose, a network of water supply lines
connecting surface water reservoirs and tubewells was developed (Figure 11), implemented, and
handed over to the Government in October 2015 [50].
Remote Sens. 2020, 12, 3442                                                                                                    14 of 18
Remote Sens. 2020, 12, x FOR PEER REVIEW                                                                                      14 of 19

      Figure 11. Location
          Figure          of tubewells
                  11. Location         and and
                               of tubewells supply lineslines
                                               supply     overlaid on average
                                                              overlaid        vertical
                                                                       on average      velocity
                                                                                  vertical      map.map.
                                                                                           velocity

      By comparingthe
      Nevertheless,        thearea
                                 subsidence
                                     of higher of     the area rates
                                                  subsidence      withagrees
                                                                          the existing
                                                                                 well withandthe implemented
                                                                                                    tubewell in the   water
                                                                                                                         study supply
                                                                                                                                  area;
scheme,
the         it can bemostly
    deformation         seen in   Figure
                               started      9 that
                                          with       the crestsincrease
                                                an excessive     along profiles
                                                                             of waterW–E    and S–N
                                                                                        pumping      from belong    to thetubewells
                                                                                                            developed       locations
of tubewells.
during            Similarly, itperiod.
          the investigating       can be seenOne in of Figure
                                                       the other11 possibilities
                                                                    that the extent of and   pattern of the
                                                                                        this subsidence           subsidence
                                                                                                              could               zone
                                                                                                                       be the water
follow    the    distributed    locations      of   tubewells/boreholes.        The    edges    of
leakage problem in the underground pipes, as there have been more than 800 different cases reported  subsidizing       zones    are   at
relatively higher
regarding              altitudes
              water leakage         than in
                                 issues    thethe
                                                central
                                                    area. part  of the city
                                                           Moreover,          andconnections
                                                                        illegal    follow the locations        of other tubewells
                                                                                                  and uncontrolled         pumping
in thiscould
hours    area. Asalsoelaborated
                       be responsiblein Section
                                           for the5.1,   the aquifers
                                                     changing     waterintable
                                                                             the study
                                                                                 in the area
                                                                                         area.are identified in the first and
second    layers to
      In order     of verify
                      the underground
                               the cause of    soil  and
                                                  this     groundwater
                                                        change               in these
                                                                  in the area,          aquifers moves
                                                                                  we analyzed                with varying
                                                                                                      the temporal               water
                                                                                                                         correlation
level from
between         1190 to 1210
            IPTA-InSAR           m mean
                            derived     time sea
                                              serieslevel  (M.S.L); at
                                                       subsidence     therefore,
                                                                        investigatedit was
                                                                                         PSs,emphasized        by and
                                                                                               i.e., P1, P2, P3,     the P4,
                                                                                                                          JICAandteam
                                                                                                                                    the
during the handing
precipitation     (Figureover12). ofThe
                                      thecollected
                                           project toprecipitation
                                                         monitor the water
                                                                        data atdischarge
                                                                                  the nearby  in order
                                                                                                  Kakultostation
                                                                                                              avoid (the
                                                                                                                       major    future
                                                                                                                             location
issues,
of        such asissubsidence
   the station       shown in Figure in the 11)
                                             area.    The increase
                                                   showed     a strong of correlation
                                                                           3.5 percentwith
                                                                                         population
                                                                                                time seriesper year
                                                                                                                trendsince    199912).
                                                                                                                        (Figure      in
2017,
The     including
     seasonal         an increase
                 variation             of 17 percent
                             in the ground                from 2009 to
                                                water particularly          2015
                                                                        after     [47], ultimately
                                                                               monsoon     rainfall (Juneincreased
                                                                                                             throughthe     drinking
                                                                                                                         September)
water demand
justifies  the causein of
                        thethe
                             area.
                               subsidence in the area. The monsoon rainfall refills the aquifers, balancing the
      Nevertheless,
underground        waterthe   area of higher
                            discharge             subsidence
                                          and stabilizing        rates
                                                               the      agrees
                                                                    process    ofwell   with the This
                                                                                  subsidence.       tubewell     in the
                                                                                                           clearly       study area;
                                                                                                                      demonstrates
     deformation
the process             mostly
                 and cause     of started
                                   subsidence withinan  theexcessive
                                                             study area.increase
                                                                              Zhangofetwater
                                                                                          al. [51]pumping
                                                                                                      and Gallowayfrom developed
                                                                                                                           et al. [52]
tubewells      during   the  investigating      period.    One   of  the  other  possibilities    of
showed a similar relationship and joint effect of natural and anthropogenic conditions with subsidence.this subsidence       could be
the water leakage
Moreover,                problem in
               the identification      of the
                                          highunderground         pipes, as there
                                                 subsidence particularly         in thehave   been more
                                                                                          peripheries          than 800 locations
                                                                                                           of tubewell      different
cases reported
showed                regarding
           a good ability             water1A
                              of Sentinel      leakage
                                                  data and issues   in the
                                                              the IPTA         area. Moreover,
                                                                           approach                    illegal connections
                                                                                       for land subsidence         mapping in and  this
uncontrolled
part              pumping hours could also be responsible for the changing water table in the area.
      of the region.
      In order to verify the cause of this change in the area, we analyzed the temporal correlation
between IPTA-InSAR derived time series subsidence at investigated PSs, i.e., P1, P2, P3, and P4, and
the precipitation (Figure 12). The collected precipitation data at the nearby Kakul station (the location
balancing the underground water discharge and stabilizing the process of subsidence. This clearly
demonstrates the process and cause of subsidence in the study area. Zhang et al. [51] and Galloway
et.al. [52] showed a similar relationship and joint effect of natural and anthropogenic conditions with
subsidence. Moreover, the identification of high subsidence particularly in the peripheries of
Remote Sens. 2020,
tubewell           12, 3442showed a good ability of Sentinel 1A data and the IPTA approach for
             locations                                                                           15 land
                                                                                                    of 18
subsidence mapping in this part of the region.

      Figure 12.
      Figure  12. Time
                  Time series
                       series LOS
                              LOS subsidence
                                   subsidence of
                                              of PS
                                                 PS points
                                                    points P1,
                                                           P1, P2,
                                                               P2, P3,
                                                                   P3, and
                                                                       and P4
                                                                           P4 versus
                                                                              versus daily
                                                                                     daily precipitation
                                                                                           precipitation at
                                                                                                         at
      Kakul  Station.
      Kakul Station.

6.
6. Conclusions andFuture
   Conclusion and  FutureWork
                         Work
       In
        In this
             this study,
                  study,thethemulti-temporal
                                 multi-temporalInSAR InSARapproach
                                                               approachof    ofIPTA
                                                                                IPTAwas wasemployed
                                                                                               employedon     on multi-track
                                                                                                                   multi-track Sentinel
                                                                                                                                    Sentinel
1A
 1ATOPSAR
      TOPSARimages    images  collected
                                 collectedbetween
                                              betweenJanuary     2015 2015
                                                           January      and December
                                                                               and December 2018 to2018
                                                                                                      analyze      the spatio-temporal
                                                                                                              to analyze        the spatio-
distribution       and trendand
 temporal distribution            of subsidence       in Abbottabad
                                       trend of subsidence                  City and
                                                                  in Abbottabad           theand
                                                                                       City    surrounding
                                                                                                    the surroundingarea. Step area.by   step
                                                                                                                                     Step  by
processing
 step processing chainchain
                          of iterative    IPTA IPTA
                                  of iterative    approach      was employed
                                                          approach      was employed  and the andcauses     of the of
                                                                                                     the causes       subsidence       were
                                                                                                                          the subsidence
investigated
 were investigated  by analyzing       the relationship
                               by analyzing                   between natural
                                                    the relationship          between(soil consolidation)          and anthropogenic
                                                                                             natural (soil consolidation)                and
factors     (ground factors
 anthropogenic          water extraction)
                                 (ground water in detail.    The average
                                                      extraction)             subsidence
                                                                     in detail.   The average  rate subsidence
                                                                                                     map showed          that
                                                                                                                      rate   maptheshowed
                                                                                                                                     central
part
 that ofthethe   subsiding
              central    part ofarea,
                                   thewhich     is close
                                         subsiding         to which
                                                       area,   Karaokram       highway
                                                                        is close             and cantonment,
                                                                                   to Karaokram          highway and   including      major
                                                                                                                              cantonment,
localities     such   as  Hassan    town,    Amir    Alam     Awan     town,   Mir    alam    town,
 including major localities such as Hassan town, Amir Alam Awan town, Mir alam town, and Jhangi       and    Jhangi     Area,    is sinking
at a maximum
 Area,     is sinking  rate
                          at of ~6.5 cm/year,
                              a maximum       ratevarying
                                                     of ~6.5 from     different
                                                                cm/year,    varyingratesfrom
                                                                                           up todifferent
                                                                                                   1 cm/year. ratesTimeup series     history
                                                                                                                            to 1 cm/year.
graphs
 Time seriesshowed      a close
                    history       correlation
                               graphs     showed with    the rainfall
                                                     a close              during
                                                                 correlation        the investigation
                                                                                 with    the rainfall during periodthe  andinvestigation
                                                                                                                               subsidence
profiles
 period and  alongsubsidence
                     the W–E and       S–N transects
                                   profiles   along theshowed
                                                            W–E and  varying
                                                                           S–N crests
                                                                                 transectsalong   the transects
                                                                                               showed      varying   that   are related
                                                                                                                        crests    along theto
the  locations
 transects      thatofare
                        tubewells.
                            related to Thetheoverall   pattern
                                               locations          of the subsidence
                                                             of tubewells.      The overallwas investigated,
                                                                                                  pattern of theand          it was found
                                                                                                                        subsidence       was
that   it follows     the  development        made     for  providing      safe  drinking      water
 investigated, and it was found that it follows the development made for providing safe drinking        to the   community          under    a
recently
 water tocompleted
               the community projectunder
                                       of JICA.   The aquifer
                                              a recently           in this part
                                                             completed            of the
                                                                            project        Abbottabad
                                                                                       of JICA.              basin in
                                                                                                   The aquifer       is decreasing
                                                                                                                          this part ofasthe  a
result    of extensive
 Abbottabad         basinwater     dischargeasina recent
                            is decreasing           result years,    resulting
                                                              of extensive        in the
                                                                               water       consolidation
                                                                                        discharge              of soil,
                                                                                                       in recent         further
                                                                                                                     years,         leading
                                                                                                                               resulting    in
to
 thethe   creation of several
      consolidation                  local problems
                           of soil, further   leading to  in the
                                                              thecreation
                                                                   area. Building
                                                                             of several dikes/bowls
                                                                                            local problemsafter rainfall
                                                                                                                  in the area.or flood    are
                                                                                                                                   Building
ultimate
 dikes/bowls  responses
                     after to   the subsidence
                             rainfall   or flood processes
                                                     are ultimate and responses
                                                                         the concerned to thedepartments
                                                                                                 subsidence     were    unawareand
                                                                                                                    processes         of this
                                                                                                                                          the
phenomenon          in the studywere
 concerned departments               area.unaware
                                             This study of highlights     the first ever
                                                            this phenomenon          in the evidence
                                                                                               study area.of land
                                                                                                                Thissubsidence       and its
                                                                                                                       study highlights
causes
 the firstinever
               the region,
                     evidence  and ofthe
                                      land results  obtained
                                             subsidence       andbyitsimplementing
                                                                        causes in the the       advanced
                                                                                           region,    and the  InSAR
                                                                                                                   results technique
                                                                                                                               obtainedcan by
provide support to the local government as well as decision and policy makers for better decision
making and planning to overcome problems such as availability of drinking water, overflowing drains,
sewage system, littered roads/streets, and sinking land in this part of the city.
       Because in situ observations were not available, some decorrelation noises may be present in the
final deformation maps, but they have been greatly minimized during 2D regression quality checks
at each iteration. Therefore, the LOS deformation rates generated for each point target are basically
reliable for mapping the land subsidence in the area, and showed consistency in the results of ascending
You can also read