Growing Wheatbelt Tourism 2017-2020 - Page 1 of 60
←
→
Page content transcription
If your browser does not render page correctly, please read the page content below
Growing
Wheatbelt
Tourism
2017-2020

            Page 1 of 60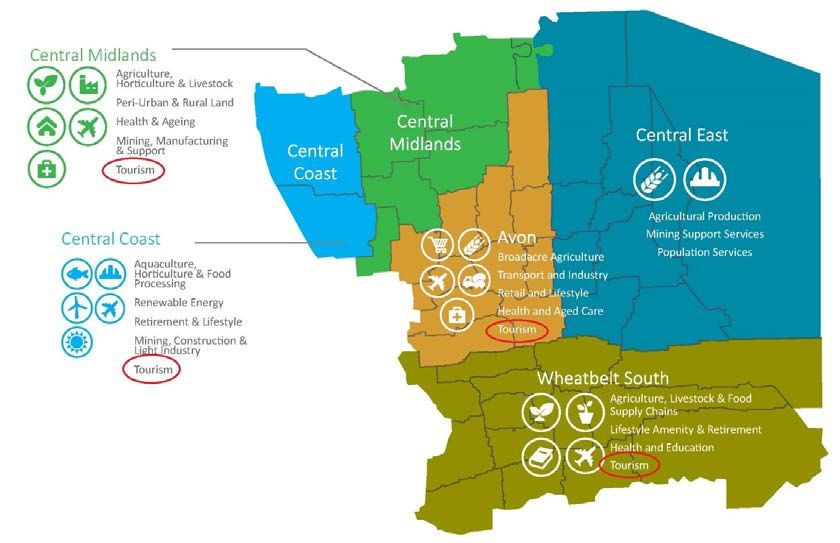
Document Control
This document has been prepared by the Wheatbelt Development Commission.
Updated 14 September 2017

Version:        Version Release Date:   Revisions:         Purpose:
V1              29 May 2017             WDC                Initial Version
V2              8 August 2017           WDC                WDC Board Review
V3              14 September 2017       WDC & Industry     Industry Review and
                                                           Public Comment
V4                                      WDC                Incorporate       Public
                                                           Comment

                                                                       Page 2 of 60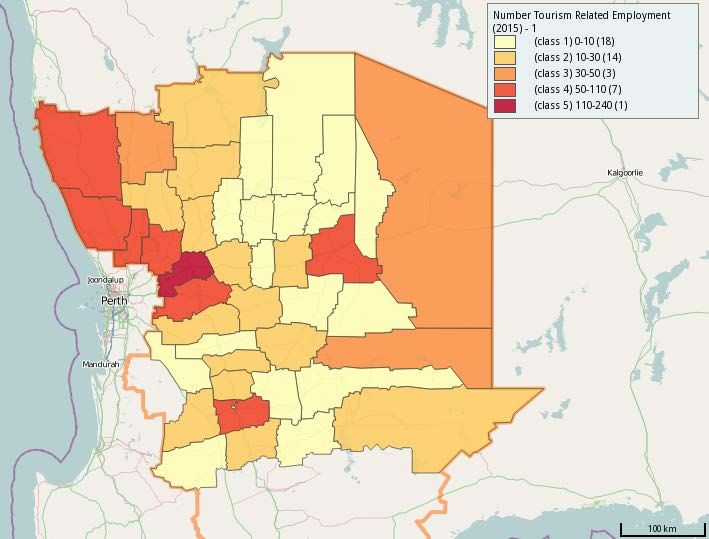
Table of Contents
Glossary............................................................................................................................... 4
Acronyms ............................................................................................................................. 5
Foreword.............................................................................................................................. 6
1.0      Executive Summary ................................................................................................... 7
2.0      Western Australian Tourism ....................................................................................... 9
3.0      Wheatbelt Tourism ................................................................................................... 10
   3.1      Background .......................................................................................................... 10
   3.2      Value/Economic Cost Benefit ............................................................................... 12
   3.3      Competitive Advantage ......................................................................................... 13
   3.4      Comparative Advantage ....................................................................................... 14
4.0      Wheatbelt Tourism Trends ....................................................................................... 16
   4.1      Visitation Rates ..................................................................................................... 16
   4.2      Expenditure .......................................................................................................... 18
   4.3      Employment .......................................................................................................... 19
   4.4      Private Capital Investment .................................................................................... 21
5.0      Strategic Alignment – International/ Federal/ State Context and Priorities ............... 23
   5.1      Tourism WA’s Five A’s of Success ....................................................................... 24
   5.2      Additional WDC A’s of Success ............................................................................ 25
6.0      Current Industry Profile ............................................................................................ 26
   6.1      Wheatbelt Tourism Product .................................................................................. 26
   6.2      Key Stakeholders.................................................................................................. 28
   6.3      Strengths, Weaknesses, Opportunities, Threats................................................... 29
   6.4      Key Issues ............................................................................................................ 30
7.0      Wheatbelt Tourism Growth Priorities ....................................................................... 31
   7.1      Industry Vision ...................................................................................................... 31
   7.2      Target ................................................................................................................... 31
   7.3      Growth Strategy Development Process ................................................................ 33
   7.4      Recommendations ................................................................................................ 35
8.0      References............................................................................................................... 45
9.0      Appendices .............................................................................................................. 47

                                                                                                                     Page 3 of 60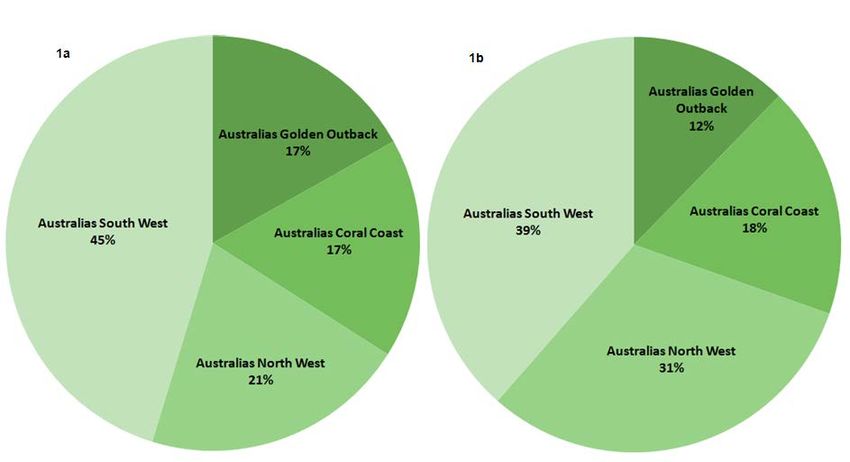
Glossary
The World Tourism Organisation (WTO) defines tourism as:

‘the activities of persons travelling to and staying in places outside their usual environment
for not more than one consecutive year for leisure, business and other purposes not
related to the exercise of an activity remunerated from within the place visited’.

         Term                    Description
         Domestic Day            Those who have travelled for a round trip distance of more than
         Trip Visitors           50km or 4 hours to a place and returns to their usual place of
                                 residence the same day.
         Domestic                Australian resident aged 15 years and over who spent at least
         Overnight               one night away from home in the region.1
         Visitor
         International           International visitors aged 15 years and over who spent at least
         Overnight               one night in the region. 1
         Visitor
         Interstate              A person visiting a State or Territory other than that in which they
         Visitor/Night           usually reside. An interstate visitor night is any night spent in a
                                 State or Territory other than that in which they usually reside.
         Intrastate              A person visiting a location away from their usual place of
         Visitor/Night           residence in the State or Territory in which they reside. An
                                 intrastate visitor night is any night spent away from their usual
                                 place of residence in the same State or Territory in which they
                                 usually reside.
         Tourism                 Expenditure by visitors during a trip, including airfares and other
         Expenditure             transport costs and any amount spent on trip-related items
                                 before, during and after the trip, until they return to their usual
                                 place of residence.
         Tourism                 A tourism region is a geographical region that has been
         Regions                 designated by Tourism Research Australia and the Australian
                                 Bureau of Statistics as having common cultural or environmental
                                 characteristics.
         Tourist                 Someone who is away from home for less than one year
                                 continuously, for the purpose of leisure (including holidaying and
                                 visiting friends and/or relatives), business, education,
                                 employment or other personal reason, other than to be employed
                                 by a resident entity in the country or place visited. 2
         Tourist                 A physical or cultural feature of a particular place that individual
         Attraction              travellers or tourists perceive as capable of meeting one or more
                                 of their specific leisure-related needs.1
         Visitor Nights          A measure of the total number of nights spent by overnight
                                 visitors on overnight trips.

1
    Tourism WA
2
    World Tourism Organisation
                                                                                             Page 4 of 60
Acronyms

     ABS               Australian Bureau of Statistics
     ACC               Australia’s Coral Coast
     AGO               Australia’s Golden Outback
     CAGR              Compound Annual Growth Rate
     CBD               Central Business District
     CRC               Community Resource Centre
     DPAW              Department of Parks and Wildlife
     DPIRD             Department of Primary Industry and Regional Development
     DRD               Department of Regional Development
     GVA*              Gross Value Added
     LGA               Local Government Authority
     LTO               Local Tourism Organisation
     NEWROC            North Eastern Wheatbelt Regional Organisation of Councils
     NEWTRAVEL         North Eastern Wheatbelt Travel
     RAC               Royal Automobile Club
     RTO               Regional Tourism Organisation
     SBCD              Small Business Development Corporation
     SWDC              South West Development Commission
     WA                Western Australia
     WAITOC            Western Australian Indigenous Tourism Operators Council
     WBN               Wheatbelt Business Network
     WDC               Wheatbelt Development Commission
     WTO               World Tourism Organisation

* Gross Value Added (GVA) is a dollar value for the amount of goods and services that
have been produced, less the cost of all inputs and raw materials that are directly
attributable to that production.

                                                                              Page 5 of 60
Foreword
The Wheatbelt’s many natural and heritage icons, its proximity to Perth and access via key
state and federal road networks delivers annual visitor numbers of nearly 700,000.
The industry is important to the Region for two reasons:
1. It presents an opportunity to diversify the economy and drive both revenue and job
growth, particularly in high amenity areas; and
2. The underpinning infrastructure that supports tourism also enhances community
amenity and liveability. The latter is critical in addressing workforce attraction, a
priority for the Wheatbelt.
As the second most visited region in WA after the South West, the Wheatbelt has strong
industry assets and activity on which to build. Growth in industry value and jobs will be
dependent on addressing capability and capacity issues and driving new market
opportunities.
This Strategy identifies unique Wheatbelt tourism assets, current growth inhibitors and
outlines initiatives which will maximise tourism growth opportunities. It recognises the
Wheatbelt’s connection to tourism activity in other regions and acknowledges significant
planning undertaken by the Tourism industry organisations of Experience Perth,
Australia’s Coral Coast and Australia’s Golden Outback.
The Wheatbelt Development Commission thanks key thought leaders and stakeholders for
their input into the development of the Strategy and looks forward to ongoing engagement
to bring opportunities for growth to fruition.
Chair, Wheatbelt Development Commission
Page 6 of 601.0 Executive Summary
The Wheatbelt Tourism Growth Strategy sets a target for the Region’s tourism industry to
increase the value of the sector from $245 million in 2015 to $301 million in 2020, and
double the number of those employed in the industry from 1,560 in 2014/15 to 3,120 in
2020. This growth will be driven by an increase in visitor overnight stays from 2,265,700
nights in 2014/15 to 2,706,800 nights in 2020.
The Wheatbelt Regional Investment Blueprint (2015) outlines the Region’s vision for the
future. This Strategy is a direct result of the Blueprint process, which highlights a need to
“foster emerging industries that diversify the economy and create new jobs” (Outcome 1.1,
pg 79). In relation to the tourism industry, the Blueprint identifies the need for a ‘whole of
region tourism strategy to focus investment, build capability and product and market this’
(pg 41).
Specifically, the Blueprint recognises the unique Wheatbelt advantages of nature based
and heritage tourism. It also recognises that tourism enhances the Region’s amenity and
liveability which addresses workforce attraction, a priority for the Wheatbelt.
Metropolitan Perth is the main tourism destination in WA. In regional WA, the Wheatbelt is
the second highest visited region and receives over 670,000 visitors annually3,
contributing to 10% of the State’s tourism economic value 4. The Wheatbelt’s unique
natural amenity and built heritage is valued as an asset for social, cultural and economic
development, particularly in the tourism industry. As a result, growth of the Wheatbelt’s
tourism industry over the last 15 years (2001 – 2016) has seen:
• Close to 300,000 visitors annually 5,6 to two iconic natural attractions (Wave Rock
and the Pinnacles);
• Annual international tourism expenditure quadrupled from $15 million to $61
million 7;
• Increased overnight visitors at an average of 9% per year3; and
• Tourism-related private investment in excess of $65 million 8.
An increase to the length of visitor stay in the Wheatbelt will add value to existing tourism
product, increase expenditure in the Region and drive jobs growth for an emerging
industry.
This Strategy recognises that there is the potential to increase the quality and experience
around existing product and broaden the range of products for both domestic and
international markets, attracting a greater range of visitor types and increasing their length
of stay in the Region.
3
Tourism Western Australia (2014/15), ‘Wheatbelt Development Commission Area: Overnight Visitor Fact Sheet’
4
Department of Training and Workforce Development (2012), ‘Wheatbelt Workforce Development Plan 2013-2016’, pg. 12
5
Australia’s Golden Outback (2017), ‘Pathways to Wave Rock’
6
Australia’s Coral Coast (2017), ‘The Pinnacles and Nambung National Park’
7
Tourism Western Australia, Department of Regional Development (2012), unpublished tourism expenditure data
8
Estimated from Wheatbelt Development Commission’s private investment listings
Page 7 of 60Through desktop research, analysis and consultations with industry organisations and
stakeholders, this strategy has identified a number of initiatives to drive industry growth
and jobs over the short and long term. The aim of this strategy is focus on those initiatives
that will:
• Enhance access, amenity and activity around four Wheatbelt tourism first-tier icons:
o New Norcia
o The Pinnacles
o Wave Rock
o Wildflowers
• Connect and enhance the numerous second-tier tourist attractions such as:
o Self-drive trails
o Events of international and national significance (aviation, motorsports,
equestrian, water-based etc)
o Heritage locations (Avon Valley, Aboriginal Heritage experiences, Museums
etc)
• Utilise digital capacity to access and grow markets and enhance visitor experience
to increase the length of stay; and
• Drive collaboration, training, and cultural and environmental awareness across
industry to achieve economies of scale and targeted market penetration.
Page 8 of 602.0 Western Australian Tourism
Key Highlights:
• The State Government’s goal is to double WA’s tourism economic value to $12B by 2020
• Tourism employment in WA has increased to 7.1% of the State’s total employment
• At least 45% of the State’s tourism expenditure is spent in regional WA
Tourism WA’s 2020 Tourism Strategy has set a target to double the State’s tourism
economic value from $6 billion in 2010 to $12 billion by 2020. In 2016, 921,400
international visitors (or 11% of Australia’s international visitors) came or travelled within
WA, spending $2.35 billion 9. In addition to this, the State’s total visitor and expenditure
number including international, interstate and intrastate overnight visitors and day trippers
equated to 29.8 million visitor nights spending $9.62 billion9.
In addition to direct fiscal earnings, growth in the tourism sector also generates:
• Employment opportunities for unskilled, semiskilled and skilled workers. Tourism
creates 97,200 jobs in WA, an increase of 3,500 jobs in 2016 which accounted for
7.1% of State employment, overtaking mining (6.9%) 10;
• A source of public as well as private income;
• Cultural exchange from tourists including language, arts, skills and culture; and
• Promotion/publicity of the State to the rest of the world, encouraging future tourist
exchanges.
Tourists in WA also tend to travel regionally, to discover and experience the diverse and
dramatic landscapes the State has to offer. In 2016, $4.7 billion or 45% of the State’s total
tourism expenditure was spent in Regional WA. The proportion of regional tourism
expenditure and visitation (both leisure and business) can be seen in the Figure below.
Figure 1: Proportion of regional tourism expenditure (1a) and visitors (1b) according to Regional Tourism
Organisation (RTO) boundaries [Source: Tourism Western Australia, Fast Facts Year Ending September 2016]
9
Tourism Western Australia (2016), Fast Facts Year Ending September 2016
10
Tourism Council WA (2016)
Page 9 of 603.0 Wheatbelt Tourism
Key Highlights:
• The Wheatbelt has the second highest number of visitors in WA, outside metropolitan Perth
• Wheatbelt tourism contributes 10% of the State’s tourism economic value
• The Wheatbelt has four internationally/nationally recognised icons and many locally known
attractions
• The tourism industry increases amenity, liveability and economic diversity of the Wheatbelt
• Proximity to Perth allows easy access to distinct natural, built and Aboriginal heritage
• The diversity of landscape, sporting and heritage attractions across the Wheatbelt provides
options for visitation on a year-round basis, with many sub-regions being more popular at
particular times of year.
3.1 Background
Outside metropolitan Perth, the Wheatbelt has the second highest number of visitors after
the South West 11. The Region welcomes over 670,000 visitors annually, which delivers a
turnover estimated to be $245 million per annum, contributing to 10% of the State’s
tourism market 12. The Wheatbelt has four significant and internationally/nationally known
icons:
• Wave Rock;
• The Pinnacles;
• New Norcia Benedictine Community; and
• Wildflowers.
These recognised tourist icons are complemented by numerous second-tier tourist
attractions including: adventure tourism activities; self-drive trails accessing natural and
historic attractions; significant events; and links to tourism activity in the Goldfields-
Esperance, Great Southern, Peel and Mid-West regions.
11
Regional visitations, not including the Perth metropolitan area
12
WA Planning Commission (2009)
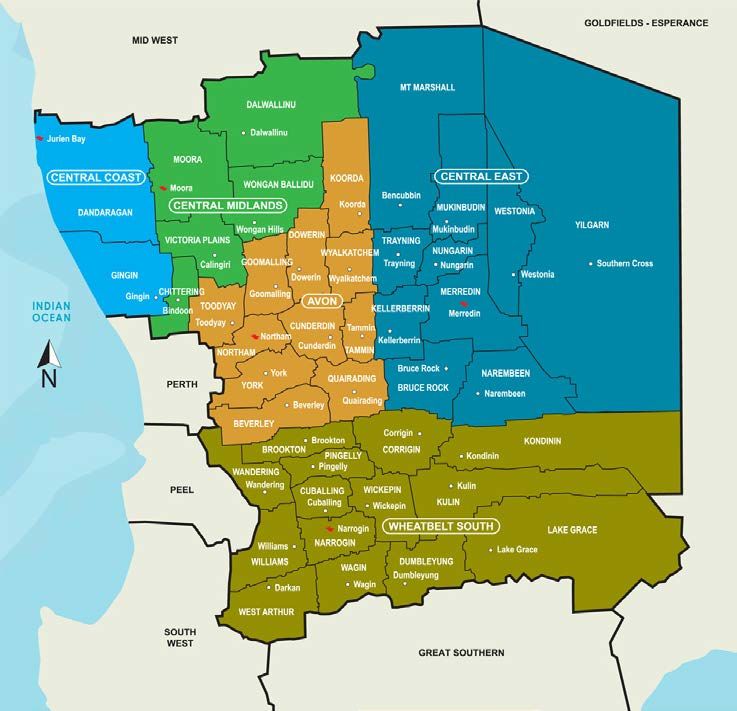
Page 10 of 60Figure 2: Opportunities for economic growth in the Wheatbelt sub-regions, including tourism; [Source:
Wheatbelt Development Commission, Key Economic Features Map]
The Wheatbelt is divided into five sub-regions: Central coast, Central midlands, Central
East, Avon and Wheatbelt South. The following map outlines the local governments that
make up each sub-region.
Page 11 of 60Within the Wheatbelt, three Regional Tourism Organisations (RTO’s) operate.
Experience Perth includes the Wheatbelt Shires of Beverley, Brookton, Chittering, Gingin,
Goomalling, Northam, Toodyay, Victoria Plains (including New Norcia), Wandering and
York.
Australia’s Coral Coast includes the one Wheatbelt Shire of Dandaragan.
Australia’s Golden Outback includes all other 31 Wheatbelt LGA’s outside of those in the
Experience Perth and Australia’s Coral Coast regions.
The following map highlights the Regional Tourism Organisations that operate in Western
Australia:
3.2 Value/Economic Cost Benefit
The Wheatbelt has historically been heavily reliant on the agriculture and mining sectors
and as a result, the Region’s commodity economy is highly influenced by seasonal
variation, market prices and is susceptible to currency fluctuations. Tourism in the
Wheatbelt has the potential to diversify economic growth and development and increase
jobs in the Region.
Increasing the diversity and resilience of the Wheatbelt’s economy is a key strategic aim
outlined in the Wheatbelt Regional Investment Blueprint (2015), Vibrant Economy Vision
for “A diversified and adaptive economic base building on the Wheatbelt’s assets and
aligned to State, National and International opportunity” (pg. 3).
Page 12 of 60While tourism has been a small contributor to the Wheatbelt economy, contributing $199.7
million 13 in Industry Gross Value Add compared to Agriculture ($1.8 billion or 24.9%) and
Mining ($1.4 billion or 20%) in 2014-2015 14, it can provide a new injection of spending and
secondary economic benefits to local regional communities. This can be done through 15:
• Supporting increased use of existing infrastructure and amenity;
• Increasing the turnover of retail and service businesses that are essential to service
local residents, and in doing so improving business viability in small towns; and
• Profiling communities and industry sectors.
3.3 Competitive Advantage
‘Competitive advantage’ is the ability to use resources effectively and generate greater
value for visitors than the surrounding competitors.
Proximity to Perth
A key comparative advantage for the Wheatbelt is its proximity to the Perth Metropolitan
area, with the Wheatbelt surrounding Perth on its North and East boundaries. Many of the
key attractions for the Region are accessible in a day-trip from Perth, exposing the Region
to significant numbers of visitors who do not have the time to travel further afield. The
Central Coast, Central Midlands and Avon Sub-regions in particular benefit from this, as
well as the western parts of the Wheatbelt South Sub-region. The proximity of the
Wheatbelt to Perth also makes it attractive for weekend trips, with much of the Region
accessible within 3 hours drive from the Perth CBD. In addition, the Wheatbelt is en-route
to outlying regions such as the South West, Mid West, Goldfields-Esperance and Great
Southern.
All season and diverse cultural, sport and recreational activities
The Region has a range of attractions and nature-based recreational activities including:
hot air ballooning, skydiving and gliding in the Avon Valley; fishing, surfing, skydiving, kite
boarding, snorkelling and scuba diving along the Turquoise Coast; bush walking and
mountain bike riding on the Munda Biddi Trail; and 4WD and motor-cross activities across
the Region.
This diversity makes the overall Region attractive to different visitor markets year-round
although the key time for visitors is from Easter to November. Some activities are popular
during the winter-spring months (e.g. mountain biking or hiking), and others more popular
in summer-autumn months. (e.g. water sports or fishing). This is a significant advantage
compared to other regions where specific periods account for the vast majority of visitors,
making tourism in the Wheatbelt a viable year-round enterprise.
Some Aboriginal culture and heritage interpretive tourism experiences such as Njaki Njaki
Tours in the Wheatbelt East, and the Aboriginal Interpretive Centre under construction in
13
Department of Regional Development (2011), ‘Wheatbelt: A Region In Profile 2011’
14
Wheatbelt Gross Regional Product Statistics (2015)
15
Wheatbelt Regional Investment Blueprint (2015)
Page 13 of 60the Avon are emerging. The region is also home to numerous museums that interpret
historical Wheatbelt life and work.
Some tourism activities can take advantage of natural assets such as the night sky. This
can increase visitor numbers during traditionally low visitation periods (e.g. the heat of
summer) in parts of the Wheatbelt.
Value-adding through local knowledge and expertise
Within the Wheatbelt, a number of organisations have a strong knowledge base for their
focus areas or industries and have been able to leverage this knowledge into successful
business ventures. Examples include the Pinnacles Visitor Centre and the Wheatbelt Way
drive trail, which have leveraged local expertise into tourism offerings for visitors.
Converting local knowledge into a coordinated, professional product provides significant
value-add for visitors. There is also considerable potential to further value-add to tourism
attractions in the Region, through improved packaging of products that are in proximity to
each other, improved marketing, co-ordination between organisations and integration of
infrastructure to support increased visitor numbers.
3.4 Comparative Advantage
‘Comparative advantage’ is the natural and heritage resources available to a destination
and the Region’s advantage over surrounding competitors as a result.
Varied scenic landscapes and diverse natural amenity
The Wheatbelt has a number of picturesque scenic landscapes distinctive to this Region.
The diverse landscape varies across the sub-regions, from the pristine white beaches and
clear turquoise waters of Cervantes and Jurien Bay; the rolling hills and winding streams in
the Avon Valley; forests and woodlands in the Dryandra area and Central Midlands; to the
more rugged terrain in the Central East along self-drive trails such as the Wheatbelt Way
and the Tin Horse Highway. These diverse landscapes, including granite outcrops, salt
lakes, wildflowers, unique sculptures and agricultural fields provide visitors with a dynamic,
changing experience as they travel through the Region.
Built heritage
The focus of the built heritage of the Wheatbelt differs significantly to other regions of
Western Australia. The Wheatbelt offers opportunities for visitors to observe both past and
present working life, with a number of early settler heritage buildings and working farm
tours and farm stays providing unique accommodation options throughout the Region.
The Wheatbelt’s heritage buildings include the Williams Woolshed, New Norcia
Benedictine Community monastic townsite, the historic towns of York (WA’s first inland
town) and Toodyay, the Albert Facey homestead in Wickepin and the Avondale Discovery
Farm in Beverley. Over 55 museums throughout the Region offer visitors further insight
into the history of the Wheatbelt.
Page 14 of 60Aboriginal heritage
There are approximately 800 Aboriginal heritage sites throughout the Wheatbelt 16. Some
sites, such as the Dorntj Koorliny (‘walking together’) Aboriginal heritage trail along the
Avon River have interpretive signs on site, while tour operators such as the Njaki Njaki
tours in Merredin provide guided Aboriginal heritage tours and activities for visitors.
Aboriginal heritage is largely an understated aspect of the Wheatbelt’s tourism attractions,
and could be highlighted across tourism promotions for the Wheatbelt. However, many of
these sites are culturally sensitive and there may be no benefit in providing tourism access
due to the risk of them being damaged or dealt with in a disrespectful manner.
Astronomy
The Wheatbelt, with its trade mark clear skies, low light pollution and open spaces, is
highly attractive to tourists who come from densely populated urban regions. The
Wheatbelt is ideally positioned to capture both domestic and international markets and
astronomy tourism in the form of astrophotography or stargazing is a growing tourism
niche. Advances in technology and increased media exposure have led to exponential
growth in the hobby over the last two decades. Organisations such as Astronomy WA,
Stargazers Club WA, Indigo Storm Photography and Astro Photography Australia have
increased the exposure of the advantages of the Wheatbelt for stargazing and
astrophotography.
Internationally/nationally recognised natural icons
The Wheatbelt is home to two internationally/nationally recognised natural icons and two
of the State’s most popular day trip destinations - Wave Rock and The Pinnacles. These
two sites attract approximately 100,000 17 and 190,000 18 visitors respectively each year
and provide significant tourism expenditure and economic growth into nearby Wheatbelt
shires and towns. Having iconic destinations in close proximity to Perth gives the
Wheatbelt an advantage in attracting day trippers and weekenders and capturing en-route
visitors and visitor expenditure.
Enhancing activities at these iconic attractions through infrastructure development will
encourage visitors to stay more than one night as they have more activities at the one
destination. Coordinated marketing that incorporates iconic destinations into broader
tours/itineraries will also be beneficial.
The Central Coast Sub-region is beginning to show this breadth of activity and
collaboration. International standard experiences can now be had at the Pinnacles,
Lobster Shack and Jurien Bay Skydive, accommodation and amenity infrastructure is
being invested in and collaborative marketing is occurring, attracting the interest of tourism
wholesalers.
16
WAPC 2015
17
Australia’s Golden Outback (2017), ‘Pathways to Wave Rock’
18
Australia’s Coral Coast (2017), ‘The Pinnacles and Nambung National Park’
Page 15 of 604.0 Wheatbelt Tourism Trends
Key Highlights:
• 94% of visitors to the Wheatbelt are domestic travellers
• This Strategy assumes the majority of domestic travellers are self-drive and/or self-
contained
• Domestic visitor numbers fluctuate depending on global economic cycles
• The number of overnight visitors in total has increased at an average of 9% per year since
2011
• While domestic tourism expenditure in the Wheatbelt fluctuates from year to year,
international tourism expenditure quadrupled between 2001 and 2012
• Overall, analysis of Wheatbelt tourism trends is difficult due to a lack of destination level,
industry value and employment statistics
• Tourism related private investment is estimated to be in excess of $65 million, over the last
five years
4.1 Visitation Rates
There were approximately 676,700 international and domestic visitors in the year 20143,
increased from approximately 666,846 visitors in 2013 19 and 605,700 visitors in 2012 20.
Domestic travellers over this period made up approximately 94% of total visitors,
dominating the Wheatbelt’s tourism market. While domestic visitors continue to make up
the majority of total visitors, these visitation rates continue to fluctuate according to global
economic cycles such as the Global Financial Crisis of 2007-08, whereas international
tourist numbers appear more stable.
800.0
700.0
Estimated visitor number ('000s)
600.0
500.0
400.0
300.0
200.0
100.0
-
2001
2002
2003
2004
2005
2006
2007
2008
2009
2010
2011
2012
2013
2014
Year
Domestic International
Figure 3: Estimated visitors to the Wheatbelt (domestic and international); [Source: Tourism WA Visitation Data]
19
Unpublished 2013 visitation data from Tourism WA
20
Tourism WA (2012), ‘International and Domestic Visitor Number 2001 to 2012’
Page 16 of 60For the year ending 2014, the Wheatbelt had a comparatively low proportion of domestic
(interstate and intrastate) and international visitors compared to the South West.
Approximately 8% of the overnight visitors in WA stayed in the Wheatbelt, compared to
23% of overnight visitors in WA who stayed in the South West. The proportion of total
overnight visitors in WA who stayed in the Wheatbelt can be further broken down into:
• 8.9% of the State’s Intrastate overnight visitors;
• 3.9% of the State’s Interstate overnight visitors; and
• 4.9% of the State’s International overnight visitors.
Of estimated visitor nights, less than 4% of total State nights are spent in the Wheatbelt,
however this is proportionate to:
• 4.6% of the State’s Domestic total visitor nights; and
• 1.9% of the State’s International total visitor nights.
Table 1: Estimated overnight visitor numbers and nights for the Wheatbelt, comparative to the South West and
WA; [Source: Tourism WA (2015) ‘Wheatbelt Development Commission Area Overnight Visitor Fact Sheet YE
2014/15’]
2014/2015 Wheatbelt % South West % Western Australia %
Estimated overnight visitors
Intrastate 586,500 87% 1,739,500 88% 6,542,000 76%
Interstate 48,500 7% 113,000 6% 1,215,000 14%
International 41,200 6% 123,900 6% 827,000 10%
Total 676,700 100% 1,976,400 100% 8,584,000 100%
Estimated visitor nights
Domestic 1,695,500 75% 5,708,000 78% 36,353,000 56%
International 570,200 25% 1,617,000 22% 28,593,000 44%
Total 2,265,700 100% 7,325,000 100% 64,946,000 100%
According to Tourism WA, the Wheatbelt experienced 2,265,700 visitor nights in the
2014/15 financial year9 (refer to Table 1). Of these, 75% of visitor nights were spent by
domestic visitors and 34% or 770,338 domestic visitor nights were spent in a caravan
park, commercial camping ground or non-commercial camping ground3. As a result, this
Strategy assumes the majority of visitors are self-drive and/or self-contained (caravans)
with accommodation and meal preparation facilities.
While total overnight visitor numbers are comparatively lower than the South West, the
Wheatbelt has experienced a comparatively higher increase in the total visitor number
growth rate between 2011 and 2015. A visitor number compound annual growth rate
(CAGR) of 9.32% over the four year period between 2011 and 2015 indicates a compound
growth of approximately 9% per year; in comparison, the South West experienced a
CAGR of 6.63% during the same timeframe. This indicates the Wheatbelt had a higher
rate of visitor number growth than the South West, despite receiving less overnight visitors
in total.
Page 17 of 60This strategy recognises the need to better quantify the breakdown of the Wheatbelt’s
domestic tourism market. This includes the value comparison between overnight visitors
and day trippers to the Region. It also includes the breakdown of the type of domestic
tourist visiting the Wheatbelt according to social and economic demographics and tourism
segments such as business, events, groups, education, visiting friends/relatives or
Meetings, Incentives, Conventions and Exhibitions (MICE).
4.2 Expenditure
Total expenditure in the Wheatbelt has experienced continued growth since 2001. During
the period of 2001-2012, the average tourism expenditure per year in the Wheatbelt was
approximately $202 million. During this time frame, total tourism expenditure was at its
highest in 2012 at approximately $239 million (see Table 2), which was made up of:
• $177.9 million from domestic visitors; and
• $60.9 million from international visitors.
Table 2: Tourism expenditure in the Wheatbelt for years 2011 and 2012; [Source: Tourism WA and Department of
Regional Development (2012)]
Total Visitors Total Tourism Expenditure
2011 2012 2011 2012
Number % Number % $m % $m %
Domestic 438,700 93 569,300 94 167.4 77 177.9 74
International 34,700 7 36,400 6 49.3 23 60.9 26
Total 473,400 100 605,700 100 216.7 100 238.8 100
Between 2001 and 2012, domestic visitor expenditure made up the majority of total
expenditure; however this continues to fluctuate according to global economic cycles.
Meanwhile international visitor expenditure quadrupled between 2001 and 2012,
generating a greater proportion of the Region’s tourism income each year.
Page 18 of 60300.0
250.0
Expenditure ($m)
200.0
150.0
100.0
50.0
0.0
2001 2002 2003 2004 2005 2006 2007 2008 2009 2010 2011 2012
Year
Domestic International Total Linear (Total)
Figure 4: Estimated Wheatbelt tourism expenditure showing linear increase in total tourism expenditure and an
increased international spend between 2001 and 2012; [Source: Tourism WA and Department of Regional
Development (2012)]
4.3 Employment
Employment by Tourism Sectors
Since Tourism is a service based industry comprising a number of tangible and intangible
components 21, Tourism employment sectors are not readily identifiable. As a result, the
typology of tourism characteristic activities (direct tourism employment sectors) can be
grouped into 5 categories 22:
1. Accommodation and Food Services
a. Accommodation
b. Food and beverage services
2. Retail Trade
a. Fuel retailing
b. Food retailing
c. Other store-based retailing
3. Arts and Recreation Services
a. Heritage activities
b. Creative and performing arts activities
c. Sports and recreation activities
d. Gambling activities
4. Transport, Postal and Warehousing
a. Road transport
b. Rail transport
c. Water transport
d. Air transport
21
Tourism Western Australia (2006), Inquiry into Australia’s Service Industries
22
Based on the ABS Industrial Classification for Tourism
Page 19 of 605. Rental, Hiring and Real Estate Services
a. Rental and hiring services (except real estate)
Interpretation of the latest ABS census data can be done at an industry level, however
specialisation into the above breakdown of direct tourism employment sectors (a,b,c etc.)
is not widely available at a Regional level. Therefore, this Strategy acknowledges the
following statistics may not be an accurate representation of direct tourism employment,
but an indication of the industries as a whole.
Between 2006 and 2011, the Wheatbelt experienced growth of employment in
Accommodation and Food Services (an increase of 216 jobs; refer to Table 3), and
Transport, Postal and Warehousing (and increase of 176 jobs); two sectors that are not
specialised to the Region. This increase in total change in employment is primarily due to
the prosperity of both sectors at a State-wide whole-of-industry and whole-of-economy
level; however the Wheatbelt could take advantage of these employment sectors within its
tourism industry as they thrive across the State.
In contrast, the Retail Trade and Rental, Hiring and Real Estate Services sectors are
declining; however these are driven by a decrease at a whole-of-industry level due to
external factors.
Industry Sector National Share Industry Mix Regional Shift Total Change
(2006-2011) (2006-2011) (2006-2011) in Employment
(2006-2011)
Retail Trade 488.578 -314.885 -263.692 -90
Accommodation and Food Services 237.197 15.806 -37.004 216
Transport, Postal and Warehousing 266.980 132.040 -223.020 176
Rental, Hiring and Real Estate Services 51.056 -39.442 -28.613 -17
Table 3: Shift share analysis (2006-2011) of the Wheatbelt's employment across four tourism-related sectors,
compared to State
Employment across Local Government Areas
In 2014/15 the estimated percentage of tourism-related employment from total Wheatbelt
workforce was 4.4%, or 1,560 jobs 23. This has increased from 3% or 1,153 tourism-related
jobs in 2001 24. As shown in Figure 5, the Shire of Northam held the greatest number of
tourism-related jobs in the region (240, 4.5%), followed by the Shires of Toodyay (110,
5.1%), Narrogin (110, 4.6%), Gingin (110, 4.6%), Dandaragan (100, 6.2%), York (90, 6%),
Chittering (90, 3.5%) and Merredin (80, 5%). A breakdown of employment by LGA can be
seen in Appendix 4.
23
Tourism Works (2015), ‘The Western Australian Tourism Works Atlas’
24
Tourism Task Force (2001), ‘The Tourism Employment Atlas for Australia’
Page 20 of 60Figure 5: Map showing the distribution of tourism-related jobs across the Wheatbelt Shires; [Source: Tourism
Works (2014/15), ‘The Western Australian Tourism Works Atlas’]
4.4 Private Capital Investment
The following tourism-related private capital investments have occurred or are occurring
across the Wheatbelt in the past decade. The investment is estimated in excess of $65
million8.
Avon Sub-region
• The Grand Hotel, Northam
• Dukes Inn, Northam
• Fourteen K Brewery, Muchea
• Dome Café and Accommodation, Northam (under construction)
• Avondale Discovery Farm Housing Development, Beverley
• Aboriginal Environmental and Interpretive Centre Northam (under construction)
Central Coast Sub-region
• Jurien Bay Harbour
• Ledge Point Caravan Park
• Jurien Bay Caravan Park
• Cervantes Caravan Park
• Skydive Jurien Bay
Page 21 of 60• Jurien Bay Hotel
• Jurien Bay to Cervantes Trail Development
• Sandy Cape Campground Upgrade
• Lobster Shack Redevelopment, Cervantes
Central East Sub-region
• Merredin Tourist Park - 20 New Chalets
Central Midlands Sub-region
• Moora Airport for Recreational Flying Accommodation and Plane Terminal
• New Norcia By-pass and lookout, internal visitor infrastructure
Wheatbelt South Sub-region
• Dome Café and Accommodation, Narrogin (under construction)
• Dumbleyung Bluebird Festival Development
• Wave Rock Airport Terminal, Hyden
• Mary’s Farm Cottages at Cambinata Yabbies, Kukerin
Page 22 of 605.0 Strategic Alignment – International/ Federal/ State Context and
Priorities
This Strategy has been developed to guide the contribution of Regional Development to
the State Government’s objective to increase the value of tourism in Western Australia to
$12 billion by 2020. The Strategy is available on the Tourism Western Australia website,
http://www.tourism.wa.gov.au/About%20Us/Growing_tourism/Strategy/Pages/default.aspx.
It provides a regional strategic response to the seven outcome areas developed by
Tourism Western Australia, the 2020 State Tourism Strategy and highlights where
Regional Development can make the most effective contribution.
Seven Outcome Areas
• Brand
• Infrastructure
• Business travel
• Asian markets
• Events
• Regional travel
• Indigenous
Tourism WA Goals
• Tourism enabling infrastructure in regional WA
• Australia's best regional events calendar
• Improved caravan, camping and self-drive experiences
• Extraordinary regional experiences, including nature-based, adventure based and
food and wine
Regional Goal
• Increase average estimated visitor nights and maintain the number of overnight
visitors
Role of Regional Development
The contribution of Regional Development will be in the areas of industry and
infrastructure development; however destination marketing will continue to be provided by
Tourism WA and the regional tourism associations. The key elements of the regional
development contribution will be:
• Infrastructure Development: Support of a network of iconic and core attractors to
regional WA. This can link to a variety of nature based experiences and build upon
the strategic advantage of the Region in regard to Aboriginal tourism, camping and
caravanning, nature based and marine opportunities.
• Events Support: Development of a network of regional events that can leverage
visitation and length of stay as a primary objective and related sector investment as
a secondary objective, for example food and wine events. This recognises the
Page 23 of 60important link the 2020 State Tourism Strategy makes to business visitation and the
opportunity to link to regional trade delegations.
• Industry Development: Assist regional industry to collaborate and develop
packaged holiday options, targeting national and international market sectors with
an emphasis on wholesaling and web based packaging at a regional and inter
regional level. Regional Development can assist industry to take up market ready
programs especially in regard to Asian visitor market opportunities and better
prepare for growth in overseas market visitation through improved tourism
packaging.
5.1 Tourism WA’s Five A’s of Success
Tourism WA recommends that tourism business, ideas and strategies be considered
within the context of the five A’s of tourism: Attraction, Access, Accommodation,
Awareness and Amenities, as they are essential components of successful tourism
destinations and businesses.
This Strategy is framed around the following definitions for Tourism WA’s five A’s of
success:
1. Attraction – what brings visitors to the Region?
A tourist attraction is the place of interest that tourists visit when travelling for leisure.
Typically an attraction is visited for its cultural value, historical significance and natural
or built heritage 25.
2. Access – how can visitors get to the Region?
Transportation is needed to allow tourists to access their place of interest, from where
they live to where they are visiting25. This includes how tourists get to WA and Perth
and then how they access the Wheatbelt. In the Wheatbelt, roads serve as the most
significant form of access for tourists.
3. Amenities – how do facilities make it easy for the visitor to have a good
experience?
Amenities are the services that are required to meet the needs of tourists while they
are travelling for leisure. Amenities include but are not limited to public food and
beverage outlets, toilets, signage, information bays, visitor centres and
telecommunications25.
4. Accommodation – Where visitors can stay?
A proliferation of tourist accommodation from basic camping and backpacking to
motels, hotels and farm stays are required to successfully cater to all traveller types25.
Most Wheatbelt towns are small and unlikely to have large accommodation facilities.
For the same reason, there is relatively little four and five star accommodation.
25
Tourism WA (2009), ‘Five A’s of Tourism’
Page 24 of 605. Awareness – How do visitors find out about the Region?
Awareness in the form of marketing, digital presence and attitude of the local
population and local tourism organisations are all necessary when interacting with
tourists, to ensure the destination encapsulates a strong positive experience25.
5.2 Additional WDC A’s of Success
In the preparation of this Growth Strategy, the Wheatbelt Development Commission
recognised that Wheatbelt Tourism would benefit from two additional A’s for successful
destination development. These are:
6. Activities – what can visitors do after they arrive
Activities, as opposed to attractions, are interactive ventures or ‘things to do’ that
encourage visitors to engage, explore and extend their stay in the Region. Activities
include adventure sports, motorsports, water-based activities etc.
7. Ability – Governance capabilities
Ability is the need to connect and build the capacity of tourism groups, operators and
local governments across the Region to enhance efficiency and sustainability of
governance, business acumen, and to mange seasonal fluctuations in the tourism
industry.
The following diagram represents the seven A’s of Wheatbelt Tourism success.
1.
Attractions
7. 2.
Ability Access
7 A's of
Wheatbelt
6.
Tourism 3.
Activities
Success Amenities
4.
5.
Accommodation
Awareness
Page 25 of 606.0 Current Industry Profile
Key Highlights:
• Natural, built and heritage products (including Aboriginal heritage) are central to the
Wheatbelt tourism industry
• The tourism industry in the Wheatbelt is governed by a complex network of industry
operators and organisations
• After the SWOT analysis, key issues are defined according to the seven A’s of Wheatbelt
tourism success
Largely oriented around nature-based tourism, recreation and built heritage, the Wheatbelt
has a variety of offerings; yet the vastness of the Region (154,862 km2), the extreme
change in landscape from the coast to inland and the numerous disconnected micro
businesses means it is a challenge to present the Region in a coordinated and clear way.
6.1 Wheatbelt Tourism Product
A vast array of Wheatbelt tourism assets is attached in Appendix 1. These include first-tier
icons of New Norcia, The Pinnacles, Wave Rock and Wildflowers
Second-tier tourist attractions;
• Trails;
• Events;
• Museums/discovery centres;
• Recreational activities;
• Nature hotspots; and
• Transport infrastructure.
It is also important to distinguish Wheatbelt tourism products in terms of the feelings they
evoke, including authenticity, freedom and friendliness, wide open spaces, uncrowded and
great value. Understanding these feelings assist in defining the Region’s visitor appeal.
The diagram below is a compilation of words, feelings and descriptions elicited from
Wheatbelt tourism industry stakeholders during meetings held for the drafting of this
growth strategy.
Page 26 of 60The seven A’s of successful destination development have been used to analyse the Region’s four first-tier icons listed below.
First-tier Icons Attraction Access Activities Amenities Accommodation Awareness Ability
Wave Rock High Medium Medium Low Medium High Medium
Pinnacles High High Medium Medium High High Medium
New Norcia Medium High Medium Low Medium Medium Medium
Wildflowers High Medium Low Low Low Medium Medium
Wave Rock
Maintains international visitor numbers but access and amenity are sub-optimal.
Pinnacles
Sound amenity infrastructure but lacks connection to surrounding activities.
New Norcia
A private operator with significant built heritage upkeep that is difficult to support with Government funding. The tourism industry may not
necessarily suit New Norcia’s monastery operations.
Wildflowers
The Wheatbelt is a biodiversity hotspot with unique wildflowers but WA is no longer seen as the international/national wildflower
destination.
These products are at varying levels of maturity and require specific programs to ensure they remain international/national tourism icons.
While these first-tier icons are recognised at an international level, their recognition on a domestic level serves as en-route destinations to
other regions in Western Australia; Wave Rock is on the way to Esperance, the Pinnacles are on the way to Kalbarri and Ningaloo, and
New Norcia and the Wildflowers are on the way to the Pilbara.
The Wheatbelt South is also a major tourism route, on the way to Albany and the South West; however, it does not currently have an
established iconic anchor to encourage visitors to stay.
Page 27 of 606.2 Key Stakeholders
The tourism industry in the Wheatbelt is a complicated maze of industry operators and organisations. The following diagram reflects the
current structure and their interactions of the Wheatbelt tourism industry. Appendix 2 lists these stakeholder organisations.
Page 28 of 606.3 Strengths, Weaknesses, Opportunities, Threats
An analysis of the Wheatbelt’s strengths, weaknesses, opportunities and threats (SWOT) is important to gauge the current status of the Region’s
tourism industry and what strategies may be best suited for its future growth.
The SWOT below was compiled from both desk top research and in consultation with industry stakeholders including Tourism WA, Australia’s
Golden Outback, Australia’s Coral Coast, Experience Perth and local regional tourism groups and organisations.
Page 29 of 606.4 Key Issues
The Wheatbelt’s key issues and gaps are outlined below, using the seven A’s of successful destination development:
Attraction – what brings Access – how can visitors get Activities – what can visitors do Amenity- quality of the
visitors to the Region to the Region after they arrive destination
Key Issues Key Issues Key Issues Key Issues
• Poor infrastructure around • Public transport gaps •Product packaging gaps • Poorly situated visitor facilities
some • High reliance on self-drive •Disconnection between products along major routes
internationally/nationally • Relatively low presence of that share location or activity • WIFI provision from operators
recognised tourism icons/ bus tour operators relationships not widespread
assets • Poor road and coach access • Inconsistent and disconnected • Some remaining
• Small operators may be in some areas event promotion telecommunications signal gaps
unable to afford to invest in • Some trails are tired and lack • Pressures increasing on
infrastructure and interpretation sensitive environment and
participate in marketing • Minimal Aboriginal interpretive cultural heritage
and membership to experiences
multiple organisations • Remote and environmentally
sensitive product difficult to
protect
Accommodation – where visitors can Awareness – overall profile and brand for Ability –governance capabilities
stay the Region
Key Issues Key Issues Key Issues
• Inconsistent quality, variety and • Confusing local, sub-regional and regional • Inconsistent visitor servicing (LGA vs. CRC vs.
supply branding visitor centres/volunteers)
• Minimal international standard • Duplication and uncoordinated digital • Confusing network of governing bodies
accommodation marketing • Confusing and unclear governance structure
• Lack of catered accommodation for • Low number of industry familiarisation tours • Lack of coordination and communication
self-drivers not caravanning or • Lack of clarity of target markets between governing bodies
camping • Inconsistent and varying levels of digital • Low level of capacity-building service
• Lack of accommodation at short- professionalism, e.g. website presentation provision from State tourism organisations
notice in peak season with large • Limited promotion of events, activities, • Lack of reliable statistical data at regional,
distances between towns inhibiting accommodation and attractions sub-regional or LGA levels
easy access to alternatives • Low levels of digital access and capacity in • Disconnected privately-owned micro operators
parts of the Region
Page 30 of 607.0 Wheatbelt Tourism Growth Priorities
7.1 Industry Vision
An outward looking, well-integrated Wheatbelt tourism industry that is flexible,
harnessing opportunities from existing and emerging markets
7.2 Target
Considering the strength of the Wheatbelt’s existing self-drive, domestic market and
the fact that international tourism expenditure has quadrupled over the previous
decade and there is now significant private investment in tourism, this Strategy’s
growth targets are:
1. To increase the value of industry from $245 million in 2015 to $301
million in 2020
2. To increase the number of jobs from 1,560 to 3,120 in 2020
3. To increase the average estimated visitor nights from 3.3 nights to 4.0
nights and maintain the number of overnight visitors
In 2014/15, the Wheatbelt received a total of 676,700 overnight visitors both
domestic and international. In the same year, there were a total of 2,265,700
estimated visitor nights. This equates to an average length of stay of 3.3 nights.
In 2013, the Wheatbelt received a total of 666,800 visitors, with an expenditure of
$245 million 26. This equates to an average of $367 expenditure per visitor.
Please note, this strategy acknowledges it is comparing two different years of data
for average length of stay and average expenditure per visitor. Due to the
unavailability of consistent statistical information it assumes a visitor spends
approximately $111 per day.
This strategy aims to increase the average length of stay from 3.3 nights to 4 nights,
whilst maintaining the total number of visitors. This would naturally increase each
visitor’s expenditure to $445 per visitor and in turn increases the total visitor
expenditure to $301 million per annum by 2020. The table below outlines these
target outcomes.
2020 Target Outcome:
• Total of 676,700 overnight visitors maintained
• Average length of stay is 4 nights
• Average expenditure per visitor increased from $367 to $445
• Total visitor expenditure increased by 23% to $301 million by 2020
26
Tourism Research Australia (2013), International and National Visitor Survey, Tourism Research Australia, Canberra
Page 31 of 60The 2020 Target Outcome has been designed with the following in mind:
• Many iconic nature-based attractions in the Region have fragile environments
and/or are Aboriginal sacred sites with cultural sensitivities; and
• Marketing to increase the number of visitors and new markets to the
Wheatbelt is cost prohibitive for small business and small tourism
organisations. Until such time that a Wheatbelt-wide tourism organisation can
utilise economies of scale for destination marketing, this strategy seeks to
solely increase the nights stayed by existing visitors.
Page 32 of 607.3 Growth Strategy Development Process
In order to formulate a strategy embedded by local industry knowledge, experience and inspiration, the Wheatbelt Development
Commission followed a series of steps including in-depth consultation with industry and stakeholders.
SWOT*, ISBP# Stakeholder Strategy
Project Desktop Research Consult with Options Analysis
and Gap Consultation Development Review and
Conception and Analysis Industry and
Analyses Outline product Evaluation
Phase Current industry Organisations Stakeholder Prioritisation
profile Identification of identification and destination Evaluate the
Identifying the Align with Evaluation and
gaps in current priorities degree of impact
need for tourism Review of tourism industry Consultation prioritisation of
tourism market Development of this tourism
value add product strategic with key tourism potential
Identification planning growth strategy strategy has had
Regional economic groups tourism product
and analysis of to enable on the
visitations and research on Feedback on Feedback from following
high level industry plans Wheatbelt's
overview of current and analysis of issues key tourism feedback from
strengths and and attract tourism sector
current product future trends and solutions groups stakeholders
solutions investment
* SWOT is the abbreviation for Strengths, Weaknesses, Opportunities and Threats. It’s a method adopted to assist in analysis.
# ISBP is the abbreviation for Issues, Solution, Benefits, Proof. It’s a method adopted to assist in business planning.
Page 33 of 60You can also read