GUALA CLOSURES INVESTOR PRESENTATION - SPACE4 SPA
←
→
Page content transcription
If your browser does not render page correctly, please read the page content below

Guala Closures
Investor Presentation
Palazzo Parigi, Milan – 2nd May, 2018
Disclaimer
This document has been prepared by Space4 S.p.A. (“Space4”), Guala Closures S.p.A. (“Guala Closures”) and Lazard exclusively for use in the
presentation of the envisaged business combination between Space4 and the Guala Closures.
Neither this presentation nor any part or copy of it may be transmitted into the United States or distributed, directly or indirectly, in the United
States, Australia, Canada or Japan or any other jurisdiction where distribution of this presentation and of any information contained in it may be
restricted by law.
Persons into whose possession this document comes should inform themselves about, and observe, any such restrictions.
This document is not intended for potential investors and is not to be used or considered as on offer to purchase or subscribe for, or a solicitation
of any offer to purchase or subscribe for, any securities, nor shall it or any part of it or the fact of its distribution form the basis of, or be relied on
in connection with, any contract or investment decision. This document has been prepared separately from any proposed offering of securities and
as such and to such extent information in this document has been reviewed and approved by Space4 and Guala Closures. The securities of Space4,
before or after the business combination, have not been, and will not be, registered under the United State Securities Act of 1933, as amended
(“Securities Act”), or under the corresponding rules and regulations applicable in Canada, Japan, Australia or in any other jurisdiction where an
offer is unlawful absent exemption or authorization by the competent authorities and may not be offered or sold to any national, resident or
citizen of the United States, Canada, Australia, Japan or any other county where an offer is unlawful absent exemption or authorization by the
competent authorities.
This document constitutes neither an offer of securities in Italy pursuant to article 1, (t) of the Legislative Decree No. 58 of 24 February 1998, as
amended, nor an offer of securities for sale in the United States and in any other jurisdiction
The information contained and the opinions expressed in this document have not been independently verified. In particular, this document
contains forward-looking statements that are based on current estimates and assumptions made by the management of Guala Closures to the best
of their knowledge. Such forward-looking statements are subject to risks and uncertainties, the non-occurrence or occurrence of which could
cause the actual results including the financial condition and profitability of Space4 and the combined entity resulting from the envisaged business
combination to differ materially from, or be more negative than, those expressed or implied by such forward-looking statements. Consequently,
Space4, Guala Closures and their respective management can give no assurance regarding the future accuracy of the estimates of future
performance set forth in this document or the actual occurrence of the predicted developments.

The data and information contained in this document are subject to variations and integrations. Although Space4 reserves the right to make such
variations and integrations when it deems necessary or appropriate, Space4 assumes no affirmative disclosure obligation to make such variations
and integration and no reliance should be placed on the accuracy or completeness of the information contained in this document.
No person accepts any liability whatsoever for any loss, damage or other consequences howsoever arising from the use of this document or of its
contents or otherwise arising in connection therewith.
By accepting this document, you agree to be bound by the foregoing limitations.

Today’s speakers

   Marco             Anibal        Francesco        Paolo             Claudia
   Giovannini        Diaz          Bove             Ferrari           Banfi
   Chairman and      Group CFO     Group COO        Group CMO         Group FD and
   Group CEO                                                          Investor Relation

                  Roberto          Carlo             Edoardo
                  Italia           Pagliani          Subert
                  Senior Partner   Senior Partner    Senior Partner                       1
Table of contents

 1     Introduction

 2      Why Guala Closures

 3      Positioning and Trends in Key Target Markets

 4     Operational Excellence

 5      Financial Performance

 6     Transaction Description
1. Introduction
Space Holding – a history of successful combinations

                             • Space4 is the fourth and largest SPAC ever promoted by Space Holding listed on December 2017
                                  on MIV (Market for Investment Vehicles) with a market capitalization in excess of Euro 500m

                             • Proven track record of Space Holding team, with over Euro 400m equity invested to date in three
                                  success story IPOs: FILA, Avio and Aquafil, with a current combined market capitalization of c.
                                  €1,7bn

                                      – FILA total shareholders return: c. +158% (x2.6)                      Listed in June 2015

                                      – Avio total shareholders return: c. +68% (x1.7)                       Listed in April 2017

                                      – Aquafil total shareholders return: c. +37% (x1.4)                    Listed in December 2017

                             • Seeking for the next IPO champion: an Italian company with a leadership positioning, international
                                  footprint, untapped growth potential, entrepreneurial talent and a strong management team

                                                                                                                                       2
Source: Space4 information
Note: Data as of 24th of April 2018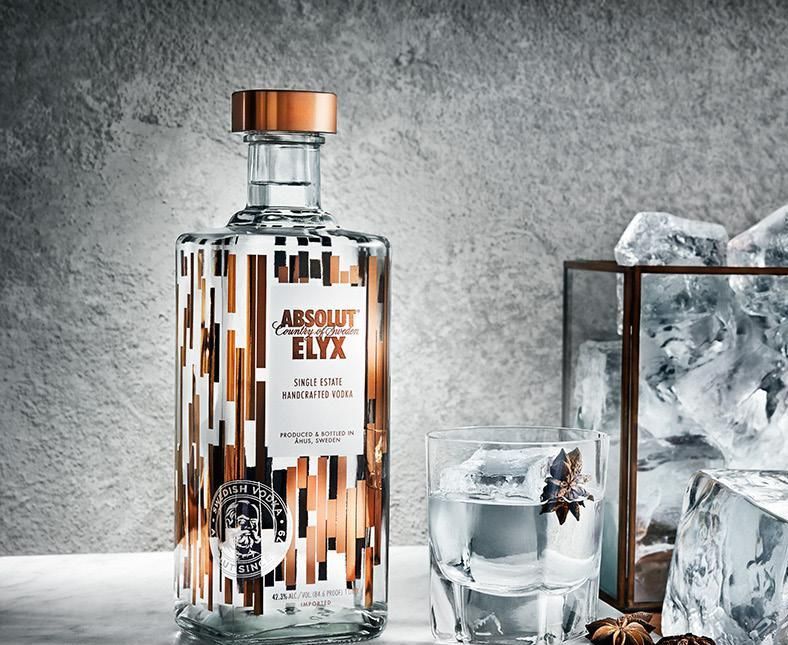
Our target of choice: Guala Closures

  • The Global leading producer of specialty closures for the spirits and wine
       industry with almost €600m turnover

  • A trusted partner to most global and local spirits and wine producers for
    the last 40 years

  • A business model driven by unique technology & innovation capabilities,
    supported by an R&D DNA and by a state-of-the-art manufacturing
    footprint spread across 5 continents

  • A resilient story of growth - margins consistently at 20%+ in the last 15
       years

  • A natural consolidator in a fragmented market space, ready for additional
    expansion opportunities

  • An entrepreneurial management team with a long-lasting experience in
    the sector and deeply invested in the business

A single transaction deploying €600m of cash equity for an aggregate equity value of approx. €700m
                                                                                               3
Source: Guala Closures information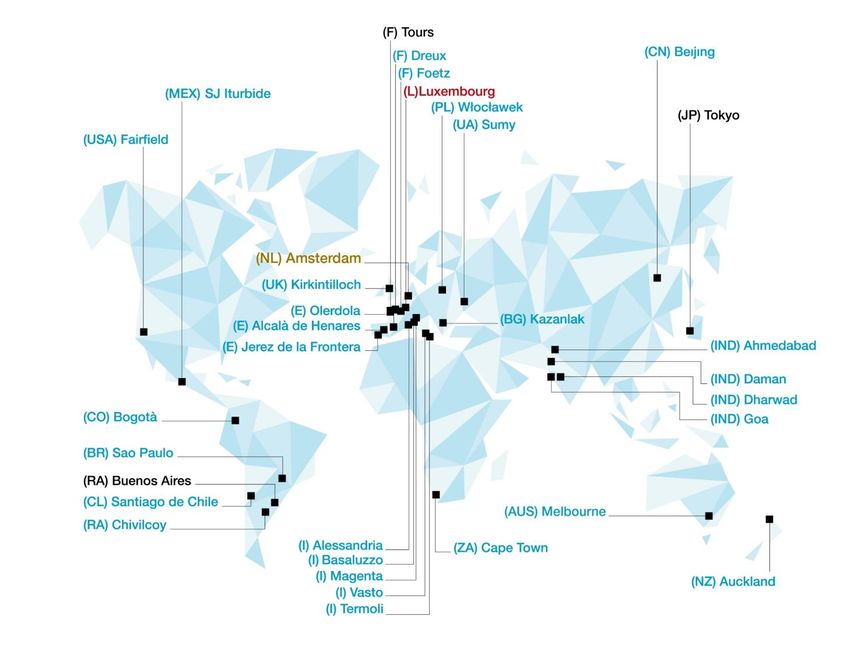
A truly global firm

>14bn
Closures sold worldwide

5
Innovation Centers

27
Production sites across
5 continents

100
Countries where we have
built strong client
partnership

>4,200
Employees                             4
 Source: Guala Closures information
Guala Closures leadership team
• A close-knit team working together more than 20 years
• Structured organization chart ready to sustain the future growth
Marco Giovannini, Chairman and Group CEO Anibal Diaz, Group CFO
Professional experience in packaging: 36 years Professional experience in packaging: 32 years
Joined Guala Closures Group: 1998 Joined Guala Closures Group: 2000
Francesco Bove, Group COO Paolo Ferrari, Group CMO
Professional experience in packaging: 37 years Professional experience in packaging: 36 years
Joined Guala Closures Group: 1999 Joined Guala Closures Group: 1981
5
Source: Guala Closures information
2. Why Guala Closures
      Marco Giovannini
    Chairman and Group CEO
The leadership team is not alone: our general managers across the world
6Guala Closures at a glance
7The world’s leading specialty closures producer
#1 player in high value-
A global champion - Euro Partner to global and Pioneer in closures Proven track record of
added closures for spirits
535m sales in FY17 local beverages players technology growth
and wine
Safety Luxury Wine Roll-on Others
Sales breakdown by product Sales breakdown by destination market Sales breakdown by geography(3)
(2)
Other (1) Non-alcoholic Africa
5% 14.0% Oceania 3%
Pharma
1% 9%
Roll-on Safety Oil &
44% Asia
28% vinegar Europe (West
13%
2% & East)
Spirits 54%
63%
Wine
20%
Wine Americas
20%
20% Luxury
3%
Source: Guala Closures information
(1) Other includes Pharma, PET and other revenues 8
(2) Non-alcoholic includes mineral water, beverage, other markets, PET and other revenues
(3) Revenues breakdown refer to countries from which the product is soldOur Mission
• Protect your brand
• Create your value
9Global counterfeiting never ends
Percentage of
counterfeit
S P I R I T S A R E T H E 4 TH L A R G E S T products in total
C O U N T E R F E I T E D P R O D U C T C AT E G O R Y manufactured
goods:
25% Audiovideo
30% OF THE ALCOHOL CONSUMED IN THE 21% Fashion
WORLD IS UNREGISTERED 20% Pharmaceutical
12% Spirits
12% Toys
* source Olajide Oyewole 10% Perfumery
5% Watches
* source INDICAM
“Illicit spirits are a huge social problem in India, both in terms of
yearly deaths and support to the illegal economy”
– Former manager, United Spirits
10A pioneer in multicomponent non-refillable systems
Model 1612A safety closure:
• High protection closure
• Includes covert and overt anti-
counterfeit technologies
• 11 components
Overcap
• Assembled at high speed HIPS
Screw Cap
ABS
Tamper-evident ring
ALUMINIUM
Sealing wad
Valve system LDPE
PC
Pourer
PC
Sleeve Glass balls
HIPS GLASS
Washer
LDPE
11
Source: Guala Closures informationSpirits: premiumisation race boosts luxury closures offer
12Reinventing closures: from commodity to high value-added
Premiumisation
Standard Luxury
Safety Highly Decorated Premium
€15 €70 €250 €125 €700 €2,200
13
Source: Guala Closures informationWine: shift from cork to screw caps
€40 €90
February 2018
14
Source: Guala Closures informationIs it the closure or the wine?
Overall impact of different closures on wine quality
More than 5 years ageing
15
Source: Guala Closures informationScrew caps: from easy-to-use to value added
16An innovative and broad product line for wine closures
Standard Premium Roll On TE
Designed to maintain Top quality closure The first Tamper Evident
quality, freshness and full with an internal system specifically
flavour thread for still wines dedicated to standard
and a premium aluminium closures
finishing
Divinum Savin Premium
WAK
Content quality Content quality Content quality
Content Quality Content Quality
preservation
preservation preservation
preservation
Content Quality
preservation
preservation
Cost Anti- Cost Anti- Cost Anti-
Cost effectiveness
effectiveness Anti tampering
tampering Cost effectiveness Anti tampering
effectiveness tampering Cost effectiveness
effectiveness Anti tampering
tampering
ProductPackaging Brand
Brand Protection
ProductPackaging Brand ProductPackaging Brand
innovation Brand Protection Brand Protection
innovation
innovation protection innovation protection innovation
innovation protection
Packaging Packaging
Packaging
exclusivity and Packaging
exclusivity and
Packaging
Packaging
exclusivity and
exclusivity
distinction and exclusivity
distinction and exclusivity
distinction and
distinction distinction distinction
Oenoseal®
Content quality
The new range of liners with different level of Content Quality
preservation
preservation
oxygen permeability rates
Cost Anti-
Cost effectiveness
effectiveness Anti tampering
tampering
Onyx Ivory Coral
ProductPackaging Brand
by Oenoseal® by Oenoseal® by Oenoseal® innovation
Brand Protection
innovation protection
Packaging 17
Packagingexclusivity and
exclusivity
distinction and
Source: Guala Closures information distinctionA pioneer, R&D DNA: 140 patents(1) / 50 projects in pipeline
Premiumization Consumer Trends and
Customer needs
strategy insights market studies
Content quality
preservation
Content Quality
preservation
Cost Anti-
effectiveness
Cost effectiveness
tampering
Anti tampering
Brainstorming Product
Packaging Brand
Brand Protection
Product design innovation
innovation protection
Materials IP Protection Packaging
exclusivity and
and technics Packaging
distinction
exclusivity and
distinction
Production tools
Aesthetical
studies
Red: spirits
Lab tests Blue: wine 18
Source: Guala Closures information
(1) Patents include industrial designs and utility modelsAlways pioneering innovative closures
Strong track record in Innovation: milestones
550 2600 Nip Cap 1612 WAK
1954 1991 2002 2008 2014
1978 1993 2003 2011 2016
1031 Sabina
1235 Spring Kirk
19
Source: Guala Closures informationBringing smart-security solutions to spirits and wine market
Guala Closures partnered with Semiconductors to develop the first “Internet-of-Closures system”
Internet-of-Closure (IoC) is
For Guala Closures
Disruptive technology
First-mover advantage
Supply management
Potential for higher margin
For Brands For Consumers
Improve brand experience Product authentication
Supply chain control Tamper evident
Story telling Channel authentication
Store locator Tasting and recipes
20Gravitas: an example of a totally proprietary specialty closure
• Heavyweight filled polymer targeting luxury closures
• Plastic versatility together with metal touch-and-feel
• Greater design freedom with a wider choice of finish and weight
Mortlach Dewar’s Royal Salute Royal Salute Johnnie Ultis Chivas Zacapa Jack Daniel’s Patron
18 years Standard Eternal Reserve Walker XR 150
2014 2014 2014 2014 2015 2016 2016 2016 2017
Thanks to Gravitas we won all of the above brands over the last 3 years
21
Source: Guala Closures informationInnovating through our Italian design approach
22Trusted partner for global players and regional champions
Global Players Regional Champions
Spirits
Wine
Other
(F&B,
Pharma)
23
Source: Guala Closures information3. Positioning and Trends in
Key Target Markets
Paolo Ferrari
Group CMOThe world’s leading global specialty closures producer
Size Major specialists
(wine & spirits
closures €m
revenues)
> €500m Large closure producers with
strong presence in W&S,
accounting for a small part of
Revenues from safety closures are 6 times greater
their business than closest competitor 6x
Major generalists
Revenues from wine screw caps are 4 times greater
than closest competitor 4x
> €50m “Regional
Large packaging champions”
companies with Core specialists
limited presence in
W&S and/or closures
Core generalists
Local producers of
standard decorative
> €10m closures
Small local players
< 20% > 60% Focus
(wine & spirits closures % revenues)
24
Source: Guala Closures information2017 revenue breakdown by market & product
Others
Pharma 6%
1%
Beverages
10% Safety
44%
Wine
20%
Spirits
63%
Roll-on Luxury
16% 3%
Source: Guala Closures information 25
Beverages includes oil & vinegar, mineral water, soft drinks and other beverages
Others include Pet, other revenuesTrends in Spirits
Different market maturity drives to different market needs
            Western Markets                     New emerging markets

                                                                       India

                                                                       Africa
                                                                                26
Western markets: new consumer aspirations
PREMIUMISATION CRAFT FLAVOURING WELLNESS ETHICAL INTERNET
27
Source: Guala Closures informationNew emerging markets: consumer aspirations
AFFORDABLE SMALL PACKS FRIENDLY TO USE SAFETY GLOBAL BRAND LOOK-LIKE
28
Source: Guala Closures informationGrowth driven by premium and emerging markets
Global market size by value – 2011-2021 Top Regions Market size by value - 2016
US$b, CAGR 11-16 | 16-21 (%) US$b, CAGR 16-21 (%)
CAGR CAGR
4.6% 2016-21 (%) 2016-21 (%)
828.8
Asia (excl. Japan) 297.3 7.3%
5.4%
662.1 Latin America 41.0 3.2%
499.2 6.9% Africa 19.5 8.2%
508.8
357.8 West Europe 105.4 1.4%
Asia (excl. Japan),
Latin America, 227.2 North America 91.9 2.8%
Africa
East Europe 63.5 0.4%
Europe,
North America, 304.3 329.6 1.6% Japan 33.8 0.8%
281.6
Japan,
Australasia Australasia 9.7 2.5%
2011 2016 2021
29
Source: GlobalDataLeader in fast-growing end markets
# 1 globally in the fastest growing safety closures market(1) Trusted partner of top spirits producers for premium/luxury
Guala Closures’
Billion 26.0 27.0 market share(2)
Units +8.3%
16.0% 23.0%
>60%
84.0% -1.0% 77.0%
1 Safety closures
for spirits
Total market Total market
2011 2016
Standard Safety CAGR 2011-16
Reference player for the regional brands(2) Positioned in the fastest growing segments
Volume CAGR 2016A-21E closures markets(3)
Global
brand 30% Luxury +8.2%
70% Regional Safety +4.2%
brands
Source: Guala Closures information
(1) Guala Closures reference market; i.e. the market that Guala Closures was historically competing in 30
(2) Represents market share by volume
(3) Guala Closures core market; i.e. including metal screw and core cork closures (all pack types) and excluding other closuresTrends in Wine
Shift from cork to wine screw caps
# Wine Screw Caps 2008A-2021E
 (billion units)

                                     31
Source: Euromonitor
Increasing screw caps penetration
Wine screw caps global market
Penetration across Still & Sparkling Wines
Total market (excludes Other)
(billion units)
% Wine
30.2 Screw Caps
29.0 100
90
80
70 85%
60 70%
82.0% Other 77.9%
50
40 44%
42%
42.6%
30
20
22.1 18.5%
18.0% Wine
17% 16.5% 16%
% 10
Screw 8%
0
2011 Caps 2016 0 5,000 10,000 15,000 20,000 # Closures
(millions, by
bottling location)
Guala
Closures’ 1 Screw caps
market
>30% for wine
share
32
Source: Guala Closures informationWine screw caps growth drivers
Market trends Screw caps competitive advantages
Growth in export Quality Guarantor
Industrial Approach
Globalization
Supply Proximity
Growth in new emerging markets Widespread acceptance
Cost saving Superior value Proposition
the driving force behind screw cap market expansion
33
Source: Guala Closures informationWine global exports by value
Euro billions
29
28
26 26
25
23
21
20 20
18 18
16
15 15 15
12 12
2000 2001 2002 2003 2004 2005 2006 2007 2008 2009 2010 2011 2012 2013 2014 2015 2016
34
Note: Wine global exports by value considered as the sum of exports of 83 examined countries
Source: OIVWine production is highly concentrated in Guala Closures key countries
Main Production Countries and Guala Closures Industrial
Countries, top 8 by wine production 2016
presence
(Mhl liters)
267 Worldwide production
203
Chile 10.1 3.6 %
South Africa
10.5
3.8 %
China 11.4 4.1 %
Australia 13 4.7 %
USA 23.9 8.6 %
Spain 14.6 %
40.5
France
44.8 16.0%
Italy
49.8
18.0% Market covered by Guala Closures
2016
% of total 73.4 %
35
Source: OIVConsumption growth is expected to accelerate especially in new emerging
markets
Countries, top 7 by wine consumption (2016) Regions, expected wine consumption CAGR (2016-2020)
(Mhl liters)
CAGR
242 Worldwide consumption +2.2%
141.6
China
17.3
USA North America Europe Asia Pacific
31.8 CAGR CAGR CAGR
+1.8% +1.1% +4.0%
UK 12.9
Germany
20.2 LATAM Africa & M. East Oceania
Spain 9.9 CAGR CAGR
Europe +3.8%
Italy +4.2%
22.5
France
27.0
Growth is expected to be faster in Emerging
2016 Regions (China included)
% of
total 58.5%
Source: OIV Osservatorio Vini, Passport 36Trends in beverages: the glass bottled water market
Bottled water trends
• Bottled water market forecasted growth 2016-2021 at 3.2% CAGR
• Luxury segment growth in both western and new emerging markets

                                     Paris                         Beijing

                                                                             37
Source: Guala Closures information
Mineral water and soft drinks markets growth
Global volumes of Mineral Water and Soft drinks glass bottles by type of closures – (2011-2021)
Mln units, CAGR 2011-16-21 (%) Others Metal Screw
Mineral Water (Glass) Soft drinks (Glass)
1.3% CAGR
-0.5% 2016-21
102.8
98.5 96.1
3.2% CAGR
1.3% 2016-21
27.2 73.5 1.0%
23.2 74.9 69.9
21.7
12.0 4.0%
9.9 9.8
13.3 15.2 2.7% 29.3 2.2%
11.8 23.6 26.2
2011 2016 2021 2011 2016 2021
Fastest growing regions Fastest growing regions
CAGR 2016-21 CAGR 2016-21
Latin Eastern North Eastern Western
China
America Europe America Europe Europe
4.9% 3.6% 27.5% 3.9% 2.1% 1.6%
38
Source: PassportGrowing luxury trend in the bottled mineral water segment
394. Operational Excellence
Francesco Bove
Group COOGlobal footprint to serve clients across geographies
Western Europe
(L) Luxemburg
(N) Netherlands
Eastern Europe (F) Tours
(F) Dreux
(UK) Kirkintilloch
(S) Olerdola
Western Europe (S) Alcalà de Henares
€112m (S) Jerez de la Frontera
(I) Alessandria
€74m (I) Basaluzzo
Asia (I) Magenta
€178m (I) Vasto
Americas €191m (I) Termoli
€72m Eastern Europe
(PL) Wloclawek
€76m (BG) Kazanlak
€107m (UA) Sumy
€120m Americas
(USA) Fairfield
Oceania (MEX) SJ Iturbide
(CO) Bogota
(BR) Sao Paulo
(CL) Santiago de Chile
€49m (AR) Buenos Aires
€49m (AR) Chivilcoy
Asia
€17m (CN) Beijing
(JP) Tokyo
€25m (IND) Ahmedabad
Sales offices (IND) Daman
(IND) Goa
Africa (IND) Dharwad
2017 net revenues: country from which the product is sold
2017 net revenues: country to which the product is sold Oceania
(AUS) Central West
(NZ) Auckland
Africa
27 plants and 3 sales offices in 21 countries on 5 continents (ZA) Cape Town
Source: Guala Closures information
40Full state-of-the-art manufacturing capabilities
World-class design and engineering
Vertical integration
In-house moulding
Aluminium sheet cutting and de-greasing
capabilities
High productivity
High-speed and customised assembly
Full suite of decoration capabilities
Capacity utilization and
Focus on continuous improvement and expansion
quality control
41Unique design and printing capabilities
Product
3D and Pilot Product Production
3D design
samples process tooling validation equipment
FMEA (1)
Case study: Sunrise closure
45 days for pilot
2 weeks to plastic and Closure validated Up to 9 months
3 days to print
conceptualise FMEA(1) process aluminium for scale for mould
prototypes
new design moulds to be production development
ready
c.12-18 month process from concept development to industrialisation
42
Source: Guala Closures information
(1) FMEA: Failure Modes and Effects AnalysisProprietary, in-house approach to manufacturing and related innovation
Sources of competitive advantage
In-house mould design and production capabilities
Equipment
Retention of IP rights through direct mould ownership
Long-lead time for mould development contributes to
locking in customers
In-house mould capabilities
Guala Closures Tools(1) designs and manufactures 70% of our
moulds
Moulds
Dedicated selection of components from leading world
suppliers (such as Mould Masters, Husky and Hasco)
43
Source: Guala Closures information
(1) Guala Closures Tools is located in the Guala Closures Bulgaria plant and has 55 dedicated employeesOur approach to manufacturing and production targets fully sustainable
development
Based on commitments we designed in 2011, our sustainability strategy
focuses on 3 pillars (Planet, People and Business) and 12 indicators, all
published regularly in our sustainable development annual report
44Emission reduction policies
Objective: offset part of the CO2 emissions
generated by the factories
Strategy: to fund reforestation projects
and/or convert energy produced into
renewable sources
2012 - 2018
Approximately 200,000 tonnes of CO2
compensated
Reforestation Projects
Social Reforestation programmes supported by GCG Social schools projects in India
Peru, India, Colombia, Mexico • 15,080 students of elementary schools
300,000 trees • 322 sessions
Over 5,600 people involved • 110 schools
455. Financial Performance(1)
Anibal Diaz / Claudia Banfi
Group CFO / Group FD and Investor Relation
(1) Financial performance figures have been taken from GCL Holdings consolidated accounts - to be considered as a proforma of Guala Closures Group consolidated
accounts after Group Structure reorganizationA consistent track record of profitable growth
Net Revenues CAGR 2007A-17A +5.1% / Adj EBITDA CAGR 2007A-17A +5.2%
(in €/m)
00.0 570 30%
521 535
497 494 488 500
00.0
418 25%
00.0 371
326 325 311
00.0 22% 20%
22% 21% 21% 21% 20% 21% 21%
20% 20% 20%
20%
00.0
103 102 106 103 111 118 15%
81 88 96
00.0 67 67 69
- 10%
2007A 2008A 2009A 2010A 2011A 2012A 2013A 2014A 2015A 2016A 2017A 2018E (1)
Net Revenues Adjusted EBITDA Adjusted EBITDA Margin
Resilient business profile with margins consistently at 20%+ over the years
Source: Guala Closures information 46
(1) Calculated on 2018 mid-point guidanceEnhanced by M&A
Guala Closures has been able to expand via M&A consolidating its presence in new segments and strategic markets
Axiom
Technologia
Propack
70% acquired 100% acquired
Guala Closures
Danik MCG Limat
delisting
70% acquired 100% acquired Assets acquired
2007 2008 2009 2010 2011 2012 2013 2014 2015 2016 2017
Auscap Guala Closures Plastivit
CapMetal ICSA
100% Mexico 100% acquired
70% Assets
Stake increased to
acquired acquired
ESVIN 100% DGS
Assets acquired 70% acquired
Pharma Trade
100%
New markets (e.g. Australia, Successful integration
Poland, Ukraine, Africa) Consolidated market
resulting in substantial
position and captured
New segments (e.g. wine, growth and cost
further market share
pharma) synergies
Source: Guala Closures information 47Consistent growth over the years
Revenue (€m) • Revenue growth between FY16 and FY17 (+7%) was
mainly driven by a positive volume/mix effect
(impact: Euro 26.9m)
600.0
560-580 • The increase in FY17 was mainly in Western Europe
580.0
and Americas, in addition to the acquisitions of GC
560.0
534.8 France, Axiom and ICSA’s activities during 2016/17
540.0 520.5 • FY16 was affected by unfavorable trend vs FY15 in all
520.0 500.3 the main currencies to which the group is exposed
500.0 (impact: Euro 24m)
480.0 • FY18E revenues are expected to grow by 6.6%(2) vs
460.0 FY17 mainly as a results of the investments in new
2015A 2016A 2017A 2018E
products, technology and capacity increase
Revenue at constant 2017 FX (€m) undertaken in FY17
CAGR 15A-17A +3.8%
496.0 497.9 534.8
• At constant exchange rates (2017), revenues grew by
a CAGR of 3.8% in FY15-17
2015A 2016A 2017A
Revenue Bridge (€m)
2.1
(24.2) (4.2) 10.0
(1.1) 7.3
(2.3) (0.3) 26.9 534.8
520.5
500.3
(1)
(1)
Volume/Mix
Volume/Mix
FX impact
Price
Other
Price
Other
perimeter
Revenues
Revenues
Revenues
Change in
2015 Net
2016 Net
2017 Net
FX impact
Source: GCL Holdings consolidated accounts - to be considered as a proforma of Guala Closures Group consolidated accounts after Group Structure reorganization 48
Note: (1) Guala Closures Management Analysis. FX impact includes translation effect, partially offset by operational measures
(2) Based on 2018 mid-point guidanceResilient EBITDA and EBIT margins
Adj. EBITDA (€m)
% margin 20.4% 20.5% 20.7% 20.7%(1)
• The increase in Adj. EBITDA in FY17 was mainly
115-121 driven by revenue growth in Western Europe and
106.4 110.6 America despite an average higher cost of
102.5
aluminium
• FY17 EBITDA has been adjusted by Euro 7.4m
non recurring costs mainly related to the M&A
sale process
• At constant exchange rates 2017, Adj. EBITDA
CAGR FY15A-17A is + 5.6%
2015A 2016A 2017A 2018E
Adj. EBIT (€m)
% margin 13.2% 14.3% 14.4%
• Adj. EBIT CAGR FY15A-17A equal to +5.8% (at
77.1 current exchange rates)
68.8 71.5
• Slight increase in D&A in FY17 compared to
previous year mainly related to the impairment of
an asset held for sale for €1.8m
2015A 2016A 2017A
49
Source: GCL Holdings consolidated accounts - to be considered as a proforma of Guala Closures Group consolidated accounts after Group
Structure reorganization
(1) Based on 2018 mid-point guidanceNet Financial Expenses and Net Income
Net Financial Expenses (€m)
Net interest
7.6% 7.0% 5.4%
expenses % of • On Nov 2016, Guala Closures reimbursed its
gross debt(1) existing bonds and issued a €510m Floating Rate
53.8
48.6 Senior Secured Note with maturity in 2021 and a
10.4 41.4 Euro 65m RCF substantially reducing its cost of
7.0
4.8 debt
10.0
• Net financial expenses for FY2016 including Euro
41.7 38.6 10m of financial expenses for debt refinancing
31.4
• Current Bond and RCF facilities expected to be
refinanced in the context of the business
2015A 2016A 2017A combination with Space4
Net interest expenses Other (2) Interest on debt refinancing
Net Income(3) (€m) and Margin on Revenues (%)
7.0%
29.0
5.0% • In FY15-16 Net Income was strongly impacted by
24.0 4.9% (4)
3.0%
significant net financial expenses accounting for
19.0 Euro 49m and Euro 54m respectively
0.9%
14.0 ~25-31 1.0% • Tax losses carried forward amount to c. Euro 190m
(0.9%) (0.7%)
9.0 with a potential tax benefit of Euro 46m for which
(1.0%)
4.0
no deferred tax assets have been accrued so far
4.8 (3.0%)
(1.0) (3.7)
(4.7)
(6.0) 2015A 2016A 2017A 2018E (5.0%)
Source: GCL Holdings consolidated accounts - to be considered as a proforma of Guala Closures Group consolidated accounts after Group Structure reorganization 50
Note: (1) Gross debt equal to total financial liabilities excluding financial liabilities vs minority. Net interest expenses adjusted for net interest expense for debt
refinancing (c. €10m in FY16); (2) Other includes exchange rate gains/losses, derivatives and other financial items (3) Including minorities (4) Based on 2018 mid-pointNWC and Capex evolution
Net Working Capital (€m)
113.5
87.0 90.8
82.7 • NWC recorded an increase in FY17 mainly due to
67.3 67.9
102.4 • integration of the acquired companies
86.9 89.1
• higher year-end DSO compared to the
(67.1) (66.2) (71.7) historical average year-end level
2015A 2016A 2017A
• increase in inventories driven by an
Trade Receivables Inventory Trade Payables
exceptional higher aluminium stock at year
end and higher finished and semi-finished
Days 2015A 2016A 2017A products
Inventory 45 46 51
Trade receivables 58 61 63 • Increasing NWC days driven by growing DOI(1) and
Trade payables (45) (45) (44)
DSO(2)
Net Working Capital 59 62 70
Capex (€m) and % on Net Revenues
6.2%
40 5.4% 7.00%
4.3%
35 31.2 5.00%
28.7
30 3.00%
22.6 6.3 • FY17 Recurring Capex relating mainly to European
25 6.3 1.00%
2.7 subsidiaries
20 -1.00%
15 -3.00% • FY17 Expansion Capex refer mainly to new
24.9 22.4 product investments such as Nip Cap 2 2nd step in
10 19.9 -5.00%
India and a new closure technology
5 -7.00%
0 -9.00%
2015A 2016A 2017A
Recurring Capex (paid) Expansion Capex (paid) % on Net Revenues
Source: GCL Holdings consolidated accounts - to be considered as a proforma of Guala Closures Group consolidated accounts after Group Structure reorganization
Note: (1) Days Of Inventories (2) Days Sales Outstanding 51Net Financial Position and Net Invested Capital
Net Financial Position(1) (€m) and Net Financial Position / Adj. EBITDA
• The increase in NFP in FY17 was affected by €17.6m of
cash outflows for the acquisitions carried out in the year,
600.0 552.5 530.0 (2) 15.0xthe exceptional increase in NWC, c. €5m of extraordinary
497.6 514.8
13.0xcosts mainly due to the “exit” process and due diligence
500.0
11.0xcosts for c. €4m of transactions costs for the refinancing
400.0
9.0x
carried out in November 2016
300.0 •
7.0x From 2018 onwards, cash flow is expected to benefit
4.7x 5.0x 5.0x ~350 (3.0x)(2)
5.0x
from:
200.0 Post cash
contribution 3.0x • EBITDA increase
1.0x • efficiency in WC
100.0 at BC
0.0 -1.0x • lower net interest expenses
2015A 2016A 2017A 2018E • FY18 NFP estimated on the basis of the expected c. €180m
cash contribution from Space4
Net Invested Capital (€m) & Adjusted ROIC(3) (%)
ROIC(3) 26.8% 27.3% 27.3%
800.0
700.0 612.6 618.3 644.3
600.0
500.0 €317m
356.2 356.6 362.2 from the delisting PPA
400.0
300.0
200.0 49.8 54.4 74.3
100.0 206.6 207.3 207.8
0.0
2015A 2016A 2017A
(4)
Fixed Assets NWC & Other Goodwill
Source: GCL Holdings consolidated accounts - to be considered as a proforma of Guala Closures Group consolidated accounts after Group Structure reorganization 52
Note: (1) Including fair value of the put option in favor of GC Ukraine NCI accounting for Euro 16.8m at year end 2017; (2) Based on 2018 mid-point guidance
(3) Calculated as Adj. EBIT / (Net Invested Capital net of Goodwill); (4) Goodwill arising from take private in 2008 and other acquisitionsPresentation wrap-up
Marco Giovannini
Chairman and Group CEOKey growth levers – Organic Growth
The luxury closure market is the main growing market
Facilitate shift towards
1 luxury
worldwide with major premium brands gaining share
across major markets
Far East: second region for Spirits market growth
Pursue further
2 geographic expansion Southern Africa: new middle class, financially healthier,
supports growth in locally produced spirits
The craft Spirits Market, supported by the millennials
Ride emerging market
3 trends
consumer trend, is heavily growing in the US, but also
spreading in Europe
Changing a simple product like a bottle to a connected
Enable emerging digital
bottle
4 requirements and
opportunities
Consumer engagement interaction, but also track &
trace, product certification and even marketing data
acquisition
53
Source: Guala Closures informationSubstantial external growth opportunities now possible
Main objectives
Improve product mix in order
Entering new markets and Increase footprint and solidify
to reach out new clients /
exploring new segments presence in larger countries
product niches
M&A Pipeline
Pharma, Labels
West Europe East Europe Americas Asia Oceania and Dispensing
Systems
Capacity increase Entry the Belarussian Penetration in the US Penetration in the Actionable
fast growing end opportunities to Further relevant
for aluminium and market and further and expansion of
growth opportunities
luxury closures expansion in Russia capabilities in Mexico markets of the Asian consolidate
region leadership in Australia in other segments
and Chile
Wine & Spirits New Verticals
54
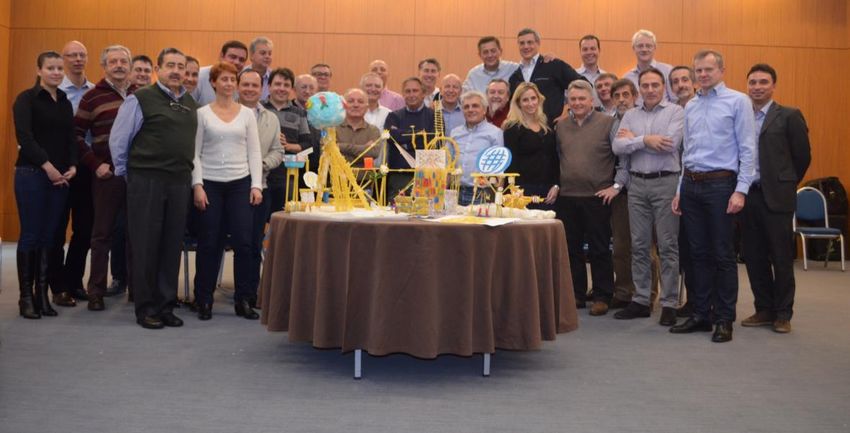
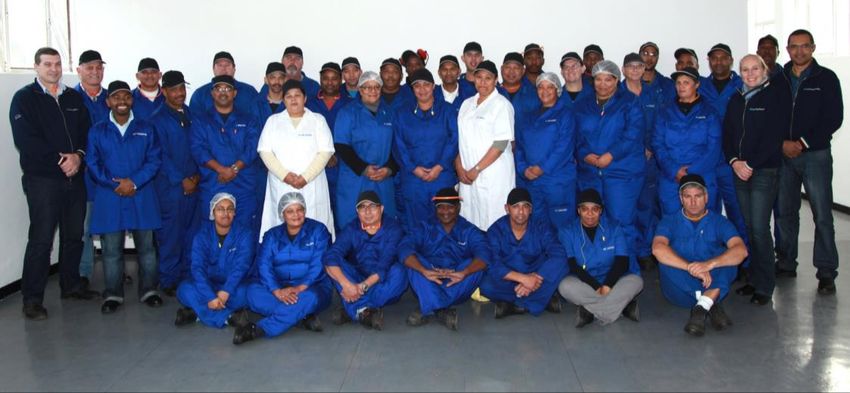
Source: Guala Closures informationEntrepreneurial talent combined with strong local teams
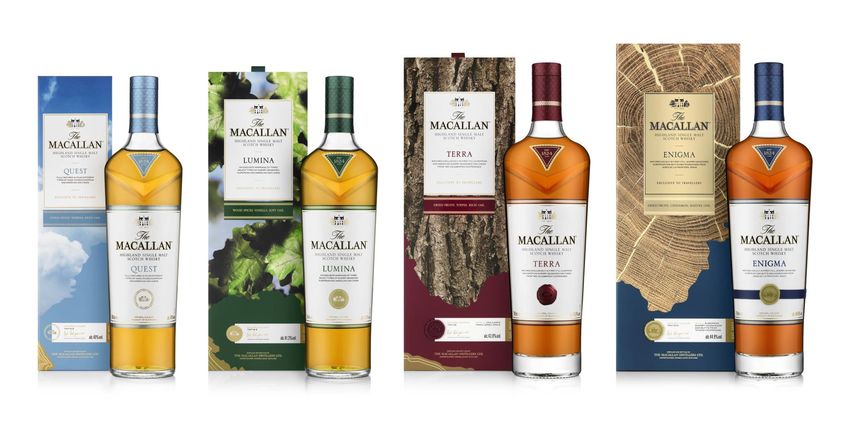
55Macallan re-package: a innovative new closure for this icon single malt
Launched in February 2018
56A compelling investment proposition
1
#1 Worldwide
solution provider &
partner to global and
local clients
5 Advanced 2
Entrepreneurial
technology and
management team
innovation driven
with a long-lasting
business model with
experience in the
unmatched
sector
capabilities
4 3
Operational
excellence distributed
Multiple growth
throughout a global
levers
manufacturing
platform
576. Transaction Description
Transaction overview

                  The business combination will be in the form of a merger of Guala Closures into Space4
Space4 will deploy all of its financial resources, investing alongside Peninsula, Quaestio and management

                                                         Key Objectives

                                                                                                                                                 #4 public company in
•         Listing on the STAR segment of the Italian Stock Exchange as a public                                                                    Italy on the STAR
          company with a market cap of c. €700m @ Euro 10 per share                                                                                    segment(2)
                                                                                                                                            4

•         Enhance capital structure substantially lowering current leverage by
          maximum c. €180m(4) to 3.0x and reducing related costs
                                                                                                                                                    #5 on the STAR
                                                                                                                                                 segment by free float(1)
•         Provide capital structure to fund external growth and continue
                                                                                                                                            5
          investing in the business

•         Provide Space4 investors with a unique opportunity to pursue                                                                             #13 on the STAR
                                                                                                                                                  segment by market
          accelerating growth in a very attractive and resilient sector
                                                                                                                                                        cap(3)
                                                                                                                                            13
Source: Guala Closures information, Space4 information
(1) In % of total outstanding shares. Excluding utilities and financial services
(2) By market capitalization. Public company defined with +50% free float in the STAR segment. Excluding utilities and financial services
                                                                                                                                                                        58
(3) Excluding utilities and financial services
(4) Assuming no withdrawal rights above €15m back-stop provided by Peninsula and Quaestio and including €25m management capital increase
Valuation
• Approach: DCF and trading multiples • Approach: Net Asset Value
• Equity Value: €504m • Space4 NAV of €10 per share at business
• Implied Enterprise Value: €1,079m(1) combination(5) corresponding to c. €528m
• Implied multiples on 2018E financials: • The withdrawal right price has been set at
– EV / EBITDA multiple: c. 9.1x(2) €9.903 per Space4 share
– P / E multiple pre-money: c. 23.7x(3)
– P / E multiple post-money: c. 19.7x(3)(4)
Source: Guala Closures information, Space4 information
(1) Calculated including Net Financial Position (€552.5m), employees’ benefits (€6.4m) and minorities (€16.4m) as of Dec-17
(2) Based on 2018 mid-point guidance 59
(3) Excluding minorities
(4) Assuming a cash contribution of c.€180m from Space4, co-investors and Management. Assuming 3.5% interest rate after refinancing and the use of tax assets
(5) Including first tranche of special shares conversionCurrent shareholding structures
Management Private Equity Investors
14.8% 85.2%
of which 8.6%
in class B shares
GCL Holdings SCA
• Ordinary shares (#50,000,000) listed on MIV
100%
• Special shares (#1,250,000)
– No entitlement to ordinary dividends, no voting rights
– 4.5-to-1 conversion in ordinary shares at certain triggers
Guala Closures S.p.A. • Market warrants (#20,000,000)
– Strike price: €10.0 with maximum underlying #4,651,000
shares
– 2 warrants every 10 shares delivered to shareholders at
Class B multiple voting shares key features: IPO – currently listed
– 2 warrants every 10 shares to be assigned at business
• Same economic rights combination(1)
• Triple voting rights (3:1) with respect to ordinary shares • Sponsor warrants (#2,500,000)
• Non transferable: 1:1 conversion into ordinary shares in case of – Strike price: €13.0 (cash exercise)
sale to third parties
• Owned exclusively by the management
Source: Guala Closures information, Space4 information
60
(1) Only assigned to shareholders that do not exercise any exit rights at business combinationKey transaction steps
3 key steps occurring simultaneously upon merger completion
1 2 3
Acquisition Management Capital Increase Merger
• Space4 jointly with Peninsula and • €25m reserved capital increase • Merger of Guala Closures into
Quaestio acquires 81.2% interest in fully underwritten by Guala Space4 with the resulting company
Guala Closures for a total cash Closures Management to be assuming the name of Guala
consideration of €409m(1) from GCL subscribed at closing Closures
SCA • Shares will be cum warrants (1m) • Guala Closures shareholders (i.e.
• Following Acquisition, GCL SCA will giving the rights to the holders to Peninsula, Quaestio, Management
own 14.8% and private equity subscribe for a new share for every and residual Private Equity
investors will maintain 4.0% of warrant post business combination Investors) receive 0,675381 new
Guala Closures share capital at a price of Euro 13 per share Space4 shares in exchange for each
• Guala Closures management team Guala Closures share
total investment Euro 100m(2) – Price per Guala Closures share
equal to €6.75381,
corresponding to an equity value
of €504m
– Space4 price per share of €10.00
Total net cash contribution into Guala Closures of c. Euro 180m (Pro Forma NFP/EBITDA18E 3.0x)
Source: Guala Closures information, Space4 information 61
(1) Including €349m from Space4, €50m from Peninsula and €10m from Quaestio
(2) Including contribution of current management shareholding (€75m) and management capital increase (€25m)Pro-forma shareholding structure
Economic Rights Economic Rights
@ Business Combination Fully Diluted @ €13 p.s.(1)
Space Holding Space Holding
Quaestio 3.9% Key Managers Quaestio 7.2% Key Managers
2.8%(2) 14.1% (Voting rights: 23.7%) 2.7% (2) 12.7% (Voting rights: 21.4%)
Peninsula
7.1% Private Equity Peninsula Private Equity
Investors 6.4% Investors
2.8% 2.6%
Investors Investors
Space4 (3) Space4 (3)
(free float) (free float)
69.3% 68.5%
• Out of the 14.1% of the Guala Closures share capital, Key Managers will own c.6.1% in class B shares with multiple voting rights (3/1)
• Lock-up obligations for key shareholders: Key Management (18 months), Space Holding (12 months), Peninsula (9 months), Quaestio (9
months), Private Equity Investors (6 months)
Source: Guala Closures information, Space4 information
Note: Scenario without exercise of withdrawal rights
(1) Pro-forma for the conversion of special shares at €13 and exercise of market warrants (i.e. excluding pre-exercise of sponsor warrants and management warrants)
(2) @BC Quaestio shareholding includes 1.4% shares owned through initial investment in Space4 and 1.4% through direct investment. @ 13€ Quaestio shareholding
62
includes 1.4% through initial investment in Space4 and 1.3% through direct investment
(3) Excluding QuaestioTransaction timeline
2018
16 April Space4 and Guala Closures Board of Directors approved the transaction
Today’s investor
presentation
28 May Space4 ordinary and extraordinary shareholder meeting to approve the transaction
14/15 June End of period for the exercise of the withdrawal right by Space4 shareholders
28/29 July End of creditor opposition period
End of July -
Merger effectiveness and transition to the STAR segment
Beginning of August
63
Source: Guala Closures information, Space4 informationBest-in-class corporate governance
Board of Directors will consist of 9 members
• Space4 has implemented a Corporate Governance system in line with the market best practice for listed companies, that will be retained after
the Business Combination
Shareholder agreement in place to define Board appointments
• 9 Directors overall, of which:
i. 4 appointed by Guala Closures’ management
ii. 2 (of which 1 Independent) appointed by Space Holding
iii. 2 Independent Directors, appointed, by mutual agreement, by Guala Closures management / Space Holding
iv. 1 Director appointed by Peninsula
• Supervisory Board: 1 Statutory Auditor appointed by Space Holding
64
Source: Guala Closures information, Space4 informationGuala Closures: a unique investment for our Space4 shareholders
• The Global leading producer of specialty closures for the spirits and wine
industry with almost €600m turnover
• A trusted partner to most global and local spirits and wine producers for
the last 40 years
• A business model driven by unique technology & innovation capabilities,
supported by an R&D DNA and by a state-of-the-art manufacturing
footprint spread across 5 continents
• A resilient story of growth - margins consistently at 20%+ in the last 15
years
• A natural consolidator in a fragmented market space, ready for additional
expansion opportunities
• An entrepreneurial management team with a long-lasting experience in
the sector and deeply invested in the business
A single transaction deploying €600m of cash equity for an aggregate equity value of approx. €700m
65
Source: Guala Closures informationAppendix
Resulting shareholding structure of the business combination

                            SCENARIO WITHOUT EXERCISE                                                         SCENARIO WITH MAXIMUM EXERCISE
                              OF WITHDRAWAL RIGHTS                                                                OF WITHDRAWAL RIGHTS

–       NO exercise of withdrawal right                                                        –   Maximum exercise of withdrawal right equal to €162.5m
–       No back-stop                                                                           –   Back-stop equal to €15m (€10m from Peninsula and €5m from
                                                                                                   Quaestio)
–       Cash contributed into Guala : c. €180m                                                 –   Cash contributed into Guala: c. €33m

                                     Space Holding                                                                           Space Holding
                             Quaestio    3.9%                Key Managers                                         Quaestio       5.0%        Key Managers
                               2.8%                             14.1% (Voting rights: 23.7%)                       4.5%                         17.8% (Voting rights: 29.2%)
                         Peninsula
                           7.1%                                        Private Equity                    Peninsula
                                                                         Investors                        10.8%
                                                                           2.8%                                                                          Private Equity
                                                                                                                                                           Investors
                                                                                                                                                             3.6%
                      Investors                                                                          Investors
                       Space4                                                                             Space4
                     (free float) (1)                                                                   (free float) (1)
                        69.3%                                                                              58.3%

• In case of no withdrawal the total cash contribution will be c. €180m (Pro Forma NFP/EBITDA18E 3.0x)
• In case of maximum withdrawal the total cash contribution will be reduced to c. €33m (Pro Forma NFP/EBITDA18E 4.2x)

    Source: Guala Closures information, Space4 information                                                                                                                     66
    (1) Excluding Quaestio
Revenues bridge by geographic region
2016-2017 Net Revenues bridge by geography (FX stable at FY17 average)
(0.4) 1.7
(3.4) 19.3
534.8
19.7
497.9
Asia
Africa
Europe
Americas
Oceania
Revenues
Revenues
2016 Net
2017 Net
2015-2016 Net Revenues bridge by geography (FX stable at FY17 average)
(0.9) (3.2)
(5.0) 3.8
7.3
496.0 497.9
Asia
Oceania
Revenues
Revenues
Africa
Europe
Americas
2015 Net
2016 Net
Source: GCL Holdings consolidated accounts - to be considered as a proforma of Guala Closures Group consolidated accounts after Group
67
Structure reorganizationRevenue by geographic region
Revenue by geography (reported)
(€/m)
534.8
520.5
500.3 500.3 17
19.3
14.4 14.4 48.6
49.9
48.7 48.7
107
96.6 89.3 89.3
70.4 71.9
74.8 74.8
284.4 273.1 273.1 290.4
2015 2016 2016 2017
Europe Asia Americas Oceania Africa
Source: GCL Holdings consolidated accounts - to be considered as a proforma of Guala Closures Group consolidated accounts after Group
68
Structure reorganizationOperating costs
Operating Costs FY15–FY17
(€/m)
447.7
430.0 2%
3% 411.1
3%
22%
22%
23%
21% 22%
22%
13% 14%
14%
23% 23%
22%
18% 17% 16%
FY15 FY16 FY17
Plastic consumptions Aluminium consumptions Other Raw Material Costs for Services Personnel Expenses Other Operating Costs
Cost of raw material
Source: GCL Holdings consolidated accounts - to be considered as a proforma of Guala Closures Group consolidated accounts after Group
69
Structure reorganizationIncome Statement 2015-2017
Data in €/m 2015A 2016A 2017A
Net Revenues 520.5 500.3 534.8
growth % 6.7% (3.9%) 6.9%
Change in inventory of FG/SF goods 3.1 1.3 6.9
Value of Production 523.6 501.5 541.7
Other operating income 9.7 10.2 9.3
Costs for raw materials (233.3) (218.4) (236.0)
% of Net Revenues (44.8%) (43.7%) (44.1%)
Costs for services (91.1) (88.5) (100.2)
% of Net Revenues (17.5%) (17.7%) (18.7%)
Personnel expenses (94.0) (93.8) (100.6)
% of Net Revenues (18.1%) (18.8%) (18.8%)
Other operating costs (11.6) (10.4) (10.9)
% of Net Revenues (2.2%) (2.1%) (2.0%)
EBITDA 103.3 100.7 103.2
margin % 19.8% 20.1% 19.3%
EBITDA adjusted 106.4 102.5 110.6
margin % 20.4% 20.5% 20.7%
Amort., deprec. and impair. losses (37.6) (31.0) (33.5)
D&A as a % of Capex 178.0% 100.4% 111.0%
EBIT 65.7 69.7 69.7
margin % 12.6% 13.9% 13.0%
EBIT adjusted 68.8 71.5 77.1
margin % 13.2% 14.3% 14.4%
Exchange rate (3.9) (2.5) (9.1)
Derivatives and other finan items (3.1) (2.4) (0.9)
Net interest expenses (41.7) (49.0) (31.4)
Total net financial expenses (48.6) (53.8) (41.4)
EBT 17.0 15.9 28.3
margin % 3.3% 3.2% 5.3%
Income taxes (21.7) (19.6) (23.5)
Taxes as a % of EBT (127.6%) (123.0%) (83.1%)
Net income (4.7) (3.7) 4.8
margin % n.m. n.m. 0.9%
Source: GCL Holdings consolidated accounts - to be considered as a proforma of Guala Closures Group consolidated accounts after Group
70
Structure reorganizationBalance Sheet 2015-2017
Data in €/m 2015A 2016A 2017A
Intangible assets 376.7 374.0 377.2
PP&E 186.1 189.9 190.7
Held for sale - - 2.1
Fixed assets 562.8 563.9 570.0
Inventories 67.3 67.9 82.7
Inventories days 45 46 51
Trade receivables 86.9 89.1 102.4
Trade receivables days 58 61 63
Trade payables (67.1) (66.2) (71.7)
Trade payables days (45) (45) (44)
Net working capital 87.0 90.8 113.5
Derivatives (1.1) 0.1 (0.2)
Other assets/liabilities (28.6) (28.9) (31.4)
Other assets/liabilities as a % of Revenues (5.5%) (5.8%) (5.9%)
Employee benefits (5.7) (6.2) (6.4)
Other provisions (1.8) (1.3) (1.2)
Net invested capital 612.6 618.3 644.3
Financial liabilities 546.6 554.3 577.4
Financial liabilities vs minority 13.5 15.9 16.8
Financial assets (0.6) (0.7) (1.1)
Cash & cash equivalents (61.9) (54.7) (40.6)
NFP 497.6 514.8 552.5
Total equity 115.0 103.5 91.8
Source of financing 612.6 618.3 644.3
Source: GCL Holdings consolidated accounts - to be considered as a proforma of Guala Closures Group consolidated accounts after Group
71
Structure reorganizationCash Flow Statement 2015-2017
Data in € / m 2015A 2016A 2017A
Adjusted EBITDA 106.4 102.5 110.6
Change in NWC 10.1 (7.8) (27.7)
Other operating 1.2 1.5 (3.0)
Taxes (21.8) (22.2) (22.8)
Change in net financial indebtedness from operating activities 96.0 74.0 57.0
Net capex paid (22.6) (31.2) (28.7)
Capex as a % of net revenues (4.3%) (6.2%) (5.4%)
Acquisitions - (1.1) (11.1)
Change in net financial indebtedness used in investing activities (22.6) (32.3) (39.8)
Acquisition of non-controlling interest (0.7) - (1.1)
Acquisition of initial Guala Closures France SAS indebtedness - (0.7) -
Acquisition of initial Axiom Propack Pvt Ltd indebtedness - - (5.4)
Net interest expenses (41.7) (38.6) (31.4)
Exceptional financial costs for debt restructuring - (10.4) -
Transaction costs not yet paid / (paid) for the debt refinancing - 3.8 (3.8)
Derivatives and other fin. items (4.7) (3.5) (0.6)
Capital increase - - 0.8
Dividends paid (3.9) (6.3) (6.8)
FX impact (2.5) (0.7) (1.7)
Change in net financial indebtedness used in financing activities (53.4) (56.4) (49.9)
Exceptional (9.9) (2.6) (5.1)
Total change in net financial indebtedness 10.1 (17.2) (37.7)
Source: GCL Holdings consolidated accounts - to be considered as a proforma of Guala Closures Group consolidated accounts after Group
72
Structure reorganizationCash generation
Consolidated Free Cash Flow and Net Cash Flows Trend
50
43.7
40 37.3
30
20
14.9
10.6 11.9
8.5
(€m)
10
4.1 4.9
1.4
0
(1.2)
(6.0) (5.2)
(10)
(9.7)
(12.6)
(20)
(18.6)
(20.8)
(30)
Mar-16 Jun-16 Sep-16 Dec-16 Mar-17 Jun-17 Sep-17 Dec-17
Free Cash Flow Net Cash Flow
Source: Management consolidated cash flow
73
Note: Free cash flow is operating cash flow net of capex paidLeading position across geographies
Product Lines Product Breakdown Market Positioning Major Clients
A Safety
4%
Pharma 1
16%
Wine
West Europe Roll-On
41%
Roll-On & 1 2
Others
7% Luxury
Europe Wine
(West & East) 32% Safety 1 2
54%
13% Wine
Safety
Roll-On &
1
51%
Others
East Europe
Luxury Roll-On
1%
1
35%
Safety
74
Source: Guala Closures information
Note: Revenues breakdown refer to countries from which the product is soldLeading position across geographies (cont’d)
Product Lines Product Breakdown Market Positioning Major Clients
B Safety Luxury
18% Wine 1 1
Americas 16%
3% Roll-On & Roll-On
Others
1 2
Luxury
20% 63% Wine
1 3
Safety
C 1%
Asia Roll-On &
Others Safety
13% 1
99%
Safety
75
Source: Guala Closures information
Note: Revenues breakdown refer to countries from which the product is soldLeading position across geographies (cont’d)
Product Lines Product Breakdown Market Positioning Major Clients
D
Roll-On
Wine
Oceania 1
9%
80%
Wine
1
Roll-On &
Others
20%
E 2% Safety
Pharma
1
42%
Africa
Wine
Roll-On
3% 1
Roll-On &
50% Other
Wine
Safety
2
5%
76
Source: Guala Closures information
Note: Revenues breakdown refer to countries from which the product is soldAfter years of bulk driving export top producing countries are pushing
bottled export; due to strong localization, this can benefit GLC
Wine Worldwide export per type (2006-2016) Top 7 (*) Producing Countries (2016 vs. 2017)
(Mhl liters) (Bn liters)
€18Bn €23Bn €29Bn
CAGR CAGR
06-16 11-16 -5.2%
3.1 2.9
2.0% 102.7
Bulk
93.4 8,3 +7.2% +0.7%
6,2
84.0
4.0
2016 2017
39,5 +3.2% +0.3%
34,3
29,0
6.1%
4.1 4.4
51,0 53,0 54,9
+0.8% -1.0% Bottled
2006 2011 2016
Sparkling Bulk (>2lt) Bottled 2016 2017
Source: OIV World Wine Production – e I Numeri del Vino; (*) China has no relevant export 77Sustainability program results 2011-2015
Program started in 2011
Program based on 12 indicators
Perimeter: Italy Business Unit
Implemented Best Practices and Internal Communication
15 objectives achieved or outperformed
ENVIRONMENTAL SOCIAL ECONOMIC
CO2 emissions - 36.6% Accidents - 41.7% OEE 74.8%
Energy consumption - 44.0% 2 hours training on New patentable ideas 26
Sustainability 100%
Water consumption - 52.2% Claims 0.08%
Waste - 76.5%
Scraps - 68.1%
78Sustainability program 2016-2020
Implement sustainability program throughout the Group
Program based on 12 indicators and 21 objectives
Perimeter: the whole Group
Strategic Key Objectives
CO2 Emissions - 25% Accidents - 15%
Energy Consumption - 25% 2 hours Training on Sustainability 100%
Water Consumption - 20% ISO 14001 certification 100%
Production Scraps - 30% ISO 22000 certification 100%
Waste in landfill 0 Sedex accreditation 100%
79You can also read