GUIDANCE D Geolocation Data Requirements and Risk Maps - Version 1 - Rainforest Alliance
←
→
Page content transcription
If your browser does not render page correctly, please read the page content below
GUIDANCE D
Geolocation Data Requirements and Risk
Maps

Version 1

© 2021 Rainforest Alliance. All rights reserved.
Translation Disclaimer
For any question related to the precise meaning of the information contained in the
translation, please refer to the English official version for clarification. Any discrepancies or
differences in meaning due to translation are not binding and have no effect for auditing or
certification purposes.

More information?
For more information about the Rainforest Alliance, visit www.rainforest-alliance.org or
contact info@ra.org

        Document Name:                                Document Code: Version:
        Guidance D: Geolocation Data                  SA-G-SD-5-V1         1
        Requirements and Risk Maps
        Date of first          Date of revision:      Valid From:          Expires by:
        publication:
        February 28, 2021      N/A                    February 28, 2021    Until further notice
        Developed by:                                 Approved by:
        Rainforest Alliance Department Standards Director of Standards and Assurance
        and Assurance
        Linked to:
        SA-S-SD-1-V1.1 Rainforest Alliance 2020 Sustainable Agriculture Standard, Farm
        requirements (1.2.12. 1.2.13. 1.2.14. 1.2.15. and 6.1.1. 6.1.2)
        SA-S-SD-13-V1 Annex S12: Additional Details on requirements for no-conversion
        Replaces:
        N/A
        Applicable to:
        Farm Certificate holders

        Country/Region:
        All
        Crop:                                         Type of Certification:
        All crops in the scope of the Rainforest      Farm Certification
        Alliance certification system; please see
        Certification Rules.

SA-G-SD-5-V1                                                                                        2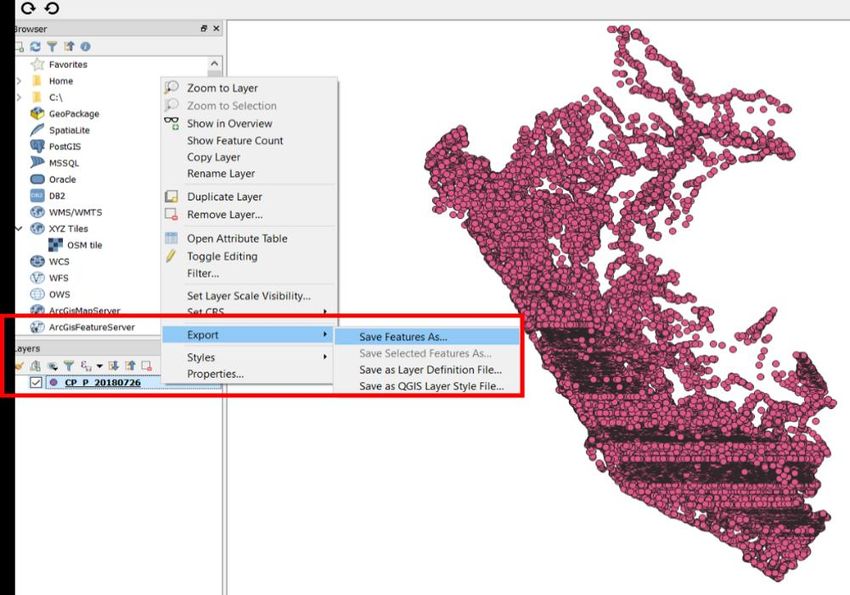
TABLE OF CONTENTS
Table of figures ...................................................................................................................................... 4
Table of tables ....................................................................................................................................... 5
1. Purpose ........................................................................................................................................... 6
2. Abbreviations ................................................................................................................................. 6
3. Definitions ....................................................................................................................................... 7
4. Standard requirements ................................................................................................................. 9
4.1 Requirements for Geolocation Data .................................................................................... 9
4.2 Requirements for Protected Areas, natural forests and ecosystems .............................. 10
5. Responsibility Of Certificate Holders ......................................................................................... 10
6. Geodata collection .................................................................................................................... 11
6.1 Envelopes ............................................................................................................................. 13
6.2 Location points .................................................................................................................... 14
6.3 Polygons ............................................................................................................................... 15
6.4 Polygons based on reference location points ............................................................ 15
6.5 Polygons collected in the field ...................................................................................... 15
7 Geolocation data verification ................................................................................................... 16
8 Risk Maps ...................................................................................................................................... 17
8.1 Deforestation Risk ................................................................................................................ 17
8.2 Risk of encroachment into Protected Areas ................................................................... 19
8.3 Geodata quality ................................................................................................................. 20
8.4 Use of Risk Maps ........................................................................................................................ 20
9 Data Reporting ............................................................................................................................ 21
9.1 GPS data reporting for application for minor exceptions for infrastructure
management ............................................................................................................................... 22
10 Detailed instructions for collection of geolocation data ......................................................... 22
10.1 Location points .................................................................................................................... 22
10.1.1 Google My Maps ........................................................................................................ 23
10.2 Polygons based on reference location points ................................................................ 33
10.2.2 Google Earth ..................................................................................................................... 34
10.2.3 Polygons collected in the field ....................................................................................... 36
10.3 Envelopes ................................................................................................................................. 37
11: How to convert geospatial files TO KML and geojson ............................................................. 38
11.1 QGIS .......................................................................................................................................... 38
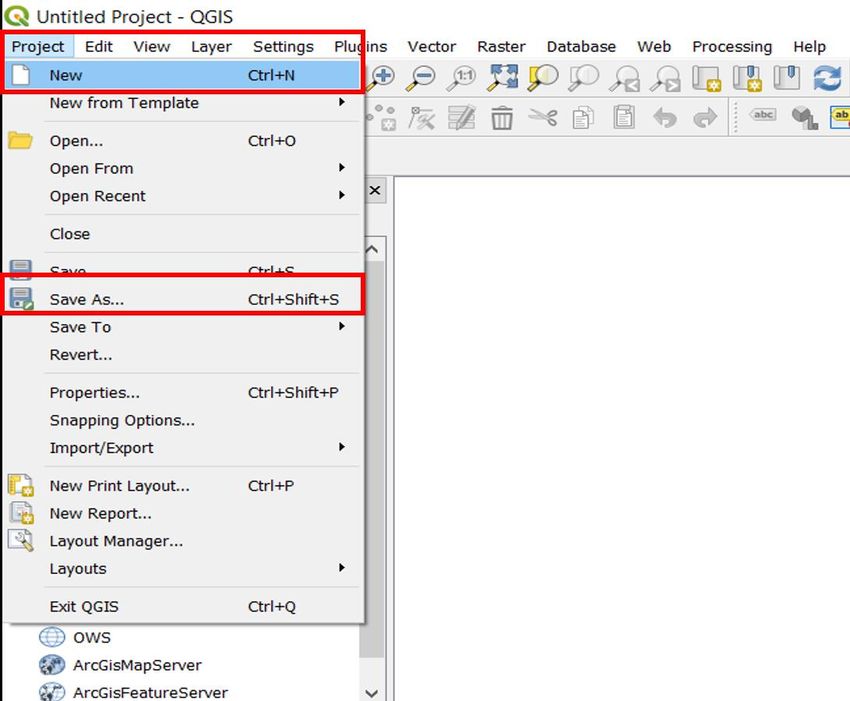
11.1.1 Create and save a new project ..................................................................................... 39
11.1.2 Add a layer to the project .............................................................................................. 40
11.1.3 Convert the layer to the right format (KML or GeoJSON) ........................................... 41
11.1 GPSVisualizer webtool ........................................................................................................ 44
SA-G-SD-5-V1 3
11.2.1 Upload data to the website ............................................................................................ 44
11.2.2 Set the map parameters ............................................................................................ 44
11.2.3 Create a KML file......................................................................................................... 45
12: How to edit attributes of polygon files (KML)............................................................................. 46
12.1 Google My Maps ................................................................................................................ 46
TABLE OF FIGURES
Figure 1. Graphic representation of a farm unit ............................................................................... 7
Figure 2. Geolocation data collection inside the farms ................................................................ 12
Figure 3. Screenshot of Google My Maps application in the play store ..................................... 23
Figure 4. Creating a new map in web-based application ........................................................... 23
Figure 5. Change the base map to “satellite” ................................................................................ 24
Figure 6. Name map and layers ....................................................................................................... 24
Figure 7. Open the layer’s table to add columns (attributes) ...................................................... 25
Figure 8. Screenshot on how to insert columns ............................................................................... 25
Figure 9. Choosing data type for attributes .................................................................................... 26
Figure 10. Choosing name/title for location point data ................................................................ 27
Figure 11. Data table example ......................................................................................................... 27
Figure 12. Collection of points in the field ........................................................................................ 28
Figure 13. Synchronization with web-based application ............................................................... 28
Figure 14. How to export your data into KML file ............................................................................ 29
Figure 15. Exporting a KML ................................................................................................................. 29
Figure 16. Uploading a KML file to the webtool .............................................................................. 30
Figure 17. How to convert your KML into a CSV file ........................................................................ 30
Figure 18. KML converted into CSV .................................................................................................. 31
Figure 19. Visualizing CSV in Excel ..................................................................................................... 31
Figure 20. Step 1 .................................................................................................................................. 31
Figure 21. Step 2 .................................................................................................................................. 32
Figure 22. Step 3 .................................................................................................................................. 32
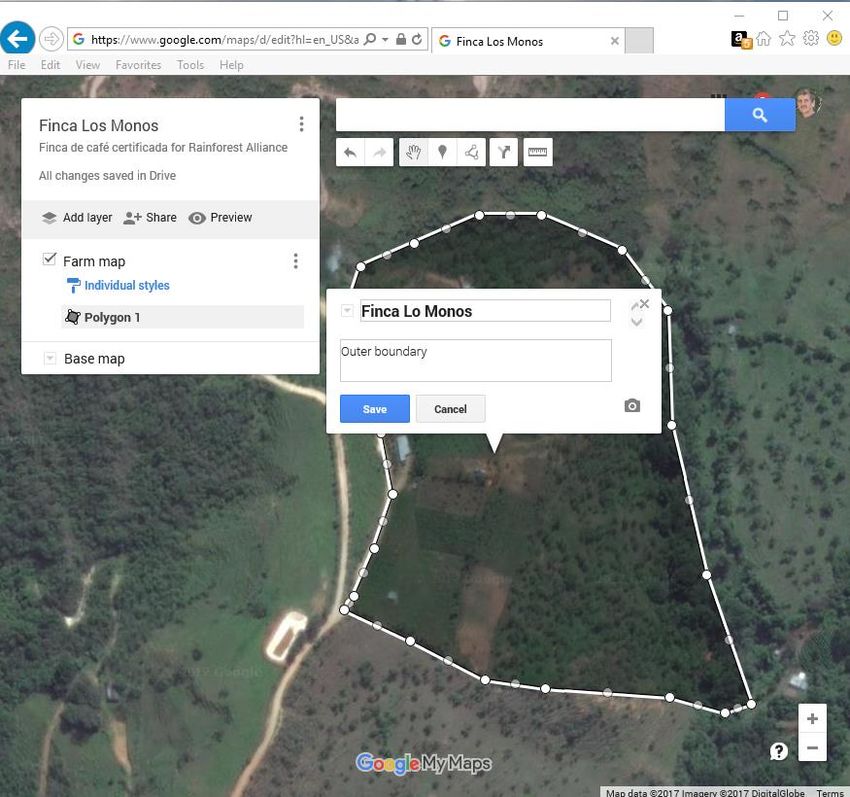
Figure 23. Example of a farm polygon drawn in Google My Maps ............................................. 34
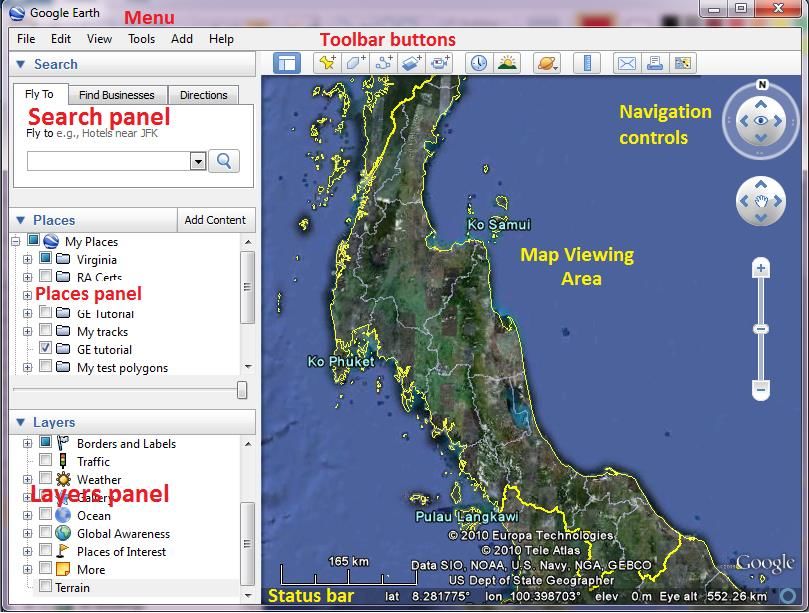
Figure 24. Typical view of Google Earth with labels showing different parts of the screen ...... 35
Figure 25. Polygon digitizing steps in Google Earth ........................................................................ 36
Figure 26. Example of how to save polygons as a KML file ........................................................... 36
Figure 27. Example of envelop of geographical scope ................................................................ 37
Figure 28. Screenshot on how to create and save a new project on QGIS ............................... 39
Figure 29. Add a new vector layer to your QGIS project .............................................................. 40
Figure 30. QGIS Data Source Manager window: from here you can upload your file .............. 41
SA-G-SD-5-V1 4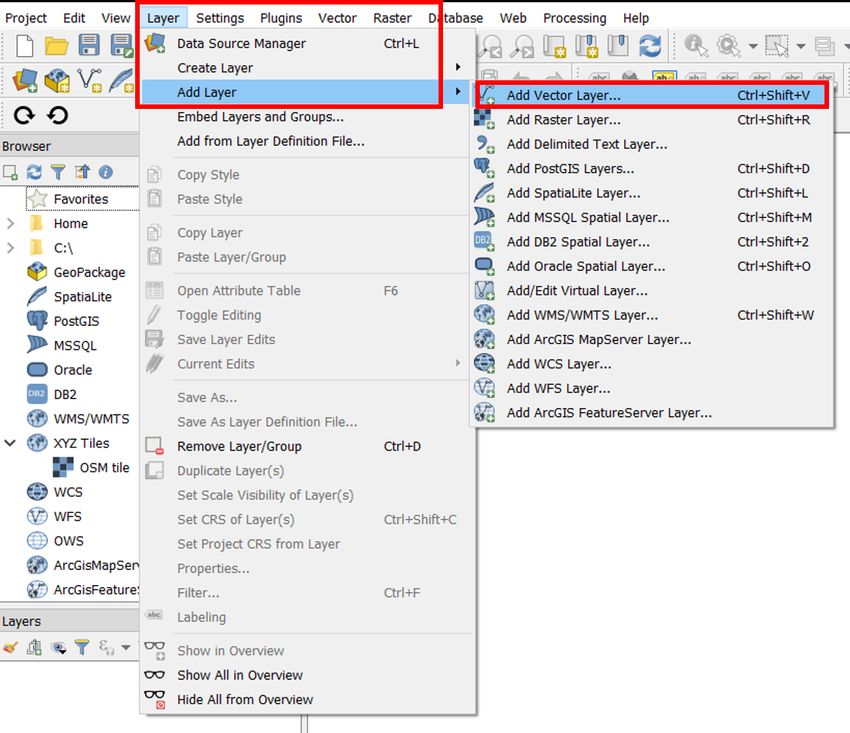
Figure 31. Steps in QGIS to convert the layer in another format .................................................. 42
Figure 32. Screenshot on how to set Input and output parameters for the file conversion ...... 43
Figure 33. Screenshot of website interface .................................................................................... 44
Figure 34. Steps to upload data to the website ............................................................................. 44
Figure 35. Screenshot of the general map parameters ................................................................. 45
Figure 36. Output results interface .................................................................................................... 45
Figure 37. Creating a new map in web-based application ......................................................... 46
Figure 38. Name map and layers ..................................................................................................... 47
Figure 39. Uploading polygon file ..................................................................................................... 47
Figure 40. Data table on Google My Maps ..................................................................................... 48
Figure 41. Modification of attributes ................................................................................................. 48

TABLE OF TABLES
Table 1. Relevant definitions for deforestation risk .......................................................................... 18
Table 2. Classification of "Go" and "No-go" Protected Areas ........................................................ 19
Table 3. Accepted formats and templates for geolocation data ............................................... 21
Table 4. List of attributes for location point data collection .......................................................... 26

SA-G-SD-5-V1                                                                                                                                  5
1. PURPOSE
Accurate geolocation data is essential to ensure compliance with the 2020 Rainforest
Alliance Sustainable Agricultural Standard (referred to as “the Standard” in this guidance).
Deforestation and encroachment in Protected Areas are important risk topics for many
stakeholders in the Rainforest Alliance certification system, and appropriate mechanisms are
necessary to support certificate holders to address these risks effectively. Mapping the
boundaries of farms using geolocation data is also the best way to obtain an accurate
measurement of the farm area, which is the basis for estimating certified yield and
appropriate quantities of agro-chemicals.

This document clarifies geolocation data requirements and provides a set of guidelines to
assist Certificate Holders (CHs) in recording such information in accordance with the
requirements of the Standard.

Please note that some of the tools and IT systems to be used for geospatial data collection
and analysis are still under development. Further guidance will be provided in a timely
manner.

   2. ABBREVIATIONS
CB: Certification Body

CH: Certificate Holder

CGLC: Copernicus Global Land Cover

GIS: Geographical Information System

PA: Protected Areas

RACP: Rainforest Alliance Certification Platform

S&A: Standard & Assurance department

TCL: Tree Cover Loss

WDPA: World Database of Protected Areas

SA-G-SD-5-V1                                                                                   6
3. DEFINITIONS
“Go” protected area: Protected areas where certain regulated economic and agricultural
activities are allowed under specific conditions (specified in applicable law)

“No-go” protected areas: high conservation priority areas, with strictl regulations regarding
protection. Agricultural production is not allowed under applicable law.

Envelopes: A geographic boundary consisting of a polygon that defines the total area within
the geographical scope of the certified farm or group, potentially including land that is not
covered by the certificate.

Farm: All land and facilities used for agricultural production and processing activities under
the geographical scope of the farm applicable for Rainforest Alliance certification . A farm
may be composed of several neighbouring or geographically separate farm units within one
country provided that they are under a common management body. All farms and farm
units falling within this geographical scope must comply with the 2020 Rainforest Alliance
Sustainable Agriculture Standard, even when a different crop from the certified one is also
cultivated (e.g. farm/farm unit with a plantation of rice belonging to a producer who is part
of a certified group for coffee that falls within the same geographical scope). A farm may be
composed of several neighboring or geographically separate units of land within one country if they
are under a common management body.

Farm unit: A piece of continuous land that is part of a farm. A farm unit can include both
agricultural and non-agricultural land with buildings, facilities, water bodies, and other
features.

Farm units A piece of continuous land that is part of a farm. A farm unit can include both
agricultural and non-agricultural land with buildings, facilities, water bodies, and other
features.

                            Figure 1. Graphic representation of a farm unit

Forest: Forests are land spanning more than 0.5 hectares with trees higher than 5 meters and
a canopy cover of more than 10 percent, or trees able to reach these thresholds in situ. It
does not include land that is predominantly under agricultural or other land use. Where
quantitative thresholds (e.g., for tree height or canopy cover) are established in sector-wide
commitments or national or subnational forest definitions, they may take precedence over
the generic thresholds in this definition. Natural forests possess many or most of the
characteristics of a forest native to the given site, including species composition, structure,
and ecological function.

Geolocation data: Data that identifies the geographic location of farms and boundaries of
farms, farm units, and other facilities of the Rainforest Alliance certificate holders.
Geolocation data is represented by coordinates generally collected through Geopositioning

SA-G-SD-5-V1                                                                                          7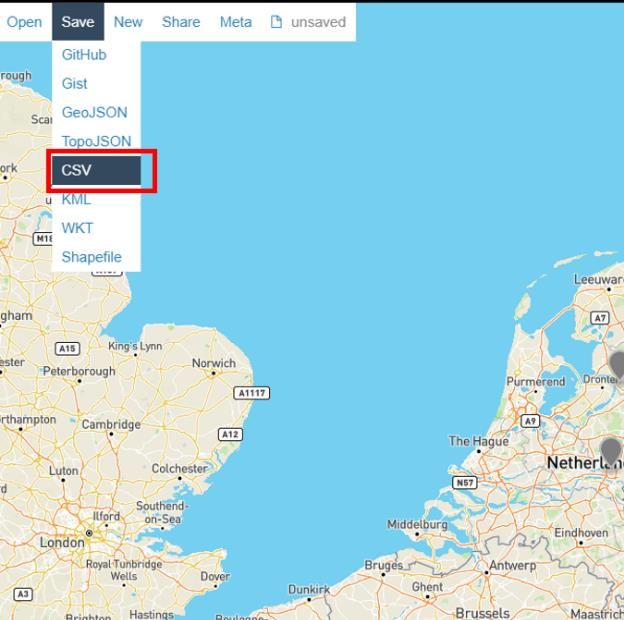
Systems (GPS) mapping using either individual location points (including envelopes) or
polygons which define the full boundaries of the relevant area.

Location point: A pair of latitude/longitude coordinates collected through Geographic
Information Systems (GIS) Data. The location point is a single data point. It can be used to
represent the location of a farm/farm unit when no polygon information is available.
Location points should be taken at the center of the farm unit. If a farm consists of multiple
farm units, the location point should be taken at the centre of the largest farm unit.

Polygons: A geographic boundary that encloses an area representing a farm/farm unit.
Polygons can be mapped using Geographic Information Systems (GIS) Data. They can be
coded with essential data about the farm (referred to as attributes), such as farm ID, farm
area (hectares), production area, crop, owner, certification status.

Protected areas: An area of land declared or designated by relevant authorities as
protected because of its recognized natural, ecological and/or cultural value to achieve the
long-term conservation of nature with associated ecosystem assets and cultural value.
Examples include national parks, wildlife refuges, biological or forestry reserves, private
reserves, and areas within UNESCO Biosphere reserves or World Heritage Sites. Production
might be allowed in a protected under applicable law, which can constitute a certain
zoning in a management plan (multi-use zones), a certain category of protected areas
(IUCN categories V, VI), or permits (for example, admitted farms).

Risk maps: Maps showing the risk levels of countries, CHs and/or farm/farm units for key topics
covered by the requirements of the Standard (e.g. deforestation and encroachment in
protected areas, child labor and forced labor). Deforestation and encroachment risk maps
are made by combining external data sources with location data.

SA-G-SD-5-V1                                                                                      8

4. STANDARD REQUIREMENTS
Accurate geolocation data helps group and farm management better manage its
operations. This data is also necessary for the Rainforest Alliance and Certification Bodies to
reliably identify and locate CHs. The following tables show the Standard requirements
regarding geolocation data, protection of natural forest and ecosystems and production in
Protected Areas.

4.1 Requirements for Geolocation Data

         Core Requirement

         Applicable to: Group Management

 1.2.12 For 100% of the farms, geolocation data of the largest farm unit with the
 certified crop is available.

 For at least 10% of the farms, this is in the form of a GPS polygon. For all other farms,
 this can be in the form of a location point.

 Please see
        CoreAnnex: S12: Additional Details on requirements for no-conversion
             Requirement

         Applicable to: Large farms part of a group, Individual certificate holders

 1.2.13 A polygon is available of the farm. If the farm has multiple farm units, a polygon
 is provided for each farm unit.

         L1: Mandatory Improvement

         Applicable to: Group Management

 1.2.14 Geolocation data is available for 100% of all farm units. At least 30% is in the
 form of polygons.

 Yearly progress on the indicators needs to be shown, corresponding to the target to
 reach at the end of year three.

 Indicator:
 - % of farm units with geolocation data
 - % of farm units with polygons

SA-G-SD-5-V1                                                                                      9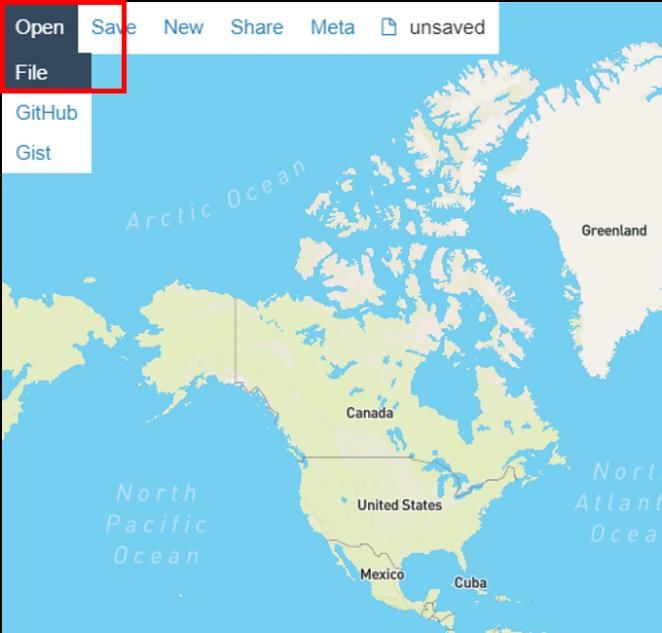
L2: Mandatory Improvement

           Applicable to: Group Management

  1.2.15 Polygons are available for 100% of the farm units.

  Yearly progress on the indicators needs to be shown, corresponding to the target to
  reach at the end of year six.

  Indicator:

  - % of farm units with geolocation data
  - % of farm units with polygons

*Improvement Level:
Level 1 (L1) after three years of certification.
Level 2 (L2) after six years of certification

4.2 Requirements for Protected Areas, natural forests and ecosystems

           Core Requirement

           Applicable to: Small farms and Large farms part of a group, Individual
           certificate holders

  6.1.1 From January 1st 2014 onward, natural forests and other natural ecosystems
  have not been converted into agricultural production or other land uses.

  Please see Annex: S12: Additional Details on requirements for no-conversion

           Core Requirement

           Applicable to: Small farms and Large farms part of a group, , Individual
           certificate holders

  6.1.2 Production or processing does not occur in protected areas or their officially
  designated buffer zones, except where it complies with applicable law.

    5. RESPONSIBILITY OF CERTIFICATE HOLDERS
Certificate Holders are required to provide geolocation data to the Rainforest Alliance
Certification Platform (RACP) as described in this document and in compliance with the
standard requirements and certification and auditing rules.
Certificate Holders are also required to use the risk maps as indicated in Section 8 in this
document.
Certificate Holders should ensure they collect accurate information. Internal inspectors
should review and verify geolocation data, which will also be checked during the audit
process.

SA-G-SD-5-V1                                                                                   10
6. GEODATA COLLECTION
CHs are responsible for providing the geolocation (i.e. points for farms and polygons for farm
units) as required in the standard. Please note that besides agricultural land, farm units shall
also include non-agricultural land with buildings, conservation set-asides, facilities, water
bodies, and other features related to the certified operations. Geolocation details for these
must also be provided.
CHs that already have accurate geolocation information (location points and/or polygons)
may simply submit this data if they match the requirements mentioned in Section 9 of this
document. CHs that do not yet have the required information may use the methods
summarized below for collecting envelopes, location points and polygons. This is further
explained with step-by-step instructions in Section 10. Detailed instructions for collection of
geolocation of this guide.
The figure below shows examples of farms with one farm unit and with multiple farm units to
explain where the geodata must be collected.
Please note that the farm units don’t necessarily need to be close to each other; they could
be scattered and distanced amongst themselves.
• Case #1 is the representation of a farm with just one farm unit. In this case, the CH will
have to collect the geolocation data (points or polygons) in the center of that farm
unit.
• Case #2 shows a farm with 5 farm units. In this example, and for requirement 1.2.12,
the CH will have to collect the geolocation data in the largest farm unit with the
certified crop (farm unit number 4). Lastly,
• Case #3 shows a farm with 3 farm units. In this case, even if the farm unit number 3 is
the largest, the CH will have to collect the geodata in the farm unit number 2
because it is the “largest” with the certified crop, as set out in requirement 1.2.12.
When complying with requirements 1.2.14 and 1.2.15, the geodata will have to be
collected in the center of the remaining farm units, following the percentages of
polygons requested in each requirement. To be compliant with requirement 1.2.15,
the CH will have to collect polygons for 100% of the farm units, that are part of the
farm.
SA-G-SD-5-V1 11Case
1
Case
2
Case
3
Figure 2. Geolocation data collection inside the farms
SA-G-SD-5-V1 12The standard includes 2 improvement levels for geodata collection for groups.
• L1 (after 3 years) (1.2.14) requests the polygons for 30% of all farm units,
• L2 (after 6 years) (1.2.15), increases the percentage of polygons to 100%.
CHs may spread the collection of the polygon data over the years leading up to the
certification audit. Therefore, CHs should include in the Management Plan yearly goals for
geolocation data collection.
CHs should develop a risk methodology that ensures that data collection prioritizes the
riskiest farms. CHs can use Rainforest Alliance risk maps (see Section 8) made with the
location points as an input for planning the collection of polygons.
CHs will be asked to provide/update geolocation data at different steps in the certification
process:
• Registration: at this point, groups shall provide a mix of points and polygons, as per
the standard requirements. New groups may opt to provide only envelopes. For large
estates (part of a group) and individual farm certification, polygons shall always be
provided at this step. This geodata will be used to produce the “registration” risk map
for deforestation and protected areas.
• Annually before each (re)certification and surveillance audit: all CHs must submit the
updated geolocation data before their annual audit in compliance with the
applicable standard requirements. This geodata will be used to produce the risk map
for deforestation and protected areas, which will be used by the Certificate Holder to
address the risks identified, and will be shared with the CB for verification during the
audit.
Certificate Holders should use the geolocation data provided at registration to identify risk
management measures to be implemented to address the risks of deforestation and
encroachment in protected areas . The better the geolocation data (e.g. polygons instead
of location points), the more accurate the risk maps and thus, the better insights for the
correct implementation of the program. For this reason it is in the best interest of the CH to
provide points and polygons instead of envelopes where possible at the registration step.
6.1 ENVELOPES
In the registration step in the RACP, CHs will have to provide geolocation data of the
farms/farm units. CHs that have already collected points and/or polygons are encouraged
to submit these in this step. However envelopes can be provided if the following three
conditions are met: (1) it is a group certification, (2) location points and/or polygons have not
yet been collected, (3) this is the first certification year of the CH. Please note that:
• Before the certification audit, the CH collects and submits the geolocation data in
the RACP, as indicated in requirement 1.2.12 of the standard. In other words, during
registration the CH submits envelopes but then at least 5 weeks before the
certification audit, the CH submits points and polygons.
• Envelopes are not accepted as an update of the registration data in subsequent
audits. For those audits, the CH must provide the required points and polygons when
updating its data.
For envelopes, the same methodology and tools described in point 6.3.1 (below) can be
used. In this case, the CH doesn’t necessarily need reference points and can simply draw a
large envelope.
SA-G-SD-5-V1 136.2 LOCATION POINTS
The easiest way to collect latitude/longitude coordinates is to use a global positioning system
(GPS) device (like Garmin or Leica), or a GPS-capable smartphone or tablet. On
smartphones and tablets, location points can be collected with photos or any number of
apps. The Farm Intelligence App, developed by RA, offers an additional tool for location
point data collection. Further information will be provided on the availability of the Farm
Intelligence App to certificate holders. Note that most smartphones do not need an internet
connection or cellular data coverage for collecting location data.
Location points must be collected following the requirements below:
• Coordinates must be taken as close as possible to the center of the farm/farm unit,
considering the internal farm conditions (high cliffs, rivers, irregular and dangerous
terrain) as well as the borders of the farm.
• The location of the point must be marked (e.g. with a stick in the ground, marking a
nearby tree etc.) by the person taking the initial coordinate This is to ensure that the
same location can be collected and verified by the auditor. This should ensure as little
deviation as possible between the point taken by the farm and the one taken by the
CB.
• The coordinates must be reported in latitude and longitude coordinates.
• The coordinates are reported in decimal degrees format with 4 decimals (i.e. Latitude:
9.7611; Longitude: -84.1872). If you have coordinates in degrees, minutes, seconds,
these can be converted into decimal degrees using an online tool such as:
http://www.latlong.net/degrees-minutes-seconds-to-decimal-degrees or
https://www.engineeringtoolbox.com/utm-latitude-longitude-d_1370.html
It is also easy to convert to decimal degrees (e.g. in Excel) by applying the following
equations: Decimal degrees = degrees + minutes/60 + seconds/3600
• The decimal degree coordinates must have the correct (+/-) sign. Points in the
southern hemisphere have negative latitudes; points in the western hemisphere (the
Americas) have negative longitudes. If the sign is positive (northern hemisphere
latitudes and eastern hemisphere longitudes), it is not necessary to include a “+” sign
(i.e. Latitude: 9.7611; Longitude: -84.1872).
• The coordinates must be stored in number format, and not include any non-numerical
characters such as the degrees symbol (°). This can be checked in Excel using the
ISNUMBER() and the NUMBERVALUE() functions.
• The coordinates are provided in the RACP or any other tool indicated by the
Rainforest Alliance and using the template requested by the Rainforest Alliance.
SA-G-SD-5-V1 146.3 POLYGONS
The Standard and the certification rules indicate that single/multi-farm CHs always need to
provide polygons of their farms. In the case of groups, the percentage of polygon data
increases from 10% in the core requirement in the first year of certification to 100% in
improvement L2 after six years.
For the core requirement 1.2.12, polygons will have to be provided for the largest farm unit
with the certified crop if the farm has multiple farm units (Figure 2). In the event that the
group includes both small and large farms, the CH will have to provide the required
percentage of polygons for the small farms (10%, 30% or 100%) and polygons for all the large
farms as indicated in requirement 1.2.13. The polygons of the large farms cannot be part of
the percentage of polygons mentionned in requirements 1.2.12, 1.2.14 and 1.2.15.
CHs can collect polygons using either of the two different methodologies set out below.
Section 6.3.1 below explains how polygons can be drawn using reference location points
and, 6.3.2 indicates how to collect polygons directly in the field.
6.4 Polygons based on reference location points
One method to draw polygons is by using reference location points that define the
boundaries of the farm(s)/farm unit(s). These points should ideally be located at the corners
or along the edges. Based on these points, a polygon boundary can be drawn using Google
My Maps, Google Earth, BaseCamp (Garmin free software), or any standard Geographical
Information System (GIS), provided the boundaries can be seen on satellite imagery. Using
Google Earth or the “My Maps” program of Google Maps, the user can import points
collected in the field, draw a polygon around these points, and then save the polygon as a
spatial KML file. Distinctive features such as roads, rivers, clearings, forest patches, live fences,
or large buildings can provide landmarks that help identify the site and fine-tune the digitized
boundaries. For detailed instructions, refer to section10. Detailed instructions for collection of
geolocation data of this guidance document.
Important: Polygon data should not be collected based only on deskwork because of the
high risk of imprecision. At a minimum reference location points should be collected in the
field and these can be used to draw the farm/farm unit polygons.
6.5 Polygons collected in the field
Another method is through the collection of polygons of farms/farm units directly in the field
using GPS devices (e.g. Garmin or Leica) or a GPS/GNSS-capable smartphone. In this
method, the data collector walks along the farm/farm unit boundary and clicks the device
at each corner to record that point (vertex) in the polygon (this approach is preferred to
“tracking” the path because recording the corners results in cleaner polygons that are easier
to manage and edit). There are several applications available where you can capture the
polygons in the field without too much additional deskwork, but they are not free. The Farm
Intelligence App, developed by the Rainforest Alliance, when available, offers an additional
tool for polygon data collection,.
Before submitting polygon data to the RACP the farm boundary polygons should be
reviewed in a map to identify and correct any inconsistencies. This can be done in Google
My Maps or Google Earth if a GIS software is not available. Ideally, farms should not overlap
and farms next to each other should share a common boundary. Boundaries that are known
to follow features that are easy to see in the imagery (such as roads and rivers) can be fine-
tuned to do so. This is also a good time to include/verify the certificate ID, the farm ID and
the farm unit ID (if applicable) in the fields associated with the polygon.
SA-G-SD-5-V1 157 GEOLOCATION DATA VERIFICATION
Before creating the risk maps, the RACP will validate the geodata provided by the user. As a
result of this process the Rainforest Alliance will identify mistakes with the geodata and
request the user to correct them before proceeding with the process. Example validation
checks made are:
• Location points that land outside of the area relevant for certificates, for instance
that land in the ocean or a neighboring country.
• Location points that land on top of each other (i.e. that are not unique).
• Location points with insufficient decimal places (should have 4, however flexibility can
accommodate cases where the last digit is 0).
• Coordinates with non-numerical values (e.g. coordinates cannot include the units,
north, south, east, west and decimals must be separated by a period).
• Farm polygons are reviewed to make sure they do not overlap, and the area is like
that reported for the farm.
Two common mistakes with point location data are misplaced signs and switched
(transposed) latitude/longitude values. To avoid this, the latitude/longitude values should be
transfered directly from the GPS to the computer electronically (e.g. use USB link or email the
file) and inserted digitally into the group member register.
Some issues cannot be identified as mistakes by the RACP and will thus require CB
verification. This is further explained in Section 7.2.1.
The geodata quality risk maps will indicate whether there are geolocation coordinates that
are repeated within the same group or across groups in the RACP. CHs are responsible for
correcting the mistakes identified by the RACP validations. If this is not done, the CH will not
be able to continue with the certification process.
SA-G-SD-5-V1 168 RISK MAPS
With the CH’s geolocation data, the RACP will develop maps for:
(1) deforestation risk,
(2) of encroachment into Protected Areas.
The Rainforest Alliance also checks the quality of geolocation data and will provide
feedback to the CH. These maps will give an overview of where there is an indication of
possible non-compliance with Standard requirements that needs to be corrected by the CHs
and, verified by auditors during the audit.
In the risk maps for deforestation and encroachment into protected areas (as explained
below), the user can see the color-coded indication of risk level of each farm which is part
of the certification scope. The legend included in the maps explains the meaning of the 3 risk
levels (high, medium, low).
In the case of deforestation, farms with indication of high deforestation risk are those that
overlap with the intersection of the “RA’s forest” layer or “Copernicus Global Land Cover”
layer (CGLC) and Tree Cover Loss (TCL).
For Protected Areas, farms with indication of high risk are those that overlap with protected
areas classified as “No-go”. Farms with indication of medium risk level for encroachment into
Protected Areas are those in overlap with Protected Areas classified as “Go”, meaning that
production is allowed under certain conditions (refer to Section 3 for the definitions). This will
have to be verified during the audit.
The map for geodata quality will indicate farms where the GPS data appears to be
repeated inside the group or with another CH.
If the risk maps show indication of high risk for deforestation, encroachment into Protected
Areas and/or geodata quality, CHs must take appropriate steps to addres the issues.
CHs will have access to the Rainforest Alliance risk maps in the RACP.
Every time the geolocation data is updated by the user, the risk maps provided by RA will
also be updated. The better the geolocation data (e.g. polygons instead of location points),
the more accurate the risk maps and thus, the better insights for the correct implementation
of the program.
8.1 DEFORESTATION RISK
This risk map will be produced by overlaying the geolocation data provided by the user with
the Rainforest Alliance’s Forest Layer or Copernicus Global Land Cover (CGLC)1 and Tree
Cover Loss (TCL2). The overlap of these layers with the specific location of farms will provide
an indication of deforestation that has occurred since the cutoff date of 2014 which shows
the current deforestation risk.
The Rainforest Alliance Forest Layer is used for ”countries identified as high risk for
deforestation.’’ The Copernicus Forest Layer is used for countries identified as medium or low
1 Copernicus program – European Space Agency
2 Hansen/UMD/Google/USGS/NASA
SA-G-SD-5-V1 17risk for deforestation. The Tree Cover Loss is used to detect the areas with forest loss inside the
forest cover. The table below shows the specifications and definitions used for these layers.
Dataset Specifications Definition
Rainforest Alliance Forest layer for Forest: land spanning more than 0.5
Forest Layer countries identified hectares with trees higher than 5 meters
as high risk for and a canopy cover of more than 10%,
deforestation. or trees able to reach these thresholds in
situ. It does not include land that is
Spatial resolution: predominantly under agricultural or other
10m. land use.3
Copernicus Forest Forest layer for Forest; Based on the Forest Type layer.
Layer countries identified Using at least 10% tree cover density and
as medium or low using Dominant Leaf Type (DLT) layer
risk for together with FAO’s forest definition to
deforestation. exclude and include areas.
Spatial resolution: For more information please check this
100m. link
Version: 3.0
Tree Cover Loss layer Hansen UMD Tree Tree cover: all vegetation greater than 5
(TCL) Cover Loss meters in height and may take the form
of natural forests or plantations across a
Spatial resolution: range of canopy densities.
30m.
Tree cover loss: defined as “stand
Version: 2.0.7 replacement disturbance”, or the
complete removal of tree cover canopy.
Table 1. Relevant definitions for deforestation risk
3For risky countries: If there is a national forest definition in the country with a clear minimum forest size threshold, this
definition will be used as long as the size threshold is < 0.5 ha, otherwise the forest definition described will be
implemented.
SA-G-SD-5-V1 188.2 RISK OF ENCROACHMENT INTO PROTECTED AREAS
This map will be the result of overlaying the geolocation data with Protected Areas
information provided by governments or, available in the World Database on Protected
Areas (WDPA). The overlap will indicate whether CHs are producing inside Protected Areas
and whether such production is allowed according to applicable law.
The following table shows the categorization of Protected Areas in “go” and “no-go” areas
following the International Union for Conservation of Nature (IUCN) standards.
IUCN Category Name Rainforest Alliance
Classification
Ia Strict nature reserve No-go
Ib Wilderness area
II National park
III Natural monument
IV Habitat/species management area Go
V Protected landscape
VI Protected area with sustainable use of
resources
Not Reported For protected areas where an IUCN
category is unknown and/or the data,
the provider has not provided any
related information.
The IUCN Management Categories do
Not Applicable
not apply to a specific designation
type. This currently applies to World
Heritage Sites and UNESCO MAB No-go
Reserves.
Not Applicable also applies to a site
that does not fit the standard definition
of a protected area (PA_DEF field = 0).
The protected area meets the standard
Not Assigned
definition of protected areas (PAF_DEF
= 1) but the data provider has chosen
not to use the IUCN Protected Area
Management Categories.
Table 2. Classification of "Go" and "No-go" Protected Areas
SA-G-SD-5-V1 198.3 GEODATA QUALITY
The Geospatial Platform works on algorithms or a set of rules that analyze the quality of the
geodata and determine whether there are issues that need to be corrected by the user or
further analyzed as a risk indicator during the audit. This feedback will be provided to the
relevant users. This will ensure that the deforestation and Protected Areas risk analyses are
done with good quality geolocation data.
8.4 USE OF RISK MAPS
As mentioned in Section 6, CHs will be asked to provide/update geolocation upon
registration and, before the audit. This data will be used to produce the “registration” risk
maps and the “audit” risk maps for deforestation and encroachment to protected areas.
Based on the results of the “registration” risk map, the CH shall assess the indication of risk
levels of the farms regarding conversion of natural forests and other natural ecosystems
(standard requirement 6.1.1) and, production and processing in Protected Areas and
designated buffer zones (standard requirement 6.1.2). Furthermore, the CH should adapt the
management plan and implement the appropriate risk mitigation measures as indicated in
the Certification Rules. See Guidance M: Natural ecosystems and vegetation, section 1; risk
maps for potential actions in the management plan.
SA-G-SD-5-V1 209 DATA REPORTING
The following table indicates the files and the accepted formats that must be used when
reporting the geolocation data in RACP. This is indicated per standard requirement and it is
applicable for both the CHs and CBs:
Standard Files to be submitted Accepted format
requirement
1.2.12 One file with the location points* for • Group Member Registry
90% of the farms. (GMR) template (using the
(100% of columns for latitude and
geolocation *Point collected in largest farm unit with longitude).
data at farm certified crop, in case of multiple farm
level) units.
One file with the polygons* for at • KML or GeoJSON.
least 10% of the farms
*Polygon collected in largest farm unit
with certified crop, in case of multiple
farm units.
1.2.13 One file with the polygons of the • KML or GeoJSON.
farm, including all farm units.
1.2.14 (L1) One file with the location points for • Group Member Registry
70% of the farm units. (GMR) template (using the
(100% of columns for latitude and
geolocation longitude).
data at farm
unit level)
One file with the polygons for at least • KML or GeoJSON.
30% of the farm units.
1.2.15 (L2) One file with the polygons for 100% of • KML or GeoJSON.
the farm units.
Table 3. Accepted formats and templates for geolocation data
In the case of groups made up of large farms, the file mentioned in relation to requirement
1.2.13, in the table above, shall contain the polygons of all the large farms which are part of
the group.
Group with a mix of smallholder and large farms,will have to provide the files mentioned in
relation to requirements1.2.12/1.2.14/1.2.15 and 1.2.13. Ths means the CH will have to provide
3 files:
(1) GMR with the points of the farms/farm units (if applicable),
(2) KML or GeoJSON with the polygons of the smallholder farm/farm units and,
(3) KML of GeoJSON with the polygons for the large farms part of the group.
SA-G-SD-5-V1 21CHs can also provide the envelope of the geographical scope as part of the registration
process. Nevertheless, as part of the audit preparation they shall provide the applicable files
mentioned in the table above
Every year, for every certification or verification audit, the CHs shall provide again the files
with geolocation data (points and polygons). These files must be up to date.
When using the GMR for providing the location point, the file shall also have the following
data points: Group Member’s identification number, Farm National ID, Farm internal ID (if
national ID not available), farm area, Farm unit ID and farm unit area (for farm units).
Files containing polygons (KML or GeoJSON) shall have the Group Member’s identification
number, Farm National ID, Farm internal ID (if national ID not available) (for farms) and, the
Farm unit ID (for farm units) (More information in Chapter 4).
9.1 GPS data reporting for application for minor exceptions for
infrastructure management
CHs applying for a minor exception for conversion for infrastructure management (see
Standard’s Annex S12) will need to provide geolocation data in the form of
(1) a polygon of the certified area and,
(2) a polygon of the converted area to the CB before the audit (best before the
conversion takes place).
CHs also need to demonstrate that the conversion is planned or was below 1% of the
certified area (these polygons are provided directly to the CB and not yet in the RACP).
10 DETAILED INSTRUCTIONS FOR COLLECTION OF
GEOLOCATION DATA
This section provides step-by-step instructions on the use of several simple and free
applications that can be employed to help meet the data collection requirement discussed
in these guidelines. The apps presented here are far from a comprehensive list, and CHs are
free to use any application or devices (e.g. Garmin, drone) that works for them, as long as
the data provided to the Rainforest Alliance follows the indications included in the Standard
and explained in this document. The Farm Intelligence App, developed by the Rainforest
Alliance, offers an additional tool for geodata collection available to CHs only (this will be
explained in a separate document). CHs may also consult with local government agencies
and land registries for geolocation data.
If you are collecting geolocation data with mobile devices (cellphone, tablet), you make
sure to have them fully charged and, if possible to have a power bank available.
10.1 LOCATION POINTS
Most smartphones and tablets do have a GPS receiver built-in to estimate your current
location, and there are many apps that help you use this for mobile mapping. Presented
here are several examples of apps that are free, easy to use, and work offline. These
programs should be configured in the settings to report the location in decimal degrees. The
location coordinates can either be: 1) saved as “waypoints” within the app and transferred
digitally to a computer, or 2) read off the app display and then recorded manually in a
notebook. The first approach is preferred.
Location points can also be used as a “reference” for drawing polygons of the farms. If this is
the case, 1.1 and 1.2 explain how to collect them and, 2.1 provides additional tips for the
correct identification of the reference points.
SA-G-SD-5-V1 2210.1.1 Google My Maps
Google My Maps is both a mobile app and a web-based application that runs on your
desktop. The My Maps mobile app is linked to the Google Maps app that comes standard
with many phones to provide additional functionality. It must be downloaded from the app
store and installed as a separate application. Once you have installed the app on your
device and logged in with your Google account, you can create your own maps and add
GPS points to these maps.
Figure 3. Screenshot of Google My Maps application in the play store
10.1.2 Create a new web map
Create a new map using the web-based application. It is good practice for CBs to create a
map for each of the CHs to be audited so that the data can be adequately managed. In
the case of CHs, this could be used for organizing the regions in which farms are located.
Figure 4. Creating a new map in web-based application
Change the base map to “satellite” for better visualization of the conditions in the field.
SA-G-SD-5-V1 23Figure 5. Change the base map to “satellite”
10.1.3 Create a new empty layer in the web map
Name your map, create layers for managing the geolocation data and, name those too.
Layers allow better visualization of the geolocation data if other layers of data, like Protected
Areas, are present.
Figure 6. Name map and layers
10.1.4 Insert the attributes needed in the layer
The layer you created in the step above is empty. This means that there are no columns
(attributes) to be filled in yet. To create the needed attributes, click on the three dots as
shown in the screenshot below, then select open data table.
SA-G-SD-5-V1 24Figure 7. Open the layer’s table to add columns (attributes)
Once the previous step is done you will see an empty table, with only 2 columns: name and
description. To add new columns, select the little arrow next to one column, and click on
insert column after or insert column before. With this, you will see a window that allows you to
insert the column’s name and data type.
Figure 8. Screenshot on how to insert columns
For each attribute (column), you will need to indicate the correct data type. This last step
ensures that you don’t have undesired values. For instance, you would want the “FarmArea”
field to be filled in with numbers and not with text.
SA-G-SD-5-V1 25Figure 9. Choosing data type for attributes
CHs and CBs could use the attributes (columns) to structure the geolocation data collection.
The farm ID and farm unit ID shall be used to identify farms and farm units, respectively. In
some countries, the farm ID could be indicated by the government whereas in others, this
would be an identification number created by the group management. Other attributes are
the farm area, farm unit area and any other data that would be useful for the audit and, the
Group management. When reporting geolocation data to RA, both CHs and CBs shall
provide the required attributes and data points as mentioned in Section 8.
Attributes (column name) Data type
Group Member Text
identification
FarmID Text
FarmUnitID Text
FarmArea(ha) Number
FarmUnitArea(ha) Number
Other fields (optional) Text/Number
Table 4. List of attributes for location point data collection
After adding the desired attributes (columns), you can also choose the one that will identify
the geolocation data. For this, follow the steps shown in the figure below.
SA-G-SD-5-V1 26Figure 10. Choosing name/title for location point data
Once you have collected the geolocation data and the other attributes, you will see a table
like the following, where all the columns (attributes) have the desired information.
Figure 11. Data table example
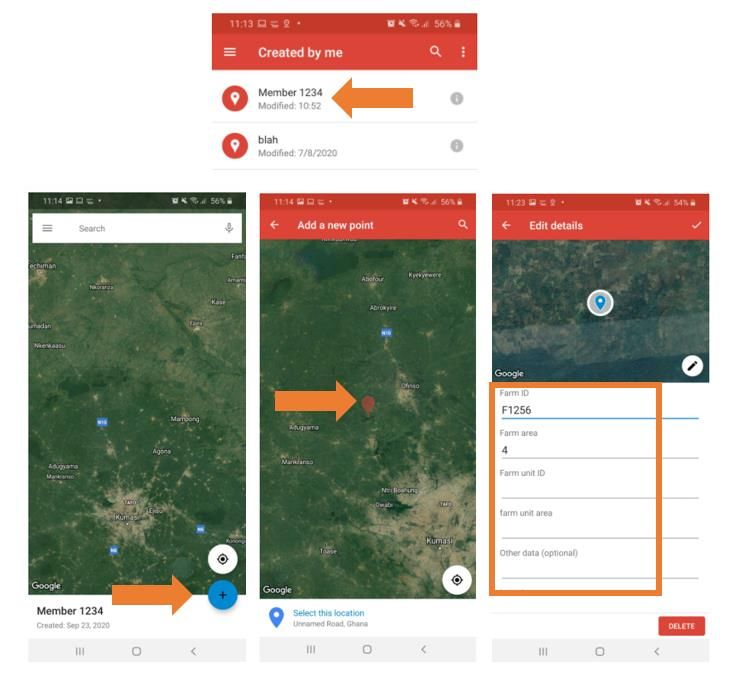
10.1.5 Collect data
To record a location point while in the field, open the My Maps app on your mobile device,
open a map previously created and click the blue “+” sign in the lower right corner, click on
“Add a new point”, select the location, select the layer, and give the point a name. You can
also add points by touching and pressing the screen for several seconds at the desired
location until you are prompted to name and save this point.
After naming the point, you will see the other data fields you should fill in (these were defined
when you modified the data table in 1.1.3). Note that when you create a point, the
latitude/longitude coordinates are displayed at the bottom of the point’s information
window.
SA-G-SD-5-V1 27Figure 12. Collection of points in the field
When you return from the field and connect with the Internet, your mobile maps
automatically synchronize with your desktop web-based Google My Maps program, where
you can view and edit your maps, and export the data as a KML file.
Figure 13. Synchronization with web-based application
SA-G-SD-5-V1 2810.1.6 How to extract location points from Google My Maps
Google My Maps generates KML files that allow you to visualize the location points in the
map. However, this doesn’t allow you to see the points in a table that you can easily modify
and copy-paste in other files, like the Excel Group Member Registry (GMR). If you desire to do
this, you should convert the KML file to Excel. To do so, follow the steps below:
Export the KML file from Google My Maps: it can be done by clicking on the dots of the layer
→ export to KML/KMZ.
Figure 14. How to export your data into KML file
Before this, please make sure that:
• You selected only the layer you’re interested in (in the screenshot for example our
layer is called “Geolocation data member 1234’).
• Check the box of “Export layer as KML instead of KMZ”.
Figure 15. Exporting a KML
Once your file is downloaded, the last step is to convert the KML into a CSV file. You can use
different apps and webtools for this; one example is http://geojson.io/. To upload your KML
file to the website, from top-left you can click on open → file.
SA-G-SD-5-V1 29Figure 16. Uploading a KML file to the webtool
If your KML has been uploaded correctly, you will see your points on the map. If needed, you
can also modify the attributes by clicking on table (top-right).
To convert the file, always from top-left side you should click on save → CSV.
Figure 17. How to convert your KML into a CSV file
If all the previous steps are done correctly, you can now see your data in the CSV file.
SA-G-SD-5-V1 30Figure 18. KML converted into CSV
To visualize your data properly in excel (coordinates included), click on the first column, then
from the data tab, click on text to column function.
Figure 19. Visualizing CSV in Excel
A window will appear and you’ll need to follow 3 steps:
• Step 1: just click on next.
Figure 20. Step 1
• Step 2: be sure to check the boxes tab and comma, then click on next.
SA-G-SD-5-V1 31Figure 21. Step 2
• Step 3: click on finish.
Figure 22. Step 3
SA-G-SD-5-V1 3210.2 POLYGONS BASED ON REFERENCE LOCATION POINTS
Some mobile apps allow for the collection of lines and polygons in addition to points. If this is
not the case it is easy to first collect reference points in the field and then use a desktop
program to turn these into a farm polygon.
To do so, first collect reference location points in the field using the same steps described in
above. Collect a point in one location, name it (e.g. “southeast corner”), and then move to
a new location on the farm. As you move to a new location, you should notice that the
latitude/longitude location changes only slightly. At the new location, create a new
waypoint, and give this a new name (e.g. “northeast corner”). Make sure to collect these
points along the edges of the farm; just a few points should be enough to mark the
approximate edges of most farms. Points should then be transferred/synced to a computer
as previously described, then the user can proceed to with 10.2.1 or 10.2.2, below.
Numerous (GIS) and web-mapping computer programs can be used to draw farm polygons.
Once you have collected reference points in the field, you can import them into one of the
programs below, which will make it easier to confidently draw the full extent of your farm
polygon(s). Here we present just two web-mapping programs that are free and easy to use:
Google My Maps and Google Earth.
10.2.1 Google My Maps
The mobile version of Google My Maps is an extension of Google Maps, and syncs
automatically with the web-based Google My Maps app. Therefore, your mobile map can
be accessed and edited in any Internet browser on your desktop (after you sign in using your
Google account). Since maps are web-based, they can be shared and edited by multiple
users. To use Google My Maps, sign-in with your Google credentials. This will take you to the
My Maps home screen, where you can access the maps previously created or, create a new
map, if needed. Note that My Maps looks similar but slightly different to the traditional
Google Maps viewer.
Upload data into Google My Maps
Once you have opened your map in the web Google My Maps, as explained in section 1.1,
you can edit the data you collected in the field and incorporate other spatial data you
might have access to, such as provincial boundaries, Protected Area layers or, previously
collected locations. To do this, you can create a new layer and import the file(s) as
explained in 1.1.2.
Create and edit polygons in Google My Maps
Use the line tool to draw the perimeter of the farm area, clicking to create a vertex at every
corner, and then clicking on the first point to complete the polygon. If you have collected
reference points from the field and imported them to Google My Maps, these can help you
determine where to draw the polygon vertices. When you are finished, enter the polygon
name and description, and save.
SA-G-SD-5-V1 33You can also read