Blantyre Invest in Malawi: Focus BLANTYRE January 2011 - Columbia University
←
→
Page content transcription
If your browser does not render page correctly, please read the page content below
Blantyre Invest in Malawi: Focus BLANTYRE January 2011
INVEST IN MALAWI:
FOCUS BLANTYRE
January 2011

Millennium Cities Initiative, The Earth Institute
Vale Columbia Center on Sustainable International Investment
C olumbia University, New York, 2011

                                                               i
Disclaimer

This publication is for informational purposes only and is meant to be purely
educational. While our objective is to provide useful, general information, the Millennium
Cities Initiative, the Vale Columbia Center on Sustainable International Investment and
other participants to this publication make no representations or assurances as to the
accuracy, completeness, or timeliness of the information.

The information is provided without warranty of any kind, express or implied.
This publication does not constitute an offer, solicitation or recommendation for the sale
or purchase of any security, product or service. Information, opinions and views con-
tained in this publication should not be treated as investment, tax or legal advice. Before
making any decision or taking any action, you should consult a professional advisor who
has been informed of all facts relevant to your particular circumstances.

Printed in Colombia. Invest in Malawi: Focus Blantyre © Columbia University, 2011. All rights reserved.

     ii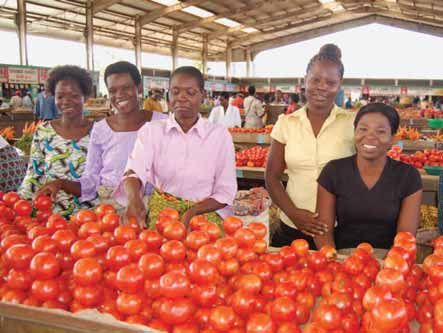
Foreword

VALE is proud to be one of the largest investors in two of Malawi's neighbors,
Mozambique and Zambia. Malawi itself has a number of very interesting investment
opportunities to offer in the mineral resources sector, the main area of VALE's activities.
And Blantyre, as the country's commercial capital, is naturally the focus of much
foreign investment.

While VALE has not yet invested in Malawi, or in Blantyre in particular, it has strong
investment interests in the region that could well come to include Malawi. If VALE invest-
ed in Malawi, it would follow its practice in all developing countries: helping develop
infrastructure, forging partnerships with local businesses, and building strong and mutu-
ally beneficial relationships with local communities.

When it invests in developing countries, VALE brings with it not only transfer of
technology and skills, but also the possibility of higher government revenue, more
employment, higher salaries and larger household incomes.

The present Investors' Guide for Blantyre reflects the transparent and supportive environ-
ment the Government of Malawi has created over the last decade, an environment essen-
tial to boosting private-sector growth. The Guide provides useful information on
investment opportunities in Blantyre as well as in the region surrounding it. Contact
details of relevant organizations are also included.

As the Guide makes it clear, Malawi is open for business, and VALE looks forward to the
prospect of becoming part of this country's growing economy as a long-term,
committed partner.

Roger Agnelli
Chief Executive Officer
VALE
Rio de Janeiro, Brazil

                                                                                              iii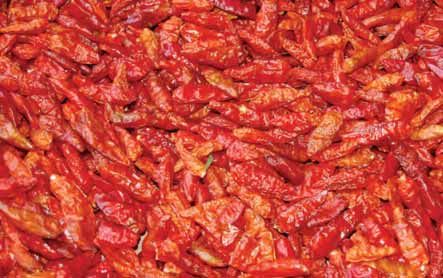
Preface

Malawi, along with 189 other countries, adopted the Millennium Declaration in 2000,
which set out the Millennium Development Goals (MDGs), to be achieved by 2015. The
Ministry of Development Planning and Cooperation spearheads the MDG implementa-
tion process in Malawi.

To help the implementation process, The Earth Institute at Columbia University launched
the Millennium Cities Initiative (MCI) to assist cities in sub-Saharan Africa become more
viable and, indeed, prosperous. The Initiative is guided by Jeffrey D. Sachs. At present, 11
cities in eight African countries benefit from its work: Mekelle, Ethiopia; Accra and
Kumasi, Ghana; Kisumu, Kenya; Blantyre, Malawi; Bamako and Segou, Mali; Akure and
Kaduna, Nigeria; Louga, Senegal; and Tabora, Tanzania. For more on MCI, please see the
MCI website: http://mci.ei.columbia.edu/.

The Millennium Cities were chosen in part for their proximity to the Millennium Villages
(http://www.millenniumvillages.org/). In the case of Blantyre, the third Millennium City
to publish an investors' guide, the Millennium Village is located in Mwandama, Zomba
district.

This Guide is part of the MDG implementation effort. It was prepared by MCI and the Vale
Columbia Center on Sustainable International Investment (VCC), a joint center of Columbia
Law School and The Earth Institute. Its purpose is to help Blantyre attract more investment,
including foreign direct investment, and create a sustainable basis for economic growth and
development and hence the reduction of poverty, the first of the MDGs.

The idea behind this Guide is to offer the reader a brief description of investment opportu-
nities in the Blantyre area, supplemented by an analysis of the investment climate, placing
the city in the broader context of Malawi and south-eastern Africa. MCI does not believe
that serious investors can be attracted to an area through a purely promotional approach,
one that focuses on the positive while hiding the negative. The Guide is therefore written to
be credible. The challenges that potential investors would face are described along with the
opportunities they may be missing if they ignore Blantyre.

The Guide is intended to make Blantyre and what Blantyre has to offer better known to
investors worldwide. Although we have foreign investors primarily in mind, we believe
that the Guide will be of use to domestic investors in Malawi as well. While by no means
the sole driver of growth and development, foreign direct investment does have a distinc-
tive role to play. Not only does it bring scarce capital, it also brings know-how, technology
and access to foreign markets. Furthermore, it helps improve the competitiveness of
domestic enterprises, which must be the foundation of all growth.

We hope that our investor readers find this Guide a useful and practical tool.

Karl P. Sauvant
Co-Director, Millennium Cities Initiative and
Executive Director, Vale Columbia Center on Sustainable International Investment
New York, January 2011

     iv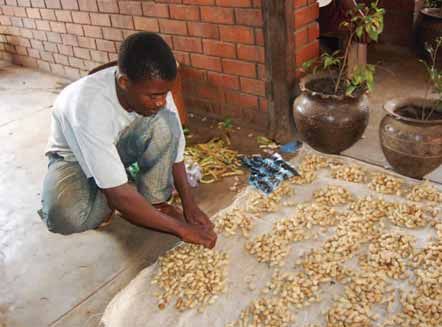
Acknowledgements

This Guide was prepared by the Millennium Cities Initiative (MCI) of The Earth Institute
at Columbia University (see Preface), under the responsibility of Karl P. Sauvant, Co-
Director, MCI, and Executive Director, Vale Columbia Center on Sustainable International
Investment (VCC), and Joerg Simon, Senior Investment Adviser, MCI. We are grateful to
the Malawi Investment Promotion Agency (MIPA), the Privatisation Commission, and the
Malawi Confederation of Chambers of Commerce and Industry (MCCCI) for their assis-
tance to the project. We thank Vishwas P. Govitrikar, the lead consultant for the Guide,
and Pempho Nkaonja, the MCI investment representative in Malawi, for their role in
developing this Guide. Paulo Cunha assisted with editing.

Our thanks also go to the executives and government officials who met with our lead
consultant or local representative and provided valuable feedback on the investment
climate in Blantyre. Among these, we should particularly like to thank Jason Agar, Beatrix
Aroni, Frank Chantaya, Wise Chauluka, Mathews Chikaonda, K.K. Desai, Misheck Esau,
Mahesh Josyabhatla, Kiran Josyabhatla, Gabriel Kambale, Tom Kanyuka, Khuze Kapeta,
Salim Karim, Jones Katangwe, Edward Khoromana, Shalom Konyani, L.C. Mandala,
Patrick Mbejere, Bardon Mbera, Mike Mbewe, Jean-Claude McMenamin, Charles Merick,
Mudassir Mukadam, Emmanuel Munthali, Innocent Mushava, Rehema Mvula,
Audrey Mwala, Chikondi Ng'ombe, Dumisani Ngulube, Kassam Okhai, R. Omar, and
Ahmed Sunka. We are also grateful to those who participated in a meeting organized
by the MCCCI.

The preparation of this Guide was undertaken in parallel with three other related efforts,
all focusing on investment opportunities in Blantyre and the regulatory framework gov-
erning it, by KPMG, UNIDO, and DLA Piper. Special thanks go to VALE, a multinational
enterprise from Brazil, which has sponsored the printing of the Guide and is also
supporting its dissemination. We thank the Corporate Council on Africa (CCA) and
the European Business Council for Africa and the Mediterranean (EBCAM) for their
cooperation in this project.

Photographs for the Guide were provided by Sauti Photographics and the Blantyre City
Assembly. Nelson Vigneault designed the Guide.

                                                                                             v
Table of contents

 ii   Disclaimer
iii   Foreword
iv    Preface
 v    Acknowledgements
vi    Table of contents
 1    Executive summary
 2    Maps
 3    Malawi and Blantyre in brief

 5    I. The broader context
 5    I.1. A sketch of Malawi and the region
 5    • The country
10    • The region
11    I.2. The economy
13    • Markets for investors
15    • Exports and imports
18    • Foreign direct investment
18    • Aid, debt, reserves, etc.

21    II. Investing in Blantyre
21    II.1. Introduction
22    II.2. Opportunities for investors
22    • Main areas of interest to potential investors
35    • Other areas of interest to potential investors
40    II.3. Incentives, EPZs and related matters
40    • Incentives in Malawi
41    • EPZ status
41    • Investment and tax treaties
43    II.4. The business environment
43    • Infrastructure
56    • Human resources
59    • Doing business in Malawi
61    II.5. Blantyre as an investment location: A summary for investors

vi
63   III. Taxes and laws
63   III.1. Taxation in Malawi
63   • Direct taxes
64   • Indirect taxes

66   III.2. Legal framework for investment
67   • Investment law
68   • Incorporation and exit
69   • Priorities and restrictions
70   • Investment protection, investor treatment and dispute settlement
72   • Land
73   • Foreign exchange, etc.

75   IV. Investors and investment climate
75   IV.1. Investor assessment of the investment climate
77   IV.2. Foreign investors in Blantyre and in Malawi

79   Appendices
79   A. List of domestic investors interested in foreign collaboration
81   B. Pointers to further information
84   C. Public holidays in 2010

85   Sources consulted

                                                                          vii
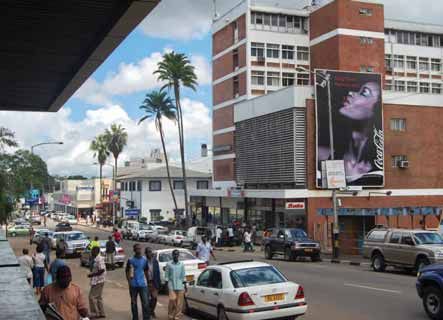
BLANTYRE, NAMED AFTER THE SCOTTISH MISSIONARY
DAVID LIVINGSTONE’S BIRTHPLACE IN SCOTLAND,
IS THE COMMERCIAL CENTER OF MALAWI.
SURROUNDED BY BEAUTIFUL HILLS, THE CITY OFFERS
INVESTORS ABUNDANT RESOURCES IN LAND, HUMAN
RESOURCES AND RAW MATERIALS, AMONG OTHERS.
IT IS ALSO WELL SERVED BY RAIL, ROAD AND AIR LINKS
TO REGIONAL DESTINATIONS, WHICH IS AN ADVANTAGE
FOR EXPORTERS.

Costly Chanza, Director, Town Planning and Estate Management Services,
Blantyre City Assembly

     viii
EXECUTIVE SUMMARY

Blantyre, founded in 1876, is the second largest city in Malawi – with a 2008
population of 661,444. Until just ten years ago, it was the largest city, but the growth
of the capital, Lilongwe (with a 2008 population of 669,021), has now outstripped
that of Blantyre. The city remains, however, the country’s commercial capital, apart
from being the capital of the Blantyre District and the Southern Region. Blantyre’s
economic primacy is manifest in its hosting of the Malawi Stock Exchange, the Malawi
Confederation of Chambers of Commerce and Industry, Central East African Railways
(formerly Malawi Railways), and the Malawi Broadcasting Corporation, among other
institutions.

Politically, Blantyre is governed by the City Assembly. Although the city is supposed
to have elected councilors, it is currently operating without them. Assembly elections
will, however, take place in April 2011. As far as foreign investors are concerned,
they need to deal directly with the Government of Malawi. All foreign investors’
applications are processed by the Malawi Investment Promotion Agency (MIPA),
which has an office in Blantyre.

Investors regard the infrastructure in Blantyre as one of its major advantages as an
investment location in Malawi. It is relatively well connected with both other
population centers in Malawi and with neighboring countries, in particular the ports
in Mozambique, Beira and Nacala. In comparison with other locations in Malawi,
Blantyre also has good electricity coverage and access to running water, in addition
to being a good source of educated workers.

Opportunities in Blantyre for foreign investors are varied. The raw materials for a
number of agro-processing activities are produced in and around the Blantyre region
in various proportions, including tea, groundnuts, cotton and, above all, chilies.
The chili-processing business offers a serious opportunity for building export-oriented
facilities to create value-added products such as chili sauce. As for groundnuts, with
Malawi’s Chalimbana variety being prized for its size and flavor, opportunities for
foreign investors include those in wholesaling, grading, and quality testing for export
markets; peanut butter production for local and regional markets; and oil extraction for
domestic and international markets. Textiles are another area of opportunity. Malawi’s
garment exporters, who have privileged access to the United States market under the
African Growth and Opportunity Act (AGOA), currently import their fabric from Asia,
but will not be able to do so after 2012 by AGOA rules. A new spinning
and weaving facility producing AGOA-compliant fabric is thus very much needed if
Malawi is to retain one of its top exports. Two other opportunities worth mentioning
are in tourism and mining. There is need for a high-end hotel targeting business
travelers, and the Blantyre City Assembly (BCA) has identified the land for this
purpose. In mining, there is potential in bauxite, limestone and semi-precious stones
in particular.

                                                                                           1
2
Malawi in brief

           Official name:               Republic of Malawi
                  Capital:              Lilongwe
     Form of government:                Multi-party democracy
        Head of state and
          of government:                President Bingu wa Mutharika

                   Location:            South-eastern Africa (see map).
                Surface area:           118,480 sq. km, of which water 24,4000 sq. km.
                    Climate:            Sub-tropical. Warm and wet November to April, with
                                        rainfall from 725 mm to 2,500 mm. Cool and dry May to
                                        August. Temperatures vary according to region. Minimum
                                        and maximum averages in degrees Celsius in July are in the
                                        Northern region 5-20, Central region 10-25, and Southern
                                        region 12-22; in November they are in the Northern region
                                        17-27; Central region 17-29; and Southern region 18-28.

                   Population:          13,066,320 (2008 census).
                    Religions:          Christian 82.7%, Muslim 13%, Other 1.9%, None 2.4%
                                        (2008 census)
                   Languages:           English is the official language and Chichewa the
                                        national language. Other languages include
                                        Chinyanja, Chiyao and Chitumbuka.

                            GDP:        USD 3.5 billion. At purchasing power parity,
                                        USD 10.6 billion.
            GDP per capita:             USD 270. At purchasing power parity, USD 815.
                 Currency:              Malawian kwacha (MWK).
             Exchange rate:             USD 1 = MWK 151 (UN operational exchange rate
                                        of December 2010).

                   Time zone:           GMT + 2 hours.

Blantyre in brief

                      Location:         282 km southeast of Lilongwe, Malawi’s capital.
                       Climate:         Average temperatures 17°C to 27°C in November and
                                        12°C to 22°C in July. Annual rainfall 1,127 mm.

          Notable features:             Second largest city in Malawi and the country’s
                                        commercial capital.

                   Population:          661,444. Blantyre district 999,491 (2008 census).
                     Religion:          Roughly the same distribution as for Malawi (see above).
                   Languages:           Mainly Chichewa and English.

        Economic activity:              Wholesale and retail trade, food-processing, garments,
                                        banking.

Source: Millennium Cities Initiative, The Earth Institute, and the Vale Columbia Center on Sustainable International
Investment, Columbia University (hereafter “Millennium Cities Initiative and Vale Columbia Center”),
drawing on various sources.

                                                                                                                       3
As for markets, the domestic market in Malawi is small but growing. Access to the
regional market is provided by the Common Market for Eastern and Southern Africa
(COMESA) and the Southern African Development Community (SADC) - the East
African Community (EAC) is expected soon to establish a tripartite free-trade area
with both of these institutions. Foreign markets to which Malawi has preferential
access include the European Union, under its “Everything But Arms” (EBA) initiative,
and, as mentioned above, the United States, under AGOA.
Although the operating environment is not without its challenges, in particular with
regard to the uneven supply of power and water, Blantyre remains an attractive
location in the region, given its business-friendly environment, pleasant highland
climate, transport connections with the region, and access to a low-cost
English-speaking workforce.
MALAWI’S PROACTIVE GOVERNMENT, FRIENDLY
BUREAUCRACY, COMPETITIVE TAX REGIME, FAST-GROWING
ECONOMY, AND STABLE POLITICAL ENVIRONMENT MAKE
IT THE FIRST CHOICE FOR INVESTORS IN COMESA AND
THE SADC.
Mahesh Josyabhatla. CEO, Bakhresa Grain Milling (Malawi) Limited
4I. THE BROADER CONTEXT
1. A sketch of Malawi and its region
The country
Malawi is a small country (about one-third the size of Germany) in south-eastern
Africa. It is landlocked, sharing its borders with Tanzania in the north and northeast;
Mozambique in the east, south and southeast; and Zambia in the west. The country is
lozenge-shaped and against two-thirds of its long eastern border lies Lake Malawi, the
country’s most notable physical feature. This is the third largest of the great lakes of
Africa, after Lake Victoria and Lake Tangyanika, and the second deepest. Like the
country, the lake is long and narrow in shape: about 580 km in length and about
75 km wide at its widest point.
The European discovery of the lake was made by David Livingstone, a Scottish
physician and missionary, in 1859. Livingstone named it Lake Nyasa and the land
around it became the British protectorate of Nyasaland in 1891. In 1953, the British
territories of Southern Rhodesia (now Zimbabwe), Northern Rhodesia (now Zambia)
and Nyasaland were combined into the Central African Federation. The emerging
African nationalism was opposed to the idea and the Federation was dissolved in 1963.
The following year Nyasaland became independent, led by the Prime Minister, Dr.
Hastings Kamuzu Banda. By 1971, Banda had become President for Life of the
Republic of Malawi, a one-party state governed by the Malawi Congress Party (MCP).
The 30-year authoritarian and pro-western rule of Dr. Banda was not without its
positive aspects. The economy did well and much was done to improve infrastructure,
in particular roads. In 1993, under both internal and external pressure, a referendum
was held which resulted in the establishment of a multi-party democracy. In the 1994
election, Banda was defeated by Bakili Muluzu of the United Democratic Front (UDF),
who served two terms as President. (The MCP remains an important political party
today.) The election in 2004 was won by President Bingu wa Mutharika, who won his
second term in May 2009. The presidential term of office is five years and the next
election is due to be held in May 2014.
The unicameral National Assembly has 193 representatives, elected to five-year terms.
The parliamentary and presidential elections are held in parallel. The leading political
parties in the National Assembly - apart from President Mutharika’s Democratic
Progressive Party (DPP), which now has 114 seats - are the aforementioned MCP
and UDF. There is also a significant number of independent members without
party affiliation.
Administratively, Malawi is divided into three regions – Northern, Central and Southern
– and 28 districts. The Southern Region is the most populous, with a population of
nearly 5.9 million out of a national population of just over 13 million. The Central
Region is almost as heavily populated with 5.5 million, while the Northern Region
5contains only 1.7 million people. The largest cities are the capital Lilongwe, 1 Government of
Malawi, National
in the Central Region, which had a population of 669,021 according to the census Statistical Office, 2008
Population and Housing
conducted in June 2008, and Blantyre, the capital of the Southern Region and the Census: Preliminary
focus of this Guide, which had 661,444 residents. The population growth rate in Report, September
2008.
Malawi, as well as in Blantyre, is currently 2.8%. The population is overwhelmingly
rural, with some 85% of it engaged in agricultural occupations.1 2 Freedom House,
Country Report:
Malawi, 2009,
http://www.freedom-
The main ethnic groups in Malawi, which all have their own languages, are the Chewa house.org/template.cf
(over half the population), the Nyanja, the Tumbuka and the Yao. There are also tiny m?page=22&year=20
09&country=7653,
minorities of people of Asian (mainly Indian) and European descent, which are April 2009.
concentrated in and around Blantyre, the commercial capital of the country.
Just over 80% of Malawians are Christian, mainly protestant, and just fewer than 15%
are Muslim. English is widely spoken, especially in urban areas.
Despite some irregularities, elections in Malawi have generally been free and fair.
Freedom of the press is legally guaranteed and, despite occasional restrictions, the
several newspapers in Malawi present a diversity of opinion, according to the US-based
Freedom House.2 Radio stations and television channels are mainly, though not entire-
ly, state-controlled. President Mutharika has made fighting corruption the hallmark of
his administration and the Anti-corruption Bureau has prosecuted some high-profile
cases, including one involving a cabinet minister.
The three tables that follow are drawn from the World Bank’s Governance Matters website.
Malawi’s performance generally ranks somewhere in the middle in its neighborhood.
Among the three indicators shown below, in controlling corruption, Malawi does better
than three countries and worse than three others.
6Country Sources Percentile Governance scoreb Standard
ranka (%) (-2.5 to +2.5) error
Table I.1. Control of corruption, comparison across selected countries, 2008
Burundi 11 15.9 -0.97 0.17
Kenya 17 13.5 -1.01 0.14
Malawi 15 33.8 -0.59 0.15
Mozambique 16 34.3 -0.55 0.14
Rwanda 8 59.4 0.03 0.19
Tanzania 14 36.2 -0.51 0.16
Uganda 17 23.2 -0.79 0.14
Table I.2. Voice and accountability, comparison across selected countries, 2008
Burundi 12 28.4 -0.66 0.14
Kenya 17 43.3 -0.16 0.11
Malawi 16 42.3 -0.18 0.12
Mozambique 16 47.6 -0.02 0.11
Rwanda 12 13 -1.24 0.13
Tanzania 15 45.2 -0.09 0.13
Uganda 17 33.2 -0.47 0.11
Table I.3. Rule of law, comparison across selected countries, 2008
Burundi 14 13.9 -1.07 0.15
Kenya 19 17.7 -0.98 0.13
Malawi 18 47.4 -0.29 0.14
Mozambique 19 28.2 -0.66 0.13
Rwanda 12 38.3 -0.50 0.17
Tanzania 17 47.8 -0.28 0.14
Uganda 19 36.8 -0.51 0.13
Source: All three tables have been adapted from the World Bank’s Governance Matters 2009,
http://info.worldbank.org/governance/wgi/mc_chart.asp, date accessed December 2009.
a Percentile rank indicates the percentage of countries worldwide that rate below the selected country, so higher values indi-
cate better governance ratings. Percentile ranks have been adjusted to account for changes over time in the set of countries
covered by the governance indicators.
b Governance scores range from worst at -2.5 to best at +2.5.
7When it comes to voice and accountability, a measure of effective participation by 3 FAO, Malawi: Fishery
and Aquaculture Country
citizens, Malawi is again in the middle, with three countries above and three below. Profile at
hhtp://www.fao.org/fi
shery/countrysector/F
On the third indicator, the rule of law, which measures the confidence of citizens in the I-CP_MW/en, date
accessed December
rules of society, and in particular the quality of contract enforcement, property rights, 2009.
and the like, no country comes close to Malawi, with the exception of Tanzania.
In 2000, Malawi was one of the 189 countries that adopted the Millennium
Declaration of the United Nations, which set out the Millennium Development Goals
(MDGs) to be achieved by the year 2015. Table I.4 displays the current status of
Malawi’s accomplishment with respect to the indicators under these goals and the
likelihood of achieving each of the goals by the target year of 2015. The table
represents the assessment of the Government of Malawi and comes from an official
report – see Source under the table for details. In some areas, the Government judges
that the 2015 target will be met. These include eradicating extreme poverty and
hunger; reducing child mortality; and ensuring environmental sustainability.
In other areas, such as promoting gender equality and empowering women,
and achieving universal primary education, the assessment is more pessimistic.
Two points are worth noting. For one, “likely to be met” is here an overall assessment
with regard to a particular MDG; it is not to be taken to mean that every single indica-
tor under that MDG will reach the precise percentage specified for 2015. The other is
that a negative assessment (“unlikely to be met”) is not necessarily indicative of a bleak
future – or present. For example, a literacy rate of 82% among Malawians aged 15 to 24
is an impressive achievement for a society with as many challenges as Malawi,
even if the country is unlikely to achieve 100% literacy in that age bracket by 2015.
Malawi’s economy is essentially agricultural, with over 80% of the population
engaged in farming and related activities. Agricultural products account for most of
the country’s export revenue, led by tobacco. The mainly artisanal fishing industry
produces a significant part of the protein in the Malawian diet. Lake Malawi, which
accounts for nearly 20% of the country’s area (a small part of the lake belongs to
Mozambique), is the main source of the fish catch.3 Industries include food processing
and garment manufacturing. Tourism is limited, though growing. For further details,
see Chapter I.2. The economy below.
8Table I.4. Malawi’s progress towards the Millennium Development Goals
Goal/target Indicator Current 2015 Feasibility
status target of achieving
the goal
Eradicate Proportion of population livingb below USD 1/person/day 40 % 27% Likely
extreme Poverty gap ratioa 17.8% 0% to be met
poverty Poorest quintile share in national consumption 10.1 % 20%
and hunger Prevalence of underweight children 16 % 14%
Proportion of population below minimum level 15% 11.8%
of dietary energy consumption
Achieve Net enrollment in primary 79 % 100% Unlikely
universal Proportion of pupils starting grade 1 reaching grade 5 75.7 % 100% to be met
primary Literacy rate (15-24yrs) 82 % 100%
education
Promote Ratio of girls to boys in primary education 0.99 1 Unlikely
gender Ratio of girls to boys in secondary education 0.77 1 to be met
equality and Ratio of literate women to men 15 – 24 years old 0.94 1
empower Share of women in wage employment in non-agriculture sector 15 % 50%
women Proportion of seats held by women in parliament 22 % 50%
Reduce child Under-five mortality rate (per 1,000) 122 78 Likely
mortality Infant mortality rate (per 1,000) 69 44.7 to be met
Proportion of 1-year old children immunized against measles 84 % 100 %
Improve Maternal mortality ratio (per 100,000) 807 155 Unlikely
maternal health Proportion of births attended to by skilled health personnel 67 % 100% to be met
Combat HIV HIV prevalence among 15 – 24 year old pregnant women 12% 0% Likely
and AIDS, Ratio of orphans to non-orphans in school 0.14 -b to be met
malaria and Death rates associated with malaria 4% -
other diseases Access to malaria treatment 21% -
Proportion of households with at east one insecticide-treated net 37.8% -
Death rates associated with tuberculosis 9% -
Proportion of TB cases under direct observable treatment 83% 100%
Ensure Proportion of land covered by forest 36.2% 50% Likely
environmental Proportion of area protected to maintain biological diversity 0.16% 0.18% to be met
sustainability Proportion of population using solid fuel 98.7% 0%
Proportion of population with sustainable access 80% 74%
to an improved water source
Proportion of population with access to improved sanitation 94% 86.2%
Slum population as percentage of urban population 64.4% -
Develop global Net official development assistance as a percentage 21% - Likely
partnership for of realgross domestic product to be met
development Unemployment of 15 – 24 year olds (urban) 9.4% -
Fixed-line telephone subscribers (per 100 population) 0.82% -
Cellular subscribers (per100 population) 11.17% -
Internet users (per1 ,000 population) 0.70 -
Source: Adapted from: Government of Malawi, Ministry of Development Planning and Cooperation, 2009 Malawi Millennium
Development Goals Report, http://www.undp.org.mw/index.php?option=com_content&view=category&layout=blog&id=50&Itemid=13&58930ef
fcf1f629ed28c9ca6846cfdcd=6ce6ba0eb82ebbc3195efbb1548c203e, date accessed December 2009.
a The poverty gap ratio is the average distance separating the poor from the poverty line, expressed as a percentage of the poverty line.
In addition to counting the number of poor people, the poverty gap also indicates the extent of poverty.
b “-“ indicates that no target was set for the indicator.
9The region 4 The source for this
information is the
COMESA website:
http://www.comesa.int/.
Malawi is a member of two major trade agreements covering its region: the Common
5 See the SADC website:
Market for Eastern and Southern Africa (COMESA) and the Southern African http://www.sadc.int/.
Development Community (SADC). (COMESA reaches out well beyond south-eastern 6 The EAC is an
organization with a long,
Africa, to include North African countries like Egypt and Libya.) if interrupted, history.
Its founding members in
1967 were Kenya, Tanzania
The treaty establishing COMESA was signed on 5 November 1993 in Kampala, and Uganda. More
recently, it has welcomed
Uganda, and was ratified a year later in Lilongwe, Malawi, on 8 December 1994. The Burundi and Rwanda as
members. For further
19 COMESA member states are: Burundi, Comoros, Democratic Republic of Congo, information, see
http://www.eac.int/.
Djibouti, Egypt, Eritrea, Ethiopia, Kenya, Libya, Madagascar, Malawi, Mauritius,
7 Final Communiqué of the
Rwanda, Seychelles, Sudan, Swaziland, Uganda, Zambia and Zimbabwe. The total COMESA-EAC-SADC
Tripartite Summit of Heads
population of the COMESA countries was 430 million and the total exports and of State and Government,
held in Kampala, Uganda,
imports were each over USD 150 billion in 2008. A COMESA customs union was on 22 October 2008.
officially launched in June 2009. In addition, in May 2007, the Twelfth Summit of
COMESA Heads of State and Government adopted an Investment Agreement for the
COMESA Common Investment Area (CCIA), which includes provisions for national
treatment, the protection of investors against expropriation and nationalization,
and the settlement of disputes through negotiation and arbitration.4
SADC began in 1980 as a loose alliance of nine states in southern Africa, with a view
to reducing economic dependence on the then apartheid regime in South Africa.
Malawi was a founding member of the alliance that was formalized as SADC in 1992.
Today, the organization has 14 members - Angola, Botswana, Democratic Republic of
Congo, Lesotho, Madagascar, Malawi, Mauritius, Mozambique, Namibia, South Africa,
Swaziland, Tanzania, Zambia and Zimbabwe – with a population of over 230 million.
In August 2008, the Summit of SADC Heads of State and Government launched the
SADC Free Trade Area, which is expected to be followed by a Customs Union by 2010,
a Common Market by 2015, a Monetary Union by 2016 and a single currency by 2018.5
Finally, in October 2008, the Heads of State and Government of the member countries
of COMESA, SADC and the East African Community (EAC)6 held a summit meeting at
which they “approved the expeditious establishment of a Free Trade Area (FTA)
encompassing the member/partner States of the [three organizations] with the
ultimate goal of establishing a single Customs Union.”7
While these efforts to bring about greater economic integration have not always moved
at great speed, there has been steady progress, sometimes complicated by the multiple
memberships of a number of countries. Tariffs have seen a downward movement,
especially on the part of the more advanced economies such as South Africa, Botswana
and Mauritius. Although a number of tariff and non-tariff barriers remain in these
trading areas, there is a clear awareness among policy-makers that Africa’s small,
fragmented markets are a major obstacle to economic development and one that
needs to be overcome.
102. The economy 8 IMF Country Reports
No. 08/3, January
2008, and No.
08/265, July 2008.
The Malawian economy has seen an impressive upturn in recent years. Real GDP has grown
at a rate of around 8% in the past three years and growth is projected to continue at a 9 See Bafana,
September 2008,
slightly lower rate in 2010 (Table I.5). Inflation has also been reduced substantially. and Ramachandran,
December 2007.
Table I.5. Selected economic indicators, 2008-2010 10 The Malawi Growth
and Development
Strategy (MGDS): From
Descriptor Units 2008 2009a 2010a Poverty to Prosperity,
2006-2011, 2006,
http://siteresources.w
orldbank.org/MALAW
GDP, constant prices Annual % change 9.8 7.7 6.0 IEXTN/Resources/M
GDS_2006_Final.pdf.
Inflation, average consumer prices Annual % change 8.7 8.4 10.1
Current account balanceb % of GDP -6.4 -8.6 -1.8
Source: Adapted from the IMF, Malawi: Staff Report for 2009, Article IV Consultation, March 2010.
a Estimates and projections by IMF staff.
b Includes official transfers.
Several factors account for this cheering state of affairs. One is greatly improved
macro-economic management, as recognized by the IMF in several recent reports.8
Another is favorable weather. A third is a successful though controversial program of
fertilizer subsidies to farmers that has seen grain production double and turned Malawi
into a food exporter.9 The assistance received under the Heavily Indebted Poor Countries
(HIPC) initiative has also been crucial (see under Aid, debt, reserves, etc. below).
As Table I.6 indicates, agriculture accounts for almost exactly one-third of the
economy, with wholesale and retail trade following with about one-seventh.
The contribution of manufacturing to GDP has been increasing, however, as has that
of construction.
As Table I.6 shows, in 2008, agriculture was again the unsurprising driver of the economy’s
performance, growing by almost 12%, while mining and quarrying grew by 7%, manu-
facturing by 10%, construction by 8%, and information and communications by 47%!
The Malawi Growth and Development Strategy (MGDS): From Poverty to Prosperity,
2006-2011 lays out the Government’s framework for action on the economy, along
with other matters such as social protection and improving governance. The first of
the five “themes” of the MGDS is Sustainable Economic Growth. Broadly speaking,
the idea is to transform the country from “a predominantly consumption-based
economy to a predominantly production-based economy.”10 In order to achieve this,
the Government seeks to increase domestic and foreign private investment in
productive sectors, to promote exports by addressing supply-side constraints, and to
diversify the economy. Potential growth sectors are seen as including tourism, mining
and manufacturing. Improving the business climate and the transport infrastructure
are among the Government’s priorities.
11Since the passage of the Public Enterprises Act of 1996, the Government has also moved 11 The Privatisation
Commission’s website
on the privatization front. A Privatisation Commission was set up and a “Divestiture provides extensive
information on the
Sequence Plan” was announced in 1997. A large number of state-owned enterprises principles and proce-
(SOEs) have been privatized over the past 10 years – e.g., Blantyre Dairy (Pvt) Ltd., dures of privatization,
as well as past, current
Malawi Railways (Malawi) Limited (a 20-year concession), Malawi Telecommunications and planned transac-
Limited (MTL), and the National Bank of Malawi. The larger enterprises have tended to tions: http://www.pri-
vatisationmalawi.org/in
be acquired by foreign investors. Divestiture proceeds have thus far totaled MWK 5.7 dex.php?option=com_f
rontpage&Itemid=1.
billion. An Impact Assessment Study commissioned in 2006 and carried out by
PricewaterhouseCoopers, in association with the University of Malawi, concluded that the
privatization program had been a success, with the former SOEs improving their perform-
ance and the State securing higher tax revenues.11 Among the enterprises still in the
public sector are Air Malawi and the Electricity Supply Corporation of Malawi (ESCOM).
Table I.6. GDP by activity in constant (2005) prices:
Preliminary figures (MWKa million)
Item description 2006 2007 2008
A Agriculture, forestry and fishing 108,840 122,264 136,657
B Mining and quarrying 3,211 3,362 3,604
C Manufacturing 28,486 29,508 32,437
D+ E Electricity, gas and water supply 5,638 5,944 6,104
F Construction 15,950 17,425 18,833
G Wholesale and retail trade 51,248 53,616 57,674
H Transportation and storage 12,700 13,396 14,122
I Accommodation and food service activities 6,346 6,709 7,252
J Information and communication 9,104 9,676 14,202
K Financial and insurance activities 21,924 23,862 26,643
L Real estate activities 15,795 16,385 17,155
M+N Professional, scientific and technical 5,683 5,928 6,356
activities, administrative and support
service activities
O Public administration and defense 11,933 10,905 11,733
P Education 10,693 10,220 11,365
Q Human health and social work activities 13,330 13,315 14,489
R+S+T+U Other services 16,397 17,000 17,627
Sum of all industries 337,278 359,515 396,254
Less: Financial intermediation services (22,272) (24,042) (26,137)
indirectly measured (FISIM)
Plus: Taxes less subsidies on products 32,810 38,296 40,321
GDP in constant 2005 prices 347,817 373,768 410,438
GDP in current prices 396,244 459,664 548,738
Source: Ministry of Economic Planning and Development, 2009.
a The exchange rate of the Malawi kwacha had been stable at around MWK 140 to USD 1 for many years
but began changing slowly in 2009. In December 2010, it was MWK 151 to USD 1, http://www.un.org/depts/treasury/.
12Markets for investors 12 MIPA, Investor’s
Guide to Malawi, 2007.
13 Broadly speaking,
The domestic market in Malawi is small but growing, given the country’s sustained LDCs are not only
growth for a number of years. Access to the regional market is provided by COMESA poor but have little
economic diversification
and SADC (see under The region above), as well as by bilateral trade treaties with and very low levels of
skills. Most countries in
Mozambique, South Africa and Zimbabwe. Although no trade agreements currently sub-Saharan Africa are
exist with Tanzania and Zambia, Malawi has a Joint Permanent Commission of LDCs, although there
are a number of
Cooperation with these countries in various sectors including trade.12 In addition, exceptions in Malawi’s
as noted above, the EAC has entered into an agreement with COMESA and SADC to region: Botswana,
Kenya, South Africa
establish a tripartite free-trade area and move towards a customs union. and Zimbabwe.
Markets are also to be found abroad. Designated a “least developed country (LDC)” by
the United Nations,13 Malawi is eligible for preferential treatment under the European
Union’s “Everything But Arms” (EBA) initiative. It also qualifies under the Generalized
System of Preferences (GSP), which gives it preferential access not only to the EU but
to many other rich markets (e.g., Japan) as well. As far as the US market is concerned,
what is most relevant is the African Growth and Opportunity Act (AGOA). See Box I.1
on AGOA and EBA below.
13Box I.1. AGOA and EBA African Growth and Opportunity Act (AGOA) AGOA was signed into law on 18 May 2000. It is meant to encourage market forces in African countries by offering them the best access to the US market available outside of free-trade agreements. The Act covers some 6,400 items, including textiles and apparel. The AGOA Acceleration Act, signed into law on 12 July 2004 and known as AGOA III, extends this preferential access until 30 September 2015. Eligibility for AGOA benefits is determined annually on the basis of a review by a committee chaired by the United States Trade Representative (USTR). The criteria require that the country have established, or be making progress towards establishing, a market economy, the rule of law, policies to reduce poverty, and a system to combat corruption. Currently, 38 sub-Saharan countries qualify as eligible, including Malawi, which became AGOA eligible on 2 October 2000. AGOA eligibility is not the same as eligibility under the provisions applying to apparel (ready-made gar- ments), an item of special interest to a number of African countries, including Malawi. Malawi became apparel eligible on 15 August 2001. Apparel preference under AGOA is intended to apply mainly to gar- ments made of yarns and fabrics produced in the United States or in sub-Saharan African countries. Special allowance is made, however, for “lesser developed countries” like Malawi, which may use third- country yarns and fabrics until 2012, as garment exporters in Malawi are currently doing. This underlines the importance of developing an indigenous textile industry that can meet the quality standards of the US market. (For more on this, see Chapter II.2. Opportunities for investors below.) In 2006, apparel exports under AGOA were about USD 40 million.a Everything But Arms (EBA) initiative The EBA is one of five arrangements available under the Generalised System of Preferences (GSP) of the European Union, which grants trade preferences to all developing countries. It is the most favorable regime available under the GSP and is meant for least developed countries (see footnote 13 above), of which there are 49 in the world and 34 in sub-Saharan Africa. Roughly 2100 products already enter the EU market duty-free for all countries. Practically all other prod- ucts are covered by EBA and are granted duty-free access to the EU market if they fulfill the rules of ori- gin requirements (see below). The exclusions are arms and ammunition and, until mid-2009, rice and sugar. Duties on these products, except for arms and ammunition, were gradually reduced until duty-free access was granted for sugar (a matter of some consequence to Malawi) and rice as of October 2009. Preferences under the EBA apply to imports into the EU of products originating in least developed countries. While products wholly obtained in the exporting country are considered as originating there, products manufactured with inputs from other countries are so considered only if they have undergone sufficient working or processing in the exporting country. A guide on how to interpret and implement the rules of origin is available from the European Commission. a According to the OECD’s Country Note on Malawi in its African Economic Outlook 2008. Source: Based on information from the AGOA website (www.agoa.gov/index.html), the EBA website (http://ec.europa.eu/comm/trade/issues/global/gsp/eba/index_en.htm) and other sources. 14
Exports and imports

Malawi’s trade relations are chiefly with the member states of SADC (see The region
above) and, within SADC, above all with South Africa (Table I.7).

Table I.7. Major trading partners, 2006

        Import source             % of total        Export destination                % of total

          South Africa                48.5              South Africa                 18.0
          Mozambique                  16.9                  UK                       12.2
                  UK                   7.9               Germany                      7.6
              Zambia                   4.8                 USA                        7.0
             Tanzania                  4.6                 Egypt                      6.9

Source: MIPA, Investor’s Guide to Malawi, 2007.

Malawi’s exports are dominated by tobacco, which accounts for well over half the total
export value. Both production and prices tend to fluctuate, the former generally on
account of the weather. 2008 was an exceptionally good year for tobacco exports.
While production was on the low side, as shown by Table I.8 below, covering the past
10 years, the price jumped by nearly 60% over that of 2007. In 2009, production
rebounded to the highest volume in at least 15 years and the price dropped, but not
by much, so that export revenue was even higher than in 2008.

Table I.8. Malawi’s tobacco exports, 2000-2009

    Year           Total volume (kg)              Total revenue (USD)     Average price (USD/kg)

    2000                115,933,746                  264,654,467                     2.28
    2001                115,767,771                   236,711,743                    2.04
    2002               105,775,863                   214,636,388                     2.03
    2003                  91,127,586                 206,047,529                     2.26
    2004                 90,271,649                  225,910,746                     2.50
    2005                101,743,166                  233,017,334                     2.29
    2006               103,963,559                   245,694,375                     2.36
    2007                 121,725,138                  318,156,575                    2.61
    2008               105,428,190                   436,550,689                     4.14
    2009                122,196,335                  460,300,988                     3.77

Source: Adapted from information supplied by the Tobacco Control Commission, 2010.

                                                                                                   15
Other major exports are tea, sugar, soya beans, cotton and garments – see Table I.9
below. Although only one garment item appears in Table I.9, a number of others
appear further down the list. The garments are made mainly by foreign-owned
companies, with fabric imported from Asia, and exported to the United States under
the preferential treatment accorded to sub-Saharan African countries by AGOA – see
Box I.1 above. On garments as well as other exports, see further discussion in Chapter
II.2. Opportunities for investors below.
Table I.9. Top twenty exports by value, 2009 (in MWKa)
Description Value (FOB)
Other tobacco, not stemmed or stripped 37,985,488,705
Burley strip tobacco, not stemmed or stripped 29,011,935,961
Burley strip tobacco, partly or wholly stemmed or stripped 18,218,571,189
Virginia flue-cured leaf tobacco, partly or wholly stemmed or stripped 13,070,322,886
Black tea fermented or partly fermented, flavored or not, 10,686,869,342
in packages smaller than 3 kg
Raw cane sugar, in solid form 9,724,489,275
Burley leaf tobacco, not stemmed or stripped 3,765,949,503
Soya bean flour and meal 3,707,142,404
Cotton, not carded or combed 3,359,772,143
Turkish leaf tobacco, not stemmed or stripped 2,293,905,936
Kidney bean or white pea bean seeds other than for sowing 2,194,386,752
Other tobacco, partly or wholly stemmed or stripped 2,173,286,814
Tobacco refuse 2,026,547,103
Shelled groundnuts, not roasted or otherwise cooked 1,942,439,408
Virginia flue-cured leaf tobacco, not stemmed or stripped 1,386,600,906
Pea seeds other than for sowing 1,328,592,808
Husked brown rice 1,296,463,018
Uranium ores and concentrates 1,199,228,874
Sacks and bags of polymers of ethylene for packaging in industry 1,141,013,269
Men’s or boys’ garments of cotton 901,847,958
Source: Adapted from data provided by the National Statistical Office, http://www.nso.malawi.net, May 2010.
a At the end of 2009, the exchange rate was MWK 145 = USD 1, http://www.un.org/depts/treasury/.
16Imports are dominated by fuel and fertilizers – see Table I.10 below. According to 14 OECD, African
Economic Outlook 2009,
the OECD, Malawi had been doing well in recent years in the external sector, with http://www.africaneco
nomicoutlook.org/en/
substantial growth in exports in both 2007 and 2008, but faced some difficulties in countries/southern-
2009-2010 on account of “the current global economic downturn, which is likely to africa/malawi/#/macr
o_economic_policy,
affect Malawi’s growth through reduction in demand for its products as well as slump- date accessed
ing commodity prices.”14 However, if all goes as planned with the uranium-mining December 2009.
project mentioned below under Foreign direct investment – also see Box II.2 Investing
in uranium in Chapter II – it could be a big help with the trade balance.
Table I.10. Top twenty imports by value, 2009 (in MWKa)
Description Value (CIF)
Distillates and other fuel (diesel, oil, etc.) 15,398,441,990
Unused/new stamps, banknotes, checks, etc. 10,910,780,298
Other motor spirit (petroleum) 8,431,840,773
Mineral or chemical fertilizers with nitrogen, phosphorus and potassium 8,220,864,002
Urea 7,269,641,130
Medicaments for the treatment or prevention of bilharzia, malaria, etc. 6,775,713,154
Durum wheat 4,812,817,917
Spelt or common wheat and meslin 4,510,665,315
Cellular telephones 4,304,346,300
Cement clinkers 4,002,758,916
Machines for the reception, conversion and transmission 3,296,901,999
or regeneration of voice or image
Flat-rolled iron or steel of width not greater than 600 mm, 2,916,091,495
zinc-plated or coated (excluding electroplated)
Crude soya-bean oil 2,429,744,506
Medicaments other than those for the treatment or prevention 2,417,235,734
of bilharzia, malaria, etc.
Worn clothing and other worn articles 2,290,329,067
Double salts and mixtures of ammonium sulfate and ammonium nitrate 2,203,663,955
Maize (excluding seed) 2,104,197,111
Cartons, boxes or cases of corrugated paper or paperboard 2,031,898,857
Vehicles of a cylinder capacity exceeding 2500 cc but not exceeding 3000 cc 1,646,222,043
Insecticides, put up for retail sale 1,506,937,911
Source: Adapted from data provided by the National Statistical Office.
a At the end of 2009, the exchange rate was roughly MWK 145 = USD 1, http://www.un.org/depts/treasury/.
17Foreign direct investment 14 OECD, African
Economic Outlook 2009,
http://www.africaneco
nomicoutlook.org/en/
FDI is on the rise in Malawi, although from a low base. According to UNCTAD, from an countries/southern-
annual average of USD 15 million in the 1990s, FDI rose to USD 37 million in 2008.15 africa/malawi/#/macr
o_economic_policy,
FDI stock rose from USD 228 million in 1990 to USD 627 million in 2008. 2007 was an date accessed
exceptional year for FDI inflows - USD 55 million – but this was primarily a function of December 2009.
a large new investment by an Australian company, Paladin Energy Ltd., in a project to 15 United Nations
Conference on Trade
exploit uranium oxide from deposits in Kayelekera in the Northern Region. Most FDI and Development
in Malawi has gone into mining, followed by manufacturing. Lafarge Cement of France (UNCTAD), Country
fact sheet: Malawi,
is expected to invest USD 200 million in a new cement plant in the southern Malawi http://www.unctad.or
g/Templates/Page.asp
district of Balaka, which has large deposits of limestone. Among other well-known ?intItemID=3198&lang
foreign firms operating in Malawi are Bata Shoes (Switzerland), Barti Airtel (India), =1, 2010.
Illovo Sugar (now UK), Maersk (Denmark) and Standard Bank (South Africa). 16 World Bank, Press
Release No.
2007/65/AFR,
Attracting FDI remains a priority for the government, with MIPA being charged with September 2006.
the task. The Malawi Growth and Development Strategy (MGDS) mentioned above is 17 In 2007, the
very clear about making it a priority to increase domestic and foreign private invest- exchange rate was
around MWK 140 =
ment, address supply-side constraints, and improve the business climate and the USD 1,
http://www.un.org/D
transport infrastructure. epts/treasury/. So the
debt service obligation
would have been just
Aid, debt, reserves, etc. over USD 5 million.
In 2006, Malawi reached the completion point under the Heavily Indebted Poor
Countries (HIPC) initiative. The subsequent debt relief under the HIPC and the
Multilateral Debt Relief Initiative (MDRI) is expected to amount to the equivalent of
USD 3.1 billion (in total nominal debt relief) on principal as well as interest payments.16
As Table I.11 indicates, the debt service burden had fallen sharply by 2007.17 Over the
past two years, not surprisingly in view of the global financial and economic crisis,
external debt has risen somewhat once again and so has the debt service burden,
although the latter still remains at about one-fifth the level reached in 2004.
Table I.11. External debt, selected years, 1998-2009 (MWK million)
Year Multilateral Bilateral Commercial Total Interest Debt service
1998 89,687 19,058 3,363 112,109 970 3,101
2001 146,913 23,624 3,632 174,171 2,639 4,838
2004 319,457 28,381 575 348,414 3,159 9,678
2007 78,725 9,334 821 88,881 445 746
2008 87,619 10,261 322 98,201 973 1,784
2009 97,298 12,441 1,622 111,361 1,120 1,914
Source: Adapted from information supplied by the Reserve Bank of Malawi, http://www.rbm.mw.
18Nonetheless, Malawi’s need for external financing in the form of grants, loans and 18 IMF Country Report
No. 08/3, January
private transfers remains high. In January 2008, the IMF estimated it at over USD 700 2008. This is roughly
equivalent to the cur-
million for 2008.18 Aid accounts for just 40% of the government budget for 2008-2009 rent account deficit in
– about USD 634 million out of the budget total of USD 1.6 billion. Total gross 2006.
foreign-exchange reserves declined to USD 264.3 million in September 2008 from USD 19 Reserve Bank of
336.4 million in August 2008, representing 2.1 months of imports.19 The exchange rate Malawi, Monthly
Economic Review,
of the Malawi kwacha had been stable at around MWK 140 to USD 1 for a number of September 2008.
years but had moved up by December 2010 to MWK 151 to USD 1. The Reserve Bank
intervenes to ensure stability in a system known as the “managed float.”
GROWTH, STABILITY AND PROGRESS – THIS HAS BEEN
OUR OPERATING EXPERIENCE IN MALAWI. THE RETURN
ON INVESTMENT HAS BEEN CONSTANT AND THE BUSINESS
CLIMATE PEACEFUL. THE OPERATING ENVIRONMENT
HAS ITS OWN CHALLENGES, AS IN ANY MARKET,
BUT NONE THAT WE HAVEN’T BEEN ABLE TO OVERCOME.
FOR US, MALAWI IS A SOLID INVESTMENT BASE,
LOCATED CENTRALLY IN AFRICA, WITH AN EMERGING
MIDDLE CLASS THAT HAS GROWING SPENDING POWER
AND AN INCREASING DEMAND FOR IMPROVED GOODS
AND SERVICES.
Jean-Claude McMenamin, General Manager and shareholder, Blantyre Hotels Limited –
operating as Protea Hotel Ryalls
19SOUTH EAST AFRICA DRAINAGE MAP 20
II. INVESTING IN BLANTYRE

1. Introduction                                                                              20 National Statistical
                                                                                             Office, 2008 Population
                                                                                             and Housing Census:
                                                                                             Preliminary Report,
Blantyre lies 282 km southeast of the capital, Lilongwe. According to the June 2008          September 2008.
census, it has a population of 661,444, a little less than the 669,021 that the census
                                                                                             21 Ibid.
attributes to Lilongwe.20 Twelve years ago, in 1998, Blantyre was clearly the largest city
in the country, with 502,053 residents, as against Lilongwe’s population of 440,471.
Since then, growth rates seem to have diverged. At 2.8% per annum, Blantyre’s is the
slowest-growing city in the country, while Lilongwe, Mzuzu and Zomba are growing
at 4.3%, 4% and 2.9% respectively.21

The city was founded in 1876 as a Church of Scotland mission station and was named
after David Livingstone’s Scottish birthplace. In 1895, it became Malawi’s first munici-
pality. In 1956, it was amalgamated with the town of Limbe, 11 km away. Blantyre
covers nearly 228 sq. km of hilly ground and has a relatively mild tropical climate,
with average temperatures of 17°C to 27°C in November and 12°C to 22°C in July.
The annual rainfall is 1,127 mm.

Blantyre is the capital of the Blantyre District as well as of the Southern Region.
The administrative significance of the city is overshadowed by its economic signifi-
cance, for Blantyre remains, as it has always been, the commercial capital of Malawi.
It is home to the Malawi Stock Exchange, the Malawi Confederation of Chambers of
Commerce and Industry, Malawi Railways, the Malawi Broadcasting Corporation,
the College of Medicine of the University of Malawi, and the Supreme Court, among
other institutions. The annual tobacco auction (tobacco being Malawi’s leading export
commodity) is also held in Blantyre.

Wholesale and retail trade dominates Blantyre’s economic life. But the city and its
outskirts also house much industrial activity, in agro-processing, textiles and garments,
cement, pharmaceuticals, and construction, among other areas. The city is well-con-
nected by road, rail and air with other parts of Malawi and with neighboring countries.
In comparison with much of Malawi, Blantyre also has good infrastructure. Electricity
coverage, for example, extends all over the city and most residents have access to
running water. However, the infrastructure also has its shortcomings, in maintenance,
reliability and cost.

Politically, Blantyre is governed by the City Assembly. Although the city is supposed to
have elected councilors, it is currently operating without them. Assembly elections are,
however, scheduled for April 2011. The Assembly’s main source of income is property
taxes, which need to be approved by the government in Lilongwe. The Assembly is not
in a position to offer any special incentives to foreign investors. All FDI applications
are processed by MIPA, which has an office in the city.

For a selection of foreign investors currently in the city, see Chapter IV.2. below.

                                                                                                           21
The main advantages of investing in Blantyre may be summarized as follows: 22 See Chapter I under
The region and
Markets for investors
for details.
• A business-friendly environment.
• A pleasant African highland climate. 23 This section draws
primarily on Nakagawa,
• A location well-connected to other parts of Malawi and et al., Foreign Direct
the neighboring region by road, rail and air. Investment in Blantyre:
Opportunities and
• A low-cost English-speaking workforce. Challenges, April 2009;
MIPA, Investor’s Guide
• Access to regional and overseas markets through COMESA, to Malawi, 2007; KPMG
SADC, EBA and AGOA.22 International, Blantyre,
Malawi: Potential oppor-
tunities for investors,
October 2009;
2. Opportunities for investors 23 World Bank, Malawi:
Diagnostic Trade
Integration Study, Volume
Opportunities for investment in Blantyre and the surrounding districts are mainly to 1 (Final), February
be found in agriculture (cotton, cassava, chilies, groundnuts, pigeon peas, tea) and 2004; and World Bank,
Malawi: Diagnostic
agro-processing (cotton textiles and various processing activities involving the other Trade Integration Study,
Volume 2 (Final draft),
agricultural products just listed). There are opportunities in other areas as well, which December 2002.
include tourism and mining. The main opportunities are described in the first part
24 As the World Bank
of the present section. The others are described more briefly in the second part. It is report of 2004 (previ-
ous footnote) put it,
important to note that any specific opportunities described below are meant to be the “massive move-
illustrative. These are by no means the only opportunities in these areas in Blantyre. ment of smallholder
farmers into burley
tobacco production in
Main areas of interest to potential investors the mid-to-late 1990s,
… resulted in perhaps
the most significant
and broadly dispersed
As noted in Chapter I, agriculture is the mainstay of the Malawian economy, flow of cash income
employing more than 80% of the workforce. Although its contribution to GDP has into rural Malawi in its
entire history.”
been declining, the sector still accounts for one-third of it. In colonial times and
even later during Dr. Banda’s regime, agriculture was a two-track activity. The large
commercial farms called “estates” focused on cash crops, most notably tobacco, while
the millions of smallholders cultivating a plot of 1-2 hectares concentrated on growing
food crops, primarily maize and cassava. Policy liberalization in the mid-1990s led to
the spread of the cash crops to smallholders, who now produce about half of Malawi’s
agricultural exports, which are still dominated by tobacco.24
In 2006, tobacco accounted for 61% of exports, followed by tea (7%), sugar (6%) and
cotton (2%). If cotton is combined with garments, the total rivals that for tea (7%).
Other agricultural exports in 2006 were groundnuts, other nuts, maize, dried
leguminous vegetables (including pigeon peas) and peppers (chilies) – all at about 1%
each. For the most part, Malawi agriculture is dependent on a four-month rainy season,
with only 57,000 hectares (2% of the cultivated area) being under formal irrigation.
22You can also read