Gunnison Valley Housing Market Update - May 2021 - Gunnison Valley Regional ...
←
→
Page content transcription
If your browser does not render page correctly, please read the page content below
Gunnison Valley
Housing Market Update
                                       May 2021

                        Prepared by: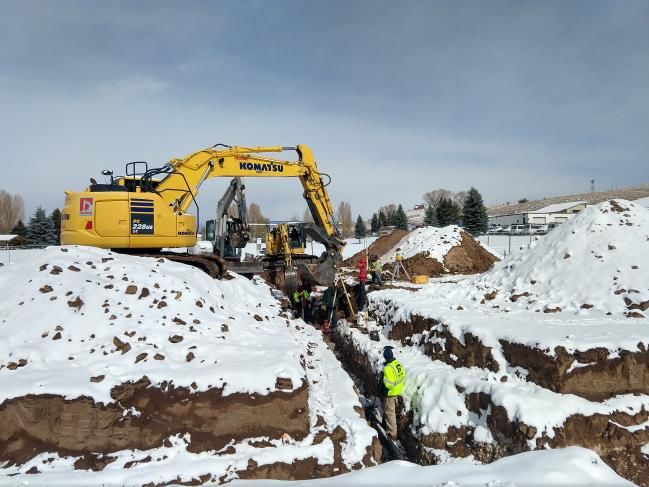
Contents
Introduction .................................................................................................................................................. 1
   Purpose ..................................................................................................................................................... 1
   Study Area Defined ................................................................................................................................... 1
   What is Affordable Housing in the Gunnison Valley ................................................................................. 2
Key Findings .................................................................................................................................................. 3
   Employers are struggling to find employees, and employees are struggling to find housing .................. 3
   COVID-19 Pandemic has added momentum to trends that were already in place .................................. 3
   The gap between housing needs and market prices has worsened ......................................................... 3
   The number of housing units needed remains high ................................................................................. 5
   Community needs increased momentum for local housing solutions ..................................................... 6
2020-2021 Impacts on Housing .................................................................................................................... 7
   Traffic and Commuting ............................................................................................................................. 7
   Water Usage.............................................................................................................................................. 8
Economic Conditions .................................................................................................................................... 9
   Labor Market............................................................................................................................................. 9
   Employer Perceptions of the Housing Problem ...................................................................................... 12
   Employer Assistance for Housing ............................................................................................................ 12
   Sales Tax Revenue ................................................................................................................................... 13
For Sale Housing Market ............................................................................................................................. 16
   Trends Since 2016 ................................................................................................................................... 16
   Homes Prices in 2020 .............................................................................................................................. 17
   Availability ............................................................................................................................................... 18
   Affordability ............................................................................................................................................ 19
   New Deed Restricted Inventory .............................................................................................................. 19
   Buyer Characteristics .............................................................................................................................. 20
   Housing Preferences and Price Targets .................................................................................................. 21
   Land ......................................................................................................................................................... 22
   Predictions for the Future ....................................................................................................................... 22
The Rental Market ...................................................................................................................................... 23
   Changes in the Supply of Rental Units .................................................................................................... 23
   Availability ............................................................................................................................................... 25
   Rents ....................................................................................................................................................... 25
Appendix A - Acknowledgements ............................................................................................................... 28
Appendix B - Median Family Income for Gunnison County (2021) ............................................................ 29

Williford/Rees/Continuum
Introduction
Purpose
The purpose of this 2021 Gunnison Valley Housing Market Update is to support local
jurisdictions, non-profits, and private sector developers in evaluating the community housing
potential on several opportunity sites in the valley. This report provides an update on the
economy and housing market relative to the 2016 Gunnison Valley Housing Needs Assessment
(2016 assessment). It identifies where current gaps exist in the housing market in terms of the
price of homes (own and rent) relative to what households can afford.
This is an interim update. When 2020 Census data is released, additional analysis of the valley’s
demographics and housing inventory will be completed relative to 2016.

Study Area Defined
The 2016 assessment identified three market areas. The consultant team received feedback
that the three areas was overly complex, and that the market distinction is better defined as
North and South valley. This update examines the housing market in two those two geographic
areas.

                   Gunnison Valley Housing Needs             2021 Gunnison Valley Housing
                             Assessment                              Market Update
 North valley   Included the towns of Crested Butte      Includes the towns of Crested Butte
                and Mount Crested Butte, and the         and Mount Crested Butte, as well as
                unincorporated subdivisions as far       Crested Butte South and
                south as, but not including, Crested     unincorporated subdivisions south to,
                Butte South                              but not including, Almont.

 Mid-valley     Included Crested Butte South, Almont     N/a
                and the area in between and the
                Taylor River area
 South valley   Included the area in and around the      Includes Almont, the Taylor River
                City of Gunnison and Ohio Creek          area, and the area in and around the
                                                         City of Gunnison and Ohio Creek.

Williford/Rees/Continuum
                                                                                                  1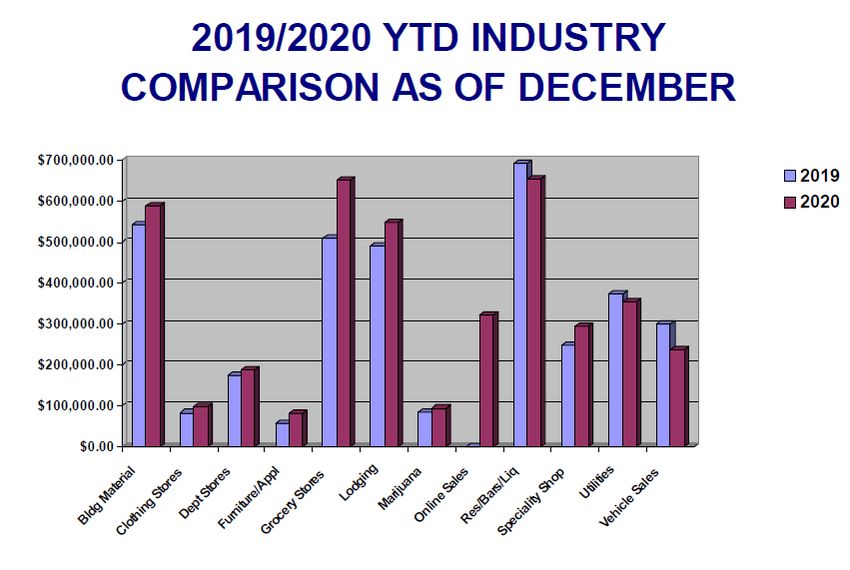
Source: ESRI, Consultant Team

What is Affordable Housing in the Gunnison Valley
Consistent with the 2016 assessment, this update requires an understanding of housing
affordability, which is a function of housing costs and household income.
         Housing is generally considered to be affordable (or attainable) when the monthly
         payment (rent or mortgage) is equal to no more than 30% of a household’s gross
         income. Although there is some variation, this standard is commonly applied by federal
         and state housing programs, local housing initiatives, mortgage lenders and rental
         leasing agents.
Incomes are typically expressed as a percentage of the median, which is abbreviated as AMI
(Area Median Income). The following table provides the incomes for each AMI category with
the corresponding affordable price for housing.
Maximum Affordable Rents and Purchase Prices by AMI (2-person household), Gunnison County, 2021

                                AMI %           50%          80%          100%          120%         200%
   Max. Household Income                   $31,650       $50,650       $63,300      $75,960      $126,600
   Max. Affordable Rent                      $791         $1,266        $1,582       $1,899        $3,165
   Max Affordable Purchase Price*         $107,217      $199,015      $260,948     $303,346      $551,270
    *Assumes 30-year fixed rate mortgage at 5.39% interest and 10% down. Assumes a monthly payment covering
    taxes, insurance and HOA fees of $250 if AMI is less than/equal to 100%, and $350 if greater than 100% AMI.

Williford/Rees/Continuum
                                                                                                             2
Key Findings
Employers are struggling to find employees, and employees are struggling to find
housing
Employers currently have heightened concern about attracting and retaining qualified
employees compared to 2016, and a growing awareness of the strong correlation between
housing problems and unfilled jobs.
• In 2016, 69% of employers felt housing attainably priced for their employees was “the
most critical” or “one of the more serious” factors affecting the economy. In 2021, this
rose to 90% of employers.
• Employers have increased many of the ways in which they are assisting employees with
housing, including providing higher wages compared to other areas, master leasing
units, and providing assistance with relocation.
All indicators point to a worsening labor shortage with “Continue to prioritize time/spending
valley employers facing the prospect of an increasingly on finding solutions to the housing
difficult time finding employees. The lack of housing that crisis.”
local employees can afford will be an ongoing barrier in -April 2021 business survey response
this regard.
COVID-19 Pandemic has added momentum to trends that were already in place
Housing was scarce before the pandemic, and has become more so now. A desire to live in an
amenity rich location and the ability or requirement to work remotely has driven increased
investment in real estate from households with assets and income from outside the Gunnison
valley. The strong reputation of the local school district and commitment to in-person learning
drew additional families with school age children to the valley for full time residency.
The economy was strong, and labor shortages were persistent leading up to the pandemic. For
most sectors, the economy has rebounded quickly as the valley worked to manage the
pandemic, but labor shortages have once again returned.
National trends related to home improvements, supply chain issues, and labor shortages are
adding further fuel to the local escalation of construction costs that has been an ongoing trend
for almost a decade. The gap between the cost of construction and price points attainable to
locals is increasing. Private sector developers struggle to increase supply with rising
construction costs for both materials and labor, necessitating outside subsidies and/or
participation from local jurisdictions to make attainable housing feasible.
The gap between housing needs and market prices has worsened
In the North valley, there are only 10 listings available for households below 200% of AMI,
representing 22% of for sale inventory. These listings are all for condos, half of which are
Williford/Rees/Continuum
3studios with incomplete kitchens. In 2016, there were more choices for households below 200%
AMI with 62 listings (about 35% of total inventory).
In the South valley there are only four listings for households below 200% AMI, about 18% of all
listings. These listings include two condos, a townhouse, and a single-family home built in 1960.
In 2016, about half of South valley listings were affordable to households below 200% AMI.
Gap in For Sale Housing – April 2021
Ownership
(2-person North Valley South Valley
household)
Area Median Max Owner Household # Units Owner Household # Units
Income Affordable Distribution for Sale Distribution for Sale
Price
$551,270 39% 35 16% 18
Total 1,538 45 2,723 22
Source: CHFA, Ribbon Demographics, LLC, Consultant Team
The picture is equally grim for renters. Nearly half of households that rent in the North valley
have incomes below 80% AMI, yet there were only three apartments listed with rental rates
that would be affordable for them between January and March this year. In the South valley,
70% of renter households have incomes below 80% AMI and only six units were affordable to
these households over the same three-month period.
Gap in Rental Housing – Listing January 2021 through March 2021
Rent
(2-person North Valley South Valley
household)
Area Median Max Affordable Household # Units Household # Units for
Income Price Distribution for Rent Distribution Rent
$3,165 7% 2 7% 0
Total 916 21 2,070 15
Source: CHFA, Ribbon Demographics, LLC, Consultant Team
Williford/Rees/Continuum
4Other indicators also demonstrate the worsening market situation for local buyers and renters.
• For sale housing inventory is more constrained than experts can remember. In 2016,
there were 256 listings at the time of the assessment. This year, there were 67.
• Median sale price and price per square foot are up dramatically since 2016.
• Rental vacancy was below 1% in 2016 and remains so in 2021. The number of rental
listings continues to be extremely low. In 2016 there were 35 rental listings over a three-
month period, compared to 36 for this update.
• Rental rates for all unit sizes have increased across the valley.
There is limited new supply of housing, and with construction prices continuing to climb, no
stabilization of inventory or prices is anticipated in the near future.
The number of housing units needed remains high
The 2016 assessment identified a need of approximately 960 housing units by 2020 inclusive of
homes that the free market will provide and units that require subsidies, incentives and/or are
mandates to build. Since 2016, there has been a great deal of time, money, and dedication
toward building deed restricted units, yet at the same time, increasing prices, construction
costs, and amenity migration have put additional pressure on housing for the local workforce.
These dynamics result in a total estimate of new homes needed by 2026 similar to the prior
report - just under 1,000.
About 490 units are still needed to ensure a functional rental market, balanced supply of for
sale homes, and to provide housing for employees filling unfilled jobs.
Projecting housing need as the economy rebounds from COVID is challenging, yet it is
estimated that at least an additional 470 units are needed to keep up with job growth through
2026.
This table shows the projected need, based on the current percentage of owners and renters in
the valley. Policy makers may decide to put more emphasis on ownership or rental units,
depending on resources and goals. For example, additional rental units could help attract new
working households to the area; investment in homeownership could help current employees
decide to put down roots and form families in the valley.
Units Needed by 2026
Catch Up Keep Up Total
Total 490 470 960
Own 300 290 590
Rent 190 180 370
Sources: Colorado Demography Office, 2015-2019 ACS, consultant team
Williford/Rees/Continuum
5Community needs increased momentum for local housing solutions
Since 2016, Gunnison County, Mt. CB, Town of Crested Butte, City of Gunnison and GVRHA have
stepped up their efforts and grown their capacity related to addressing local housing needs.
Each jurisdiction has participated in one or more public private partnership that has produced
dedicated housing for local employees and residents.
In 2016, 443 homes in the Gunnison valley were restricted for occupancy by local residents
through some type of income, employment and/or residency regulations. That equated to
slightly less than 5% of all housing in the valley and just over 7% of all occupied housing units.
Local efforts have produced 240 restricted units since that time, greatly surpassing historic
rates of production. Progress in the South valley is particularly noteworthy, with deed restricted
inventory doubling in five years. How deed restricted inventory compares to overall housing
inventory and occupied units will be updated when Census data is released.
Summary of Restricted Affordable Housing
Gunnison Valley North Valley South Valley
Restricted Units (as of 2016) 443 316 127
Restricted Units Added (2016 240 84 156
to 2021)
Total 683 400 283
Source: GVRHA, local planning staff, consultant team
Note: Restricted units – 2021 includes projects with anticipated certificate of occupancy in 2021 including Homestead,
Paintbrush, Garden Walk and Lazy K.
The community should continue to grow and build upon this momentum. More staff expertise,
capacity, and funding are needed to serve more households struggling with housing, to
implement housing development opportunities, and to maintain program integrity for existing
housing resources. There are numerous opportunity sites for additional deed restricted
housing, and new resources available at the state and local level to support the work. Increased
regional coordination of funding, development opportunities, and staff resources could also
help to streamline efforts and increase measurable outcomes.
Williford/Rees/Continuum
62020-2021 Impacts on Housing
This section focuses on housing-related impacts in the Gunnison valley fueled by the pandemic.
Sharp increasing rents and home prices combined with housing availability at an all-time low
are not the only housing-related changes in the valley. Commuting, the ability to hire
employees to fill jobs, employer perceptions about the availability of housing for the workforce
are examined in this section of the report. Later this year, this section will be supplemented
with key findings from a six-county study, Mountain Migration – Are COVID Impacts on Housing
and Services Here to Stay?
Traffic and Commuting
Traffic on Highway 135 between Gunnison and Crested Butte illustrates the timing and extent
of changes in the Gunnison valley. The year 2020 started off as expected, with January and
February showing the same pattern as a typical year, but with slightly higher traffic volume
than in 2019. In March 2020, traffic dropped off sharply as the shutdown closed most
businesses and residents largely stayed at home.
By May 2020, restrictions relaxed and traffic increased through July in about the same pattern
as 2019. Although local officials remarked on the increase in cars in Crested Butte from visitor
traffic, the actual number of cars on the highway was lower than the year before. This was
likely because visitors who traveled by car stayed longer in the area but there were fewer trips
up and down the highway from visitors coming and going.
By September 2020, Highway 135 traffic surpassed 2019 levels reflecting a larger number of
cars in the valley.
Gunnison to Crested Butte Traffic Counts on Highway 135
9,000
8,000
7,000
6,000
5,000
4,000
3,000
2,000
1,000
0
Jan Feb Mar April May June July Aug Sept Oct Nov Dec
2019 2020
Source: Colorado Department of Transportation
Williford/Rees/Continuum
7Commuting up and down valley for work dropped off sharply when businesses closed and/or
employees worked from home, but as employees returned to work on site, commuting
returned. Comparing 2016 to 2020 employer survey data suggests that the dominant
commuting pattern has not changed – many down valley residents still commute north up
valley for work.
Based on April 2021 responses to Gunnison County’s monthly business survey question asking
where employees live and where they work, almost all (93%) employees that work down valley
(Gunnison, Almont) also live down valley, a figure that is higher than in 2016 (82%). In contrast,
only 66% of employees that work up valley (Crested Butte, Mount Crested Butte, or Crested
Butte South) also live up valley, consistent with 2016 (66%).
Water Usage
Water data provides insight into the extent to which residential units were occupied more in
2020. Water usage for the months of October, November and December in 2019 and 2020 was
compared, when tourism is generally low and outside irrigation is not taking place.
In Crested Butte and Mount Crested Butte, total water usage was up 16% to 17%.
Water Usage, Q4 2019 vs. 2020
Oct - Dec Oct - Dec %
2019 2020 Increase
Crested Butte 17%
12,198,319 14,308,520
Mount Crested Butte 16%
12,415,019 14,356,020
Source: consultant team interviews
Residential water use increased by the most. In Crested Butte, commercial water use was up
only 3.3% whereas residential use was up over 26%. This suggests an increase in residential
occupancy of 26%.
Water Usage (Gallons) in Crested Butte, 2019 vs. 2020
Crested Butte 2019 2020 Change
Commercial 4,740,200 4,898,600 3.34%
Residential 7,456,100 9,407,900 26.18%
Total 12,198,319 14,308,520 17.30%
Source: consultant team interviews
The details of the pattern are not well understood but the bottom line is clear – more people
spent time in the Gunnison valley in 2020 than before. They generated less traffic on Hwy 135
about half the time, they used the bus less, but they used more water, the equivalent of the
water required to fill more than three Olympic swimming pools.
Williford/Rees/Continuum
8Economic Conditions
Labor Market
When the 2016 assessment was released, the valley’s economy was growing quickly.
Unemployment was extremely low at 1.9% and jobs were projected to grow at a rate of 2% per
year on average through 2020. County job growth ended up being even higher at 2.6% per year
on average according to the Colorado Demography Office. Valley employers struggled with
labor shortages in 2019 into early 2020.
The economy remained strong in the first few months of 2020 and then the novel coronavirus
(COVID-19) outbreak was declared a global pandemic on March 11, 2020. The public health
crises resulted in stay-at-home orders and business shutdowns in the first quarter of 2021. This
had a significant and negative initial impact on the local economy.
The initial and dramatic downturn was short lived, however, and Gunnison County experienced
a fairly rapid “V” shaped recovery. Although some businesses remain mostly closed and the
unemployment rate is higher than prior to the shutdowns, employers again face labor
shortages exacerbated by the lack of housing that the valley’s workforce can afford.
Unemployment
The COVID-driven shutdowns resulted in an extraordinary spike and subsequent drop in the
county’s unemployment rate as seen on the Gunnison Valley Economic Recovery Dashboard
and in the figure below.
Williford/Rees/Continuum
9Unemployment Rate of Colorado Mountain Communities
26%
24%
22%
20%
18%
16%
14%
12%
10%
8%
6%
4%
2%
0%
Gunnison Eagle Grand La Plata Pitkin Routt Summit Colorado
Source: Gunnison Valley Economic Recovery Dashboard
The unemployment rate in Gunnison County was a low 2.2% in February 2020 prior to the
arrival of COVID-19, a rate lower than that of the state, on par with Eagle and Grand counties,
and slightly higher than in Summit County. Although Gunnison County’s unemployment rate
jumped to 16% in April 2020 following an early closure of the ski area in March, the county
fared well relative to other Colorado mountain counties through 2020. During the second half
of 2020, Gunnison County’s unemployment rate was lower than the state and other mountain
counties in Colorado. The unemployment rate in March 2021, the most recent data available,
was 4.7%, which is one percentage point higher than in March 2020 and about 2.5 percentage
points higher than in March 2019.
As vaccination rates continue to climb through the spring and into the summer of 2021, the
remaining businesses that are mostly closed (see “Business Status” on the County’s Dashboard)
will continue to reopen and the county’s unemployment rate is anticipated to continue to
slowly fall. And although the current unemployment rate is higher than in 2019, the rate is
somewhat misleading as employers are already facing challenges hiring.
Williford/Rees/Continuum
10Employment
Employment data tells the same story of a temporary decline and rapid rebound. In 2019 and
early 2020, the valley’s economy was at full employment. As the shutdowns rippled through the
economy, the number of jobs in the county by April 2020 was 20% lower than a year prior and
26% lower than the month prior. This decline was much more dramatic and a little earlier than
the typical seasonal fluctuation as the ski season winds down.
Yet, a “V” shaped recovery got underway very quickly as people figured out how to work from
home and businesses reopened with distancing and other public health restrictions in place. By
September 2020, the number of jobs in the county had climbed back to just below 2018 figures,
as seen below.
Gunnison County Salary/Wage Jobs, 2016 to 2020
10,000
9,500
9,000
8,500
8,000
7,500
7,000
6,500
6,000
Jan Feb Mar Apr May Jun Jul Aug Sep Oct Nov Dec
2016 2017 2018 2019 2020
Source: BLS QCEW
Jobs data lags real time, but feedback from Gunnison County’s business survey, which has been
ongoing monthly since the summer of 2020, indicates that the labor market is nearing full
recovery. Based on survey responses, the total number of actual full-time equivalent (FTE) staff
in the previous month relative to typical ranged from 73% to 89% from July through November
2020 before falling to a low of 67% in December 2020. Survey respondents indicated that by
February 2021 their staffing matched what was typical.
Williford/Rees/Continuum
11Ability to Hire Once Again a Challenge
Labor shortages are once again a challenge, one that is likely to get worse. In April 2021, half of
business survey respondents indicated that they have unfilled jobs, and 46% indicated that
their ability to recruit and retain qualified employees
“Housing is a critical impediment to has declined or gotten harder.
recruitment and retention of qualified
employees.”
The local construction industry, for example, has a long
project backlog but finding workers is difficult, despite
-April 2021 business survey response some contractors offering bonuses. All indicators point
to a worsening labor shortage with valley employers
facing the prospect of an increasingly difficult time finding employees. It appears that the labor
shortage may only be overcome if and when new employees move to the valley, although the
lack of housing that local wages can support will be an ongoing barrier for anyone moving to
the valley without a location neutral job.
Employer Perceptions of the Housing Problem
Nearly 90% of employers who completed the Gunnison County Business Survey in April 2021
indicated that the availability of housing that is affordable to their workforce is either one of
the more serious problems in the valley or the most critical problem in the region. Even though
the sample size of the April 2021 survey was rather small, this does indicate a major change
compared to 69% who rated housing a serious or the most critical problem in 2016. In 2016,
only 9% of employers considered housing for the workforce to be the most critical problem in
the county. Of employers surveyed in April 2021, 45% considered it the most critical problem.
Extent to Which Workforce Housing is a Problem
The most critical problem in the region 45%
One of the more serious problems 43%
A moderate problem 10%
Not a problem 2%
0% 5% 10% 15% 20% 25% 30% 35% 40% 45% 50%
Source: Gunnison County Business Survey, April 2021
Employer Assistance for Housing
And when asked what kinds of assistance and resources would be most helpful to their
business, 23% of respondents indicated that housing affordable for their employees would be
Williford/Rees/Continuum
12most helpful, with a few referencing the need for “upper valley housing.” Survey respondents
also indicated that they provide a variety of housing-related assistance to their employees as
seen in the figure below, which represents the percentage of total respondents providing each
type of assistance, with some providing more than one type.
Housing-Related Assistance Provided by Employers
Pay higher wages than nearby or similar communities for
44%
the same/similar jobs
Own units/rooms rented to or occupied by employees 19%
Assist employees with housing search 12%
Hiring bonus/additional salary stipend 8%
Master lease units that are then rented to employees 6%
Temporary/relocation housing 4%
Other - bonuses 4%
Down payment/mortgage assistance 2%
0% 5% 10% 15% 20% 25% 30% 35% 40% 45% 50%
*the percentages shown for each type of assistance is relative to total respondents
Source: Gunnison County Business Survey, April 2021
For example, 44% of respondents indicated that they pay higher wages than nearby or similar
communities, 19% own units or rooms for their employees, and 12% assist employees with
their housing search. The percentage of respondents that master lease units, provide
temporary or relocation assistance, or down payment or mortgage assistance was 6% or lower
for each.
Sales Tax Revenue
The rapid and dramatic decline in sales tax revenue in every jurisdiction in the county with the
arrival of COVID-19 and subsequent public health shutdowns in March 2020 was followed by a
rapid increase and higher sales tax revenue county wide than in 2019. At year end, 2020 total
annual sales tax revenue exceeded that of 2019, except in Mount Crested Butte. In Gunnison
County, total sales tax receipts were up 9.4% in 2020 compared to the previous year.
Following the initial decline in the spring of 2020, sales tax revenue bounced back very quickly
everywhere except Mount Crested Butte as part time residents stayed in the valley to ride out
Williford/Rees/Continuum
13the pandemic, COVID refugees and location-independent workers arrived, and Front Range
visitation kept the local economy moving despite the pandemic. Gunnison County’s monthly tax
revenues exceeded those of 2019 starting in May 2020, as seen in the figure below.
Sales Tax Revenue, Year-over-Year Change
Source: Gunnison Valley Economic Recovery Dashboard, downloaded April 15, 2021
Gunnison saw monthly tax revenues exceed those of the same month in 2019 by June 2020,
followed by Crested Butte in August 2020. Mount Crested Butte saw 2020 monthly tax
revenues exceed those of 2019 in September, but tax collections relative to the previous year
began a downward trajectory as the winter season got underway. In all other jurisdictions, tax
collections in the first two months of 2021 exceeded the same month in 2020, which was prior
to the arrival of COVID.
Sales Tax Revenue, 2019 to 2020
Annual % Change (2019-2020)
Gunnison County 9.4%
Mount Crested Butte (17.3%)
Crested Butte 0.7%
Gunnison 2.5%
Source: Gunnison Valley Economic Recovery Dashboard, consultant team
Most sectors of the economy had higher sales tax revenue in 2020 than in 2019. As seen in the
figure below, only food and beverage (Res/Bars/Liq), utilities, and vehicle sales experienced a
Williford/Rees/Continuum
14decline. The decline in food and beverage benefited grocery stores that had a much better 2020
than 2019. Online sales in 2020 were, unsurprisingly, exponentially higher than in 2019.
2019/2020 Year-to-Date Industry Comparison as of December 2020
Source: Gunnison County
Williford/Rees/Continuum
15For Sale Housing Market
The section updates information since 2016 on the price of homes for sale units, current
availability, and affordability for local income earners. This information was gleaned from
realtor interviews and analysis of MLS data for homes sold in 2020 and listed in April 2021.
Trends Since 2016
Realtors in both ends of the valley describe the housing market as competitive, fast paced,
short on inventory, escalating prices, cash sales – “a frenzy.” While COVID stalled listings and
sales in spring 2020, the market quickly rebounded when summer arrived with strong demand
fueled by the ability to work remotely, the desire to live the mountain lifestyle, and the
motivation to get out of urban areas.
The 2016 assessment found that home prices had increased since the Great Recession yet not
recovered fully to pre-recession levels. Single family home prices were within 16% of their
former peak in both ends of the valley; however, condominiums and townhome prices were
slower to rebound, equaling about 30% to 60% of their pre-recession prices. Land prices too
remained lower, around 50% of their historic high.
Since 2016, home prices have continued to rise. The overall median price increased 70% in
Gunnison between 2016 and 2020. Mount Crested Butte topped the list in gains with the
median price of residential units sold more than doubling. In the past five years, price increases
were slightly higher in the North valley than the South valley.
In 2020, homes sales continued to drive prices upward. The number of homes sold in Gunnison
County increased by nearly 45% in 2020 over the previous year. Crested Butte had the highest
jump – a 38% overall increase in the median price in a single year
Rates of Change in Home Prices
Change 2016-20 Change 2019-20 2020 Median Price
Mount Crested Butte 115% 1% $500,000
Crested Butte 58% 38% $1,050,000
Crested Butte Rural 61% 24% $1,250,000
CB South 30% 10% $602,500
Almont* -2% -11% $516,800
Gunnison 57% 7% $345,000
Gunnison Rural 54% 10% $440,000
Source: Colorado Real Estate Network *Note: The decrease in price shown for Almont was due to the small number of sales and
does not reflect market realities.
Prices continued to rise sharply in the first quarter 2021. Single family homes sold in March
2021 had an overall median price 60% higher than in March 2020 county wide.
The number of sales each year since 2016 remained somewhat steady until 2020 when it
increased 42% over the previous year. The number of new listings, however, dropped in 2019
Williford/Rees/Continuum
16and stayed relatively low in 2020. Inventory was absorbed and prices increased creating a very
tight housing market leading into 2021.
Gunnison County Home Sales, 2016 to 2020
700
600
500
400
300
200
100
0
2016 2017 2018 2019 2020
Source: Colorado Real Estate Network Note: Figures are countywide and include sales outside of the Gunnison Valley.
Homes Prices in 2020
In 2020, residential sales totaled 326 units, or about 27 sales per month, excluding condotels
and timeshares. More than half were condominiums. The overall median price reached nearly
$800,000 with a price per square foot of $456.
• The highest prices overall and per square foot were within the Town of Crested Butte
where the median price of single-family homes reached $1.4 million, and the median
price for condominiums exceeded $680,000.
• Single family homes prices were highest in the CB Rural area with a median price of over
$1.7 million.
• In Mount Crested Butte, 22% of sales were condominiums, which commanded a median
price of $460,000, and the median price of single family homes topped $1.2 million.
• Prices in CB South also reached an all-time high of over $800,000 for single family
homes and over $500,000 for condominiums.
Williford/Rees/Continuum
172020 Sales in the North Valley
Mount Crested
Crested Butte CB Rural CB South Total
Butte
# of Sales 51 91 36 148 326
Condos/TH's 10 33 18 115 176
Single Family 41 58 18 33 150
Median Price $1,275,000 $1,255,000 $602,500 $506,488 $792,000
Condos/TH's $682,500 $580,000 $512,500 $460,000 $582,500
Single Family $1,400,000 $1,704,825 $803,500 $1,235,000 $1,290,000
Price/SF $665 $443 $327 $456 $455
Source: MLS, Consultant Team
In the South valley, prices have reached levels that surprise many with an overall median price
approaching $400,000 at a median price per square foot of $243. Yet, these sales prices equate
to less than half the cost of homes in the North valley. The total of 202 sales translates into an
average of 16.8 sales per month.
2020 Sales in the South Valley
Almont Gunnison Gunnison Rural Total
# of Sales 21 107 74 202
Condos/TH's 0 50 7 57
Single Family 21 57 67 145
Median Price $516,800 $357,000 $487,500 $386,250
Condos/TH's $319,000 $275,000 $319,000
Single Family $516,800 $375,000 $500,000 $439,300
Price/SF $305 $244 $236 $243
Source: MLS, Consultant Team
Availability
North Valley
The inventory of homes listed for sale in the North valley is low with a total of 45 listings, which
equates to a 1.7-month inventory. An inventory of at least six months is needed for prices to
stabilize. New listings are “trickling in” slowly, but without any major developments under
construction increases in the inventory are not anticipated.
The market is not saturated at any price level although homes at the high end of the market
(≥$3 million) spend more time on the market because the buyer pool is small and it takes
longer to find someone interested and qualified. Condominiums in Mount Crested Butte that
require owners to place them in the short-term rental pool are also slower to sell since buyers
prefer full occupancy rights.
Williford/Rees/Continuum
18North Valley - Homes Listed for Sale (April 2021)
Crested Butte CB Rural/South Mount Crested Butte Total
# of Listings 6 17 22 45
SF 5 13 7 25
Condo/TH 1 4 15 20
Median Price $2,166,500 $3,200,000 $1,420,000 $1,750,000
SF $2,233,000 $3,490,000 $2,500,000 $2,462,500
Condo/TH $725,000 $210,000 $625,000 $1,350,000
Source: MLS, April 18, 2021
South Valley
The inventory of units listed for sale is extremely low in the South valley – the equivalent of a
1.3-month inventory compared to 2020 sales. Properties are typically under contract in 48
hours after multiple showings and offers. Realtors observe the units left on the market are
overpriced with patient sellers who are willing to wait to see if the market moves up to the
level where they will sell.
South Valley - Homes Listed for Sale (April 2021)
Almont Gunnison Rural Gunnison Total
# of Listings 2 9 11 22
SF 2 6 10 18
Condo/TH - 3 1 4
Median Price $712,000 $678,000 $949,000 $750,000
SF $712,000 $681,500 $1,062,000 $831,000
Condo/TH $409,000 $249,000 $352,000
Source: MLS, April 18, 2021
Affordability
Based on 2021 AMI’s, a household earning 100% AMI could afford to purchase a three-
bedroom home if priced at just over $358,000. An income of nearly 500% of the median is
needed to afford a unit at the median list price in the North valley. In the South valley, homes
are more affordable relative to the county’s median income yet still an income of more than
double the median is needed for the median asking price.
North Valley South Valley
Median List Price $1,750,000 $750,000
Affordable AMI 489% 209%
Source: MLS, Consultant Team
New Deed Restricted Inventory
Local jurisdictions have partnered with residents, developers, and contractors to create 100
new affordable homes for sale over the past 10 years.
Williford/Rees/Continuum
19Deed Restricted Units Added Over Past 10 Years
Household
Number of Building
Location Type Incomes
Homes Completion
Served
SF, duplex, 90% AMI to
Paradise Park Crested Butte 34 2020
triplex 200% AMI
Mount Duplexes and 120% AMI to Anticipated
Homestead 22
Crested Butte townhouses 160% AMI 2021
SF, duplex, 80% AMI to Anticipated
Lazy K Gunnison 44
townhouses 120% AMI 2021
Total 100
Buyer Characteristics
North Valley
A large portion of the market consists of buyers seeking a part-time residence, some of whom
may make them their primary or only residence upon retirement. The distinction between part-
time and full-time residents has become blurred, however, as homeowners who often spent
several weeks to a few months in the valley moved in for much of 2020, and the full-time
category came to include newcomers who are not necessarily planning to reside long term in
the area.
At least one-third of buyers are newcomers moving into the area. They are coming from all over
– more geographically diverse than in past years. Buyers are migrating from Colorado’s Front
Range, especially Boulder County, and urban areas throughout the country. While many are still
from Texas, they are coming from all over the state, not just primarily from the Dallas/Fort
Worth and Houston areas.
The ability to work remotely has been the more influential factor fueling migration, far greater
than concerns over COVID contagion or civil unrest. Remote working newcomers want to
experience the lifestyle that Crested Butte offers but are not necessarily committed to staying
and often hold onto the home they own elsewhere. They may have little knowledge about the
area and, according to one realtor, are wearing “rose colored glasses” when it comes to
understanding the challenges of living in the Gunnison valley. This realtor predicts the majority
will move away in three to five years.
Year-round residents are, for the most part, staying put in the homes they own. Few are trying
to move up into larger homes. Even though they may have accumulated significant equity as
prices have increased, they cannot compete with newcomers moving in or part timers.
Williford/Rees/Continuum
20Older residents, both part time and full time, are selling to move to places where the climate is
warmer and health care and other services are more readily available. This is not a new trend
but has been fueled by price increases.
Inventors are purchasing units primarily for short term rental income and strong appreciation.
South Valley
Most of the homebuyers in the South valley are existing residents who
• Have been renting but are moving into ownership because of rising rents or units being
sold out from under them, or
• Have owned in the North valley and cashed out when prices increased then moved
down valley where they could afford to purchase. Roughly 70% of these homebuyers
work locally while 30% work remotely.
The Gunnison area is the only location where people moving in to work local jobs can
potentially find a home they can afford to buy.
Newcomers may try to rent for a year while keeping their homes elsewhere but those who
want to buy are typically able to sell their homes without difficulty given the strength of
housing markets elsewhere, particularly Colorado’s Front Range.
Investors are motivated by rents that have increased to the point where rental units can now
cash flow. For example, of presales on 16 units under construction in Gunnison, two are under
contract to investors. Newcomers to the valley are adding to the investor pool through 1031
exchanges that allow them to have their income properties nearby. Investors purchasing units
in the Gunnison area have increased the supply of long-term rentals; however, at the same
time, long term rentals have been removed from the inventory when their owners decided to
cash out and were purchased by owner occupants.
Retirees have been cashing out of homes they own and moving to warmer climates where
homes are available that meets their needs as they age and often choose locations near
family/grandchildren. Realtors report there are too few single story/ranch style homes in the
Gunnison valley. Units in the few 55+ properties in the Gunnison area have low turnover.
Housing Preferences and Price Targets
Existing residents who are locally employed focus on homes in the $300,000 to $370,000 range,
which pretty much limits their home search to the Gunnison area. They prefer in town, with
convenient access to services. Proximity to RTA bus stops is a big selling point for locals.
Amenities they most highly value include a yard/outside space for dogs, a garage, and updated
kitchens with stainless appliances and stone countertops.
Newcomers to the North valley will consider anything under $1.5 million. In town and on
mountain locations are still preferred. People moving in from other areas of Colorado tend to
Williford/Rees/Continuum
21be more flexible in location and are likely to consider Crested Butte South and outlying
neighborhoods like Meridian Lake.
The price range that newcomers to the South valley target depends upon the location from
where they are moving. Buyers relocating from other areas in Colorado can usually afford
$700,000 or more, but if moving from southern states or other areas where housing prices are
lower, they compete directly with existing employee households for homes in the $300,000 to
$400,000 range.
Home buyers looking for a part-year residence seldom look for homes in Gunnison but instead
look at rural properties with land and mountain views. Proximity to town is not an important
consideration.
Land
Interest in lots has picked up recently, fueled by the inability of newcomers to find homes
available for purchase and by locals who have sold their in-town or close-in homes and are
buying property where they plan to build, often planning to do some of the work themselves.
Lots that have been on the market for years with little movement are now selling. While the
inventory of available lots has declined, there are still far more on the market than homes. As of
mid-April, 140 lots were listed for sale in the North valley. In the Gunnison area, 29 parcels
under 5 acres in size were listed for sale.
A construction backlog has been created by the increase in people purchasing lots and wanting
to build. Many contractors are now booked two to three years into the future. Construction
materials are also going up steeply in price. Builders are unable to finalize prices for homes
under construction with completion scheduled in the summer of 2021 because prices are
escalating so quickly. The post-COVID construction bubble predicted by some industry experts
and economists appears to be happening in the Gunnison valley although it may be moderated
by insufficient construction labor and contractor capacity.
Predictions for the Future
While there are no signs yet of the market softening, realtors in both ends of the valley expect
that many of the newcomers to the Gunnison valley will move away within a few years. The
lack of conveniences, restaurants and nightlife was not an issue in 2020 with COVID restrictions
in place everywhere but, over time, the lure of urban opportunities will likely cause many to
leave the Gunnison valley. Shifts in the way that businesses operate, however, will likely
provide continued opportunities for employees to work remotely. Those who prefer the rural
mountain lifestyle will be able to stay and enjoy it. After the ability to work remotely, the single
biggest factor likely to impact the extent to which newcomers settle in the Gunnison valley will
be the severity of winters. For now, there is still strong confidence in the market. Price
softening in the for-sale market is not expected soon.
Williford/Rees/Continuum
22The Rental Market
This section of the report updates information since 2016 including changes in the supply of
rental units, current availability, increases in rents and impacts on affordability. This
information was gleaned from property manager interviews and online rental listings. While
most property management companies now focus on short term rentals, managers of long-
term rentals interviewed for this report include:
• North valley: Peak Property Management and Sales, Crested Butte Lodging and
Property Management, and Toad Property Management, which together manage about
117 long-term rentals; and
• South valley: Gunnison Real Estate and Rentals, Apogee Real Estate and Property
Management and Berkshire Hathaway Today Realty, which together manage about 390
long-term rentals.
Changes in the Supply of Rental Units
The number of long-term units in the Gunnison valley is fluid, with shifts in the supply due to
the conversion of units into short term rentals and sale of units to owner occupants. Loss of
long-term rentals is particularly challenging since so much of the supply consists of single-family
homes, condominiums and townhomes which can easily be sold or converted. Relatively few
units are apartments or accessory dwellings that can only be rented long term.
• In the North valley, about one-third of the estimated rental supply is apartments or
ADU’s.
• In the South valley, less than 15% of rental units are protected from sale or conversion.
North Valley
We estimate there are currently about 900 rental units in the North valley. Over time, the
percentage of residential units in the Gunnison valley that house year-round residents has been
decreasing while the number of part-time homes has been on the rise. This trend contributes to
housing shortages not only by reducing availability but also by increasing demand for workforce
housing from the jobs that part-time homes generate. At the time of the 2016 assessment 46%
of residential units in the North valley were occupied by full time residents. Of those occupied
units, 40% were occupied by renters, so 18% of total housing inventory was long term rented.
This percentage has likely decreased through the conversion of long-term rentals into owner
occupancy and short term rentals.
Since 2016, it appears the rental supply in the North valley has decreased by about 50 units
based on:
• 36 rental units built in the North valley including Paradise Park employee units, Elk
Valley, SOAR, new townhomes and ADU’s in Crested Butte and unincorporated county;
and
Williford/Rees/Continuum
23• 90 rental units lost, through sale and/or conversion into short term rentals, an estimate
based on the Town of Crested Butte census and property management interviews which
captured only a portion of the changes in the rental supply
Also, in the past year during COVID, some short-term rentals were converted into long-term
rentals as newcomers able to work remotely and the rents they could afford made longer term
leases more profitable. These conversions have created the benefit of more “lights on” in
neighborhoods, but not necessarily made rentals any more available for the local workforce.
South Valley
With approximately 2,000 units, the supply of rental housing in the Gunnison area is twice the
size of the North valley. It has increased in size by approximately 100 units since 2016 with the
recent construction of two new apartment properties. As in the North valley, it has been a fluid
period for the existing rental supply with some rental units lost to sale and owner occupancy.
The two new apartment projects nearing completion offer a combined total of 112 units.
Paintbrush Apartments
Paintbrush Apartments includes a total of 76 units. Of these, 68 are income restricted at 80%
through 200% AMI.
• 29 at 80%
• 30 at 120%
• 9 at 200% AMI
• 8 are free market units
Phased-in occupancy will begin in June 2021 with 61 units and is anticipated to be complete in
Fall 2021. The property offers a diverse mix of units ranging from compact studios through large
three-bedroom units, each with a storage unit (43 – 92 SF) or garage (260 – 290 SF). The three-
bedroom units have 2 or 2.5 baths. As of March 15, 2021, over 100 applicants were on a
waitlist. Rental rates were not yet published. The property is pet friendly.
Paintbrush Apartments, Phase 1
Unit Type # of Units Unit Mix Size
Studio 12 20% 375
1 BR 24 39% 562
2 BR 17 28% 679 – 990, avg 770
3 BR 8 13% 1054 – 1198, avg 1101
Total/Avg 61 100% 654
Source: Leasing agent and Gunnison County
Williford/Rees/Continuum
24Garden Walk Apartments
Garden Walk Apartments offers a mix of 21 one- and 15 two-bedroom units. All 36 units are
income restricted under the Low Income Housing Tax Credit program (LIHTC) to households
with incomes ranging from 30% AMI through 60% AMI. Rents range from $332 to $850 per
month. At 756 SF for one bedroom and 997 for two bedrooms, the units are substantially larger
than at Paintbrush. On April 7, 2021 they had 11 more units to lease with 19 applications.
Service animals are allowed.
Garden Walk Apartments
Unit Type # of Units Unit Mix Size Rent AMI Targets
1 BR 21 58% 756 $332 - $715; avg $589 30% - 60%
2 BR 15 42% 997 $398 - $850; avg $703 30% - 60%
Total/Avg 36 100% 856 $636 50%
Source: GVRHA
Availability
Vacancy rates are under 1% throughout the valley, far below a functional market vacancy level
of around 5%. A three-month monitoring of rental listings on Craigslist, Zillow, Apartments.com,
Crested Butte News, Gunnison Times, property manager websites, and multiple Facebook
groups resulted in just 22 listings valley wide:
• 7 listings in the North valley consisted of four condominiums and three single family
homes with asking rents ranging from $790 to $2,000 per month.
• 15 listing in the South valley – seven apartments, one condo and seven single family
homes with rents ranging from $1,080 to $3,500.
While these samples are small, it appears that the market is equally tight throughout the valley
(7 out of ±900 units = .7%; 15 out of ±2,000 units = .7%). Property managers typically fill units
within a week. Most do not find it necessary to maintain waitlists with a constant stream of
calls from people looking for a rental. Turnover has been low with renters renewing when their
leases expire since they know if they give up their unit, they will have a very difficult time
finding something else in the area.
Rents
Rents have been rising over the past five years, and it appears the trend will continue. In the
North valley, market rents average over $1,500 for two bedrooms, and in the South valley just
over $1,400.
Williford/Rees/Continuum
25Rent Comparison, North Valley vs. South Valley
$3,500
$3,000
$2,500
$2,000
$1,500
$1,000
$500
$0
1BR 2BR 3BR 4 BR
North Valley South Valley
Source: Consultant Team
While rents remain higher in the North valley among all unit types, the cost difference between
the two ends of the valley is decreasing for smaller units. In the North valley, rates increased
about 17% between 2016 and 2020/21 for rentals overall, but only 8% and 2% for one- and
two-bedroom units respectively. In the South valley, rates grew as similar 15% overall, but at
higher rates of 21% for 1BR units and 45% for 2BR units. These dynamics may be explained by
the shortage of small units in the North valley affordable for singles and couples employed
locally, putting pressure on smaller units in the South valley. At the same time, amenity
migrant/COVID remote working families with children continue to escalate rental rates for
larger units in the North valley.
Market Rents -- Change since 2016
North Valley
1BR 2BR 3BR 4 BR Overall
2016 $1,025 $1,500 $1,850 $2,500 $1,700
2021 $1,104 $1,534 $2,100 $2,975 $1,995
Increase $79 $34 $250 $475 $295
% Change 8% 2% 14% 19% 17%
South Valley
1BR 2BR 3BR 4 BR Overall
2016 $700 $975 $1,500 $1,950 $1,200
2021 $844 $1,413 $1,729 $2,000 $1,382
Increase $144 $438 $229 $50 $182
% Change 21% 45% 15% 3% 15%
Williford/Rees/Continuum
26In 2020, some property managers held rents at 2019 levels due to concerns about COVID
impacting jobs, incomes and the ability of tenants to pay. Now that the economy has
rebounded, significant increases in market rents should be expected.
To be considered affordable, current rents require incomes of 74% to 130% AMI in the North
valley and 57% to 87% in the South valley.
Affordability of Rents
1BR 2BR 3BR 4 BR
North Valley $1,104 $1,534 $2,100 $2,975
AMI Equivalent 74% 86% 102% 130%
South Valley $844 $1,413 $1,729 $2,000
AMI Equivalent 57% 79% 84% 87%
Williford/Rees/Continuum
27Appendix A - Acknowledgements
Thank you to the agencies and individuals who made this update possible:
• Gunnison Valley Regional Housing Authority who guided the work allocated resources
for the update.
• Subject matter experts who contributed their time and expertise.
• Local media outlets for encouraging participation in the survey.
• Gunnison County Economic Development for dashboard data and adding to their
monthly business survey.
• All the local employers who took time to complete the survey in April.
• Valley Housing Fund – who supported a study of rental housing in the North valley
earlier this year; findings in this report build upon that work.
Williford/Rees/Continuum
28Appendix B - Median Family Income for Gunnison County (2021)
Colorado Housing and Finance Authority (for LIHTC project use only)
Household Size 1 2 3 4 5 6
AMI Classifications
Extremely Low (30% AMI) 16,620 18,990 21,360 23,730 25,650 27,540
Very Low (50% AMI) 27,700 31,650 35,600 39,550 42,750 45,900
60% AMI (LIHTC max) 33,240 37,980 42,720 47,460 51,300 55,080
Low (80% AMI) 44,320 50,640 56,960 63,280 68,400 73,440
Median (100% AMI) 55,400 63,300 71,200 79,100 85,500 91,800
Moderate/Middle (120% AMI) 66,480 75,960 85,440 94,920 102,600 110,160
Upper (150% AMI) 83,100 94,950 106,800 118,650 128,250 137,700
Source: CHFA 2021
Gunnison Valley Regional Housing Authority (for all projects except LIHTC or using CHFA subsidies)
Household Size 1 2 3 4 5 6
AMI Classifications
Extremely Low (30% AMI) 16,650 19,000 21,960 26,500 31,040 35,580
Very Low (50% AMI) 27,700 31,650 35,600 39,550 42,750 45,900
60% AMI (LIHTC max) 33,240 37,980 42,720 47,460 51,300 55,080
Low (80% AMI) 44,350 50,650 57,000 63,300 68,400 73,450
Median (100% AMI) 55,400 63,300 71,200 79,100 85,500 91,800
Moderate/Middle (120% AMI) 66,480 75,960 85,440 94,920 102,600 110,160
Upper (150% AMI) 83,100 94,950 106,800 118,650 128,250 137,700
Source: GVRHA 2021
Williford/Rees/Continuum
29You can also read