H1 2020 Results Presentation - 20 August 2020 - Capital Limited
←
→
Page content transcription
If your browser does not render page correctly, please read the page content below
H1 2020
Results Presentation
20 August 2020
Disclaimer
IMPORTANT NOTICE

This document does not constitute or form part of any offer or invitation to sell or issue, or any solicitation of any offer to purchase or subscribe for, any securities of Capital Limited (the “Company”), nor shall any part of it nor the fact of its
distribution form part of or be relied on in connection with any contract or investment decision relating thereto, nor does it constitute a recommendation regarding the securities of the Company.
This document is being supplied to you solely for your information. No reliance may be placed for any purposes whatsoever on the information or opinions contained in this document or on its completeness. No representation or warranty,
express or implied, is given by or on behalf of the Company or any of its directors, officers or employees or any other person as to the accuracy or completeness of the information or opinions contained in this document and no liability
whatsoever is accepted by the Company or any of its members, directors, officers or employees nor any other person for any loss howsoever arising, directly or indirectly, from any use of such information or opinions or otherwise arising in
connection therewith.
This document and its contents are confidential and may not be reproduced, redistributed or passed on, directly or indirectly, to any other person or published, in whole or in part, for any purpose. This document is only addressed to and
directed at persons in member states of the European Economic Area who are “qualified investors” within the meaning of Article 2(1)(e) of the Prospectus Directive (Directive 2003/71/EC) (“Qualified Investors”). In addition, in the United
Kingdom, this document is being distributed only to, and is directed only at, Qualified Investors (i) who have professional experience in matters relating to investments falling within Article 19(5) of the Financial Services and Markets Act 2000
(Financial Promotion) Order 2005, as amended (the “Order”) and Qualified Investors falling within Article 49(2)(a) to (d) of the Order, and (ii) to whom it may otherwise lawfully be communicated (all such persons together being referred to
as “relevant persons”). This document must not be acted on or relied on (i) in the United Kingdom, by persons who are not relevant persons, and (ii) in any member state of the European Economic Area other than the United Kingdom, by
persons who are not Qualified Investors. Any investment or investment activity to which this document relates is available only to (i) in the United Kingdom, relevant persons, and (ii) in any member state of the European Economic Area
other than the United Kingdom, Qualified Investors, and will be engaged in only with such persons.
Neither this document nor any copy of it may be taken or transmitted into the United States of America, its territories or possessions or distributed, directly or indirectly, in the United States of America, its territories or possessions. Neither
this document nor any copy of it may be taken or transmitted into Australia, Canada, Japan or the Republic of South Africa or to any securities analyst or other person in any of those jurisdictions. Any failure to comply with this restriction
may constitute a violation of United States, Australian, Canadian, Japanese or South African securities law. The distribution of this document in other jurisdictions may be restricted by law and persons into whose possession this document
comes should inform themselves about, and observe, any such restrictions.
The securities mentioned herein have not been, and will not be, registered under the US Securities Act of 1933 (the “Securities Act”), or under the applicable securities laws of Canada, Australia, Japan or the Republic of South Africa, and may
not be offered or sold in the United States (as such term is defined in Regulation S under the Securities Act) unless they are registered under the Securities Act or pursuant to an exemption from, or in a transaction not subject to, the
registration requirements of the Securities Act and, subject to certain exceptions, may not be offered or sold within Canada, Australia, Japan or the Republic of South Africa or to any national, resident or citizen of Canada, Australia, Japan or
the Republic of South Africa. No public offer of securities in the Company is being made in the United States, Canada, Australia, Japan or the Republic of South Africa.
Certain statements, beliefs and opinions in this document are forward-looking, which reflect the Company’s or, as appropriate, the Company’s directors’ current expectations and projections about future events. By their nature, forward-
looking statements involve a number of risks, uncertainties and assumptions that could cause actual results or events to differ materially from those expressed or implied by the forward-looking statements. These risks, uncertainties and
assumptions could adversely affect the outcome and financial effects of the plans and events described herein. Forward-looking statements contained in this document regarding past trends or activities should not be taken as a
representation that such trends or activities will continue in the future. The Company does not undertake any obligation to update or revise any forward-looking statements, whether as a result of new information, future events or
otherwise. You should not place undue reliance on forward-looking statements, which speak only as of the date of this document.
By attending the presentation to which this document relates or by accepting this document you will be taken to have represented, warranted and undertaken that: (i) you are a relevant person (as defined above); (ii) you have read and
agree to comply with the contents of this notice; and (iii) you will use the information in this document solely for evaluating your possible interest in the Company and for no other purpose.

                                                                                                                                                                                                                                                             2
Section 1 – Summary
Capital Limited Snapshot
                                                                                                 KEY METRICS H1 2020

We provide full-service mining,                                              REVENUE                       EBITDA                          NET PROFIT

drilling, maintenance and                                               $65.1 million              $15.4 million                     $13.6 million
geochemical analysis solutions to                                        Up 18.8% on H1 2019        Up 21.3% on H1 2019               Up 166.7% on H1 2019

customers within the global
minerals industry, focusing on the                                                               STRATEGIC PRIORITIES

African markets
                                                                     Grow capacity and revenue     Increase utilisation            Grow ancillary services
                                                                      with existing customers       through idle fleet                   revenue
• Capital Drilling Ltd changed its company name to Capital Limited
  (Capital) in June 2020

• Capital Limited better reflects the company’s expanded range of
  services, including mineral analysis and load and haul                  MAJOR CLIENTS          REVENUE BY CUSTOMER            MINE SITE BASED REVENUE
                                                                                                   MAJOR & MID-TIER                 NINE OPERATING MINE
• 15-year history in Africa, commenced operations in 2005
                                                                                                       CLIENTS                             SITES
• Listed on LSE (premium listing) in June 2010

• Operations across nine African and Middle Eastern countries
                                                                                                          98%                               94%
                                                                                                    Revenue derived from        Less exposed to fluctuations in the
• History of strong financial performance and investor returns                                    Tier 1 and Mid-Tier clients             mining cycle

                                                                                                                                                              4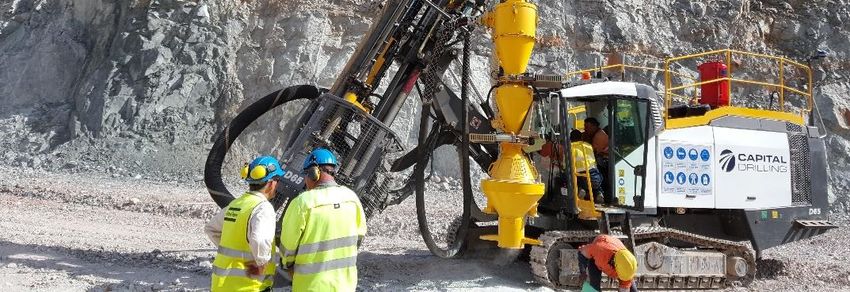
Our Capabilities
                                                                        SERVICES ACROSS THE MINING CYCLE

We provide a full range of services
for companies operating across the
minerals mining cycle

• Provides clients with a fully integrated end-to-end mining services
  solution

• Capacity to work across all facets of a project

• Deliver greater management and communication efficiencies

• Improved efficiencies enable faster identification and
  implementation of improvements or changes

• Flexible, coordinated approach keeping programs on schedule

                                                                                                           5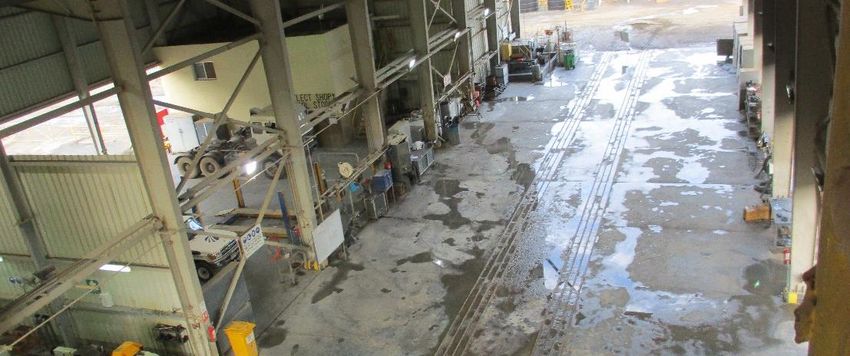
Well Established Contracts, Tier 1 Operations
                                WEST AFRICA                                                          MIDDLE EAST AND NORTH AFRICA

     Mauritania                              Mali
     Commenced in 2010                       Commenced in 2016
     • Grade control drilling
                                                                                                 Egypt                         Saudi Arabia
                                             •      Underground,
                                                                                                 Commenced in 2005             Commenced in 2019
     • Maintenance services                         delineation and
                                                    exploration drilling                         •    Blast hole, grade        •       Underground exploration
     • Laboratory services
                                                                                                      control and                      and delineation drilling
                                                                                                      delineation drilling

                                                                                                                       EAST AFRICA

 Mali                                    Côte d’Ivoire
 Commenced 2018                          Commenced 2019
 •     Exploration, dewatering           •       Exploration, grade
       and delineation drilling                  control and blast hole    Current operations    Tanzania (North Mara)             Tanzania
                                                 drilling                  Previous operations
                                                                           Long-term contracts   Commenced in 2008                 Commenced in 2006
                                         •       Equipment hire,                                 •    Blast hole and grade         •    Blast hole, grade control,
                                                 maintenance service and                              control drilling                  exploration, delineation
                                                 management services
                                                                                                 •    Exploration and                   and underground drilling
                                                                                                      delineation drilling

                                                                                                                                                               6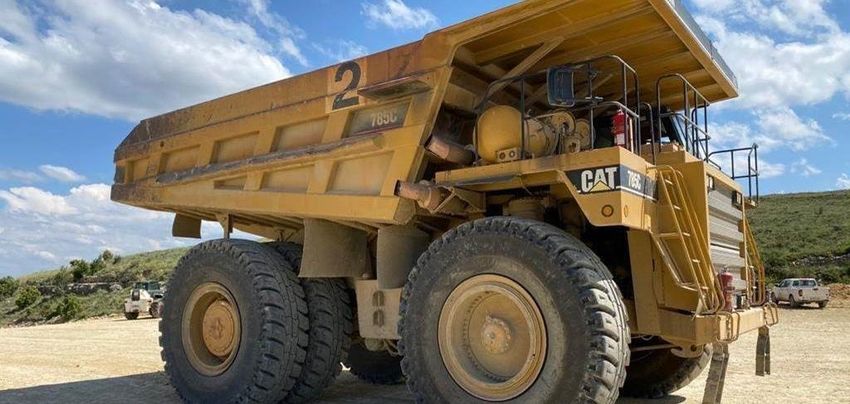
Gold Market
GOLD PRICE FINANCING BY JUNIOR AND INTERMEDIATE COMPANIES
Last price (US$/oz) 12M trailing average 3,500
1,800
1,700
3,000
Miner Deal Values (US$m)
1,600 2,500
1,500 2,000
1,400 1,500
1,300 1,000
1,200 500
1,100 0
Feb-18
Sep-18
Oct-18
Feb-19
Sep-19
Oct-19
Feb-20
Jan-18
Mar-18
Nov-18
Jan-19
Mar-19
Nov-19
Jan-20
Mar-20
May-18
Jun-18
May-19
Jun-19
May-20
Jun-20
Apr-18
Jul-18
Apr-19
Jul-19
Apr-20
Aug-18
Dec-18
Aug-19
Dec-19
Q1 Q2 Q3 Q4 Q1 Q2 Q3 Q4 Q1 Q2 Q3 Q4 Q1 Q2 Q3 Q4 Q1 Q2 Q3 Q4 Q1 Q2 Q3 Q4 Q1 Q2 Q3 Q4 Q1 Q2
2013 2014 2015 2016 2017 2018 2019 2020
Source: Bloomberg Data Source: Bloomberg Article July 21, 2020
• Highly supportive gold price, which has increased strongly since Q2 2019, reaching record highs in early Q3 2020
• Capital generates >90% of its revenue from services to gold mining and exploration companies
• Recent sector M&A highlights the desire to build reserve bases, however this drive is yet to meaningfully impact exploration activity
• Recent strength in the gold price has seen a welcome surge in equity market activity
• Increased capital raising activity is a strong lead indicator for increased activity levels, both in drilling and mining
HIGHLY SUPPORTIVE GOLD PRICE
7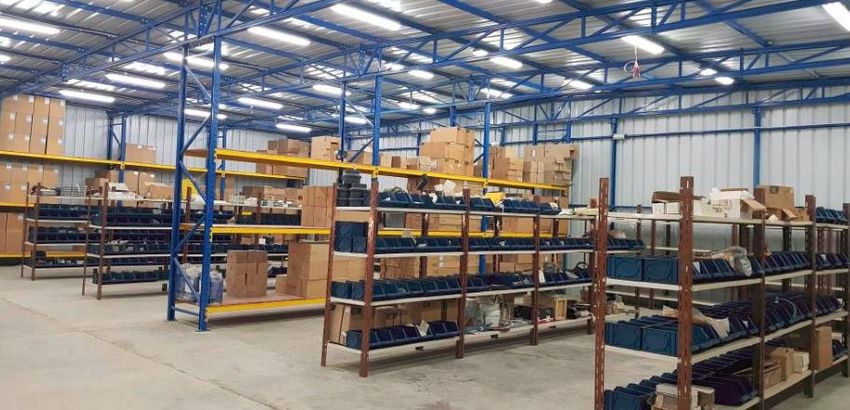
Our Strategy
                                                STRATEGIC FOCUS AREAS                                         DELIVERING AGAINST STRATEGY 2020

                                 •   Strong established presence in East Africa and Egypt
     African Focused                                                                                   •   Continued asset relocation strategy into West Africa
                                 •   Expansion into West African region

                                 •   Deliver first world project execution standards in the emerging   •   Maintained first class project performance including high
     Quality Providers               markets                                                               availabilities and continued strong ARPOR

                                 •   World class safety processes and procedures on every site         •   LTI-free milestones achieved at most long-term contracts during
     Industry Leading HSE                                                                                  H1 2020

                                 •   Investment in Tier 1 on-site maintenance infrastructure           •   Continued active fleet management process
     Best in Class Fleet /
                                 •   Maintenance and rebuild programs to maintain industry leading     •   Investment in new equipment to supplement and improve the
     Maintenance                     standards                                                             existing asset base

     Superior Portfolio of
                                 •   Blue chip and mid-tier mining companies                           •   Added new long-term contract to the portfolio
     Contracts

                                 •   Strong cash generation                                            •   Strong cash flows funding new asset purchases and paying
     Robust Balance Sheet        •   Conservative approach to gearing                                      dividends

                                                                                                       •   Addition of load and haul services
     Increase Service Offering   •   Expand range of complimentary services                            •   Growth in geochemical analysis activities
                                                                                                       •   Establishment of Mine Site Maintenance subsidiary
                                                                                                                                                                             8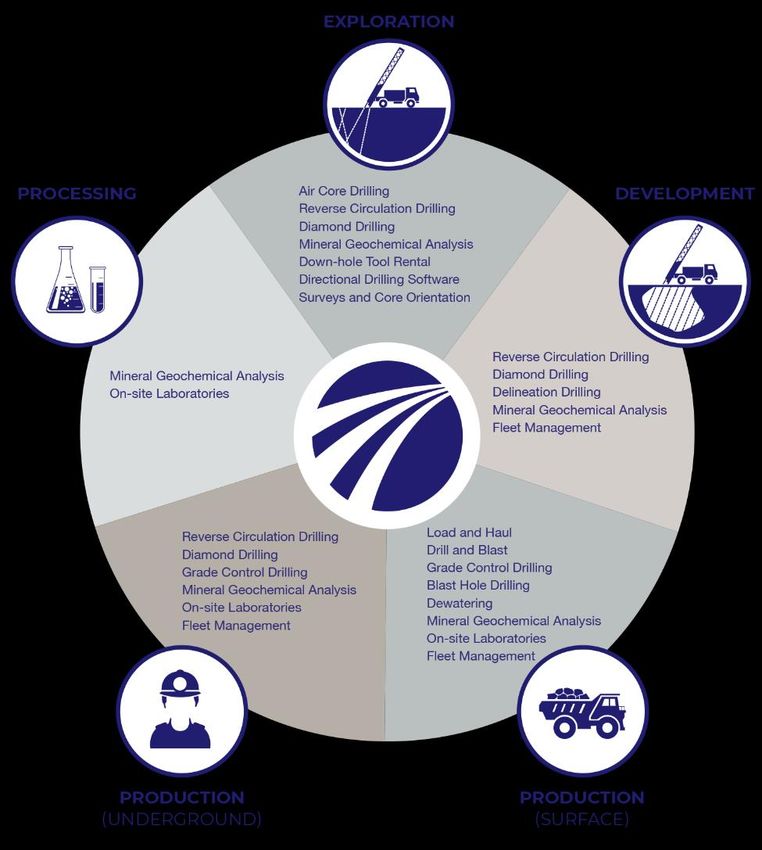
Industry Leading Safety Standards
            LTI FREQUENCY RATE TREND (2009 – H1 2020)                                                                                           COMMENTARY

                                  0.41
                                                                                                            • Industry leading safety performance
                                                                                                            • Loss Time Injury Frequency Rate (LTIFR) of 0.08 in H1 2020
                                                                                                            • All Injury Frequency Rate (AIFR) of 0.33

                   0.29                                                    0.25                             • Achievement of a number of safety records including:
    0.18
                                                                    0.2                                       ˗ Tanzania, Mwanza Facility:            12 years LTI free in January 2020

                                                           0.13                                                ˗ Egypt, Sukari Project:                3 years LTI free in January 2020
            0.11
                                            0.09   0.09                                             0.08       ˗ Tanzania, North Mara Project:         4 years LTI free in March 2020
                                                                                             0.05
                                                                                      0                        ˗ Tanzania, Geita Project:              3 years LTI free in March 2020
                                                                                                               ˗ Mauritania, Tasiast Project:          3 years LTI free in June 2020
    FY 09   FY 10         FY 11   FY 12   FY 13    FY 14   FY 15   FY 16   FY 17   FY 18   FY 19    H1 20
                                                                                                               ˗ Mali, Syama Project:                  4 years LTI free in June 2020
                                      * LTI per 200,000 man hours worked

                                                                                                                                                                                          9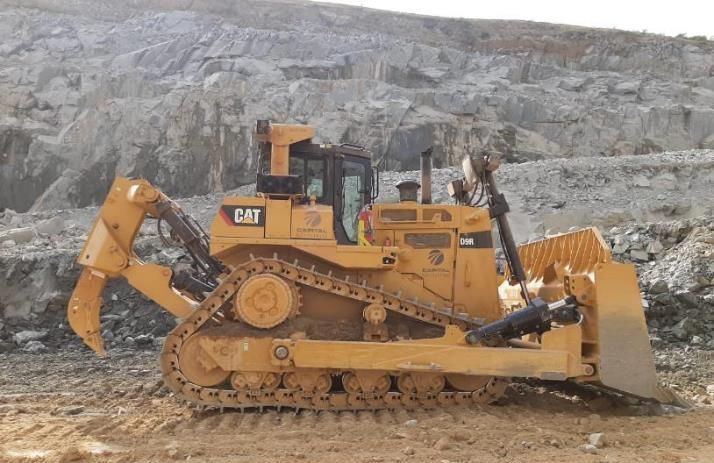
Section 2 – Results
H1 2020 Highlights
  STRATEGIC AND OPERATIONAL

          New contract wins with existing and new customers, including a
                                                                           Increase rig fleet utilisation to 57%, with closing fleet of 100 rigs
          new long-term mine-site contract

          ARPOR stable at $170,000, no material production interruptions   Multiple LTI-free safety milestones achieved at key long-term
                                                                           contracts

                                                                           Further developed capability of non-drilling businesses with key
          Non-drilling revenue increase to 11% of total Company revenue
                                                                           hires in the mining team and expansion of laboratory operations

  FINANCIAL

          Strong revenue result of $65.1 million, up 18.8% on H1 2019      EBITDA up 21.3% to $15.4 million on H1 2019 ($12.7 million)
          ($54.8 million)

          Material NPAT increase of 166.7% to $13.6 million (H1
          2019: $5.1 million)                                              Gains from equity investments of $9.9 million in H1 2020

          Earnings per share (EPS) up 170.5% to 10.0 cents (H1 2019:       Interim dividend of 0.9 cents per share, to be paid on 25 September
          3.7 cents)                                                       2020, up 28.6% on H1 2019 (0.7 cents per share)

                                                                                                                                                   11
H1 2020 Financial Overview
% change from % change from COMMENTARY
Revenue KPIs H1 2020 H1 2019 H2 2019
H1 2019 H2 2019
• Revenue US$65.1 million, an 18.8% increase on H1 2019
Average Fleet Size 99 91 92 8.8% 7.6% - Increased fleet utilisation of 57%, up 9.6% on H1 2019, with a larger fleet of
100 rigs (H1 2019: 92 rigs)
Fleet Utilisation (%) 57 52 56 9.6% 1.8%
- Strong ARPOR of US$170,000 from H2 2019, down 7.1% on H1 2019
(US$183,000)
ARPOR ($) 170,000 183,000 170,000 -7.1% 0.0%
• EBITDA US$15.4 million, up 21.3% on H1 2019
% change from % change from - Slightly increased margins at 23.7%, H1 2019 of 23.2%, reflecting the
Reported Earning H1 2020 H1 2019 H2 2019 sustained focus on cost management
H1 2019 H2 2019
Revenue ($m) 65.1 54.8 60.0 18.8% 8.5% • NPAT US$13.6 million, a 166.7% increase on H1 2019
- Strong operational performance materially boosted by investment portfolio
EBITDA ($m) 15.4 12.7 14.6 21.3% 5.5%
EBIT ($m) 9.6 7.9 8.7 21.5% 10.3% • H1 2020 interim dividend declared of 0.9 cents per share, up 28.6% on H1 2019
(0.7 cents per share)
NPAT ($m) 13.6 5.1 5.3 166.7% 156.6%
Basic EPS (cents) 10.0 3.7 7.7 170.5% 30.0%
Diluted EPS (cents) 9.9 3.7 7.6 167.2% 30.1%
Gross Profit (%) 39.4 39.1 39.8 0.8% -1.0%
EBITDA (%) 23.7 23.2 24.3 2.0% -2.8%
EBIT (%) 14.7 14.4 14.5 2.4% 1.7%
NPAT (%) 20.9 9.3 8.8 124.6% 136.5%
12Sustained Profitability
GROSS PROFIT AND MARGINS EBITDA AND MARGINS
18.0 EBITDA (USDm) EBITDA (%) Avg Margin 30%
GP (USDm) GP (%) Avg Margin
27.2%
30.0 42.2% 45% 16.0 23.7%
39.1% 39.8% 23.2% 24.3% 25%
38.1% 39.4% 22.2% 22.9%
38.2% 40% 14.0
25.0
20.3%
34.5% 18.7%
35% 12.0 20%
30.5% 17.5%
GP Margin %
28.0%
EBITDA US$m
20.0 26.4% 30%
EBITDA %
10.0
15%
GP US$m
25%
15.0 8.0 11.2% 15.8 15.4
22.4% 14.6
25.7 20%
24.5 23.9 6.0 12.7 12.5 12.7 10%
21.8 11.6
10.0 20.8 21.4 15%
17.4 4.0 5.0%
7.9 7.3
13.4 12.7 13.6 10% 5%
5.8
5.0 8.9 2.0
5%
2.0
0.0 0%
0.0 0%
H1 15 H2 15 H1 16 H2 16 H1 17 H2 17 H1 18 H2 18 H1 19 H2 19 H1 20 H1 15 H2 15 H1 16 H2 16 H1 17 H2 17 H1 18 H2 18 H1 19 H2 19 H1 20
COMMENTARY COMMENTARY
• Continued solid performance in Gross Profit margins • Continued solid performance in EBITDA margins
- Strong performance to maintain GP margins despite higher labour cost inputs
due to the impact of COVID-19 • Margins increased from H1 2019, despite additional management and support
- Higher direct labour costs impact, 1% of margin headcount
- Lower other Direct Expenses contributed to margin performance
• Over the period Capital established corporate offices in Perth and London and
• Improving performance at a number of sites reflecting improved disciplines with made a number of key hires in Business Development, Contracts, Legal and
new management team Finance, adding bandwidth to support our expansion plans
13Strong Cash Flow
H1 2020 H1 2019 H2 2019 OPERATING CASH FLOW / FREE CASH FLOW
Cash Flow
US$m US$m US$m
Cash Generated from Operations Free Cash Flow
25.0
EBITDA 15.4 12.7 14.6
Other non Cash flow adjustments 1 0.8 0.5 20.0
Operating cash flows before working capital changes 16.4 13.5 15.1 15.0
Working Capital Movements -9.4 -3 3.1 10.0
Cash generated from operations 7 10.5 18.2
5.0
CAPEX and proceeds from Capex (1) -7.0 -6.4 -9.4
-
Investments and cash from Business Combination 0.5 -1.7 -6.1
(5.0)
Finance charges and Tax Payments -3.5 -2.4 -1.6 H1 15 H2 15 H1 16 H2 16 H1 17 H2 17 H1 18 H2 18 H1 19 H2 19 H1 20
Free Cash Flow -3 0 1.1
Movement in long term liabilities(1) 2.2 -2.1 1.8
H1 2020 NET CASH MOVEMENTS
Dividends paid -1 -2 (1.0)
Net increase in cash -1.8 -4.1 1.9
Opening Cash Balance 17.6 19.9 15.5
FX on cash -0.3 -0.3 0.3
Closing cash balance 15.5 15.5 17.6
(1) excludes assets purchased via finance leases
• Strong performance in operating cash flows, up 21% on H1 2019
• Cash from operations of $7 million, due to working capital outflows:
- Asset prepayments of $3 million
- Receivables timing of $2 million
- Inventory outflow $1 million
- VAT and other tax payments $2 million 14Capital Expenditure
US$m H1 Capex H2 Capex
H1 2020 CAPEX
30.0
25.0
Rig Improvement
14.1 $1.4m
20.0 14.3
15.0
13.4
2.9
10.0
8.7 6.5 Vehicles & Trucks
15.9 6.6
12.4 * $1.2m
5.0 10.7 4.5
1.7 6.4 7.0
4.1 4.2 5.4
2.6 3.4
0.0
FY 11 FY 12 FY 13 FY 14 FY 15 FY 16 FY 17 FY18 FY19 H1 20
Rods
$2.5m
• Capital expenditure (CAPEX) US$7.0 million
• Acquired one further underground rig for deployment with Barrick in Tanzania (Bulyanhulu) Ancillary
$1.1m
• Increased investment in support equipment (vehicles, trucks, ancillary) to support expanded
fleet in West Africa Mining
Equipment
New Rigs $0.4m
• Further investment in mining equipment (deposits on trucks and excavators) to better $0.4m
position the company for contract wins
- Asset deposits reflected in working capital outflows in H1 2020 of $3 million
DISCIPLINED APPROACH TO CAPITAL MANAGEMENT
15Strong Balance Sheet
H1 2020 H1 2019 H2 2019 % change % change COMMENTARY
Balance Sheet from H1 from H2
US$m US$m US$m
2019 2019 • Maintained strong balance sheet, closing the period neutral Net Cash
Cash and cash equivalents 15.5 15.5 17.6 0.0% -11.9% • Investment gains substantially increased portfolio value
Investments 23.2 8.9 12.5 160.7% 85.6% • Increase in receivables reflects increased revenues
Receivables 32.4 24.6 25.2 31.7% 28.6% • Shareholder equity increased 15.2% from H2 2019
Inventory 18.8 18.4 17.5 2.2% 7.4%
• Successfully renewed and increased the value of the Group RCF facility to
Other assets 2.4 0.8 2.6 200.0% -7.7% $15 million (previously $12 million) with a three-year term with Standard
Property, plant and equipment 54.2 40.3 52.9 34.5% 2.5% Bank
Total Assets 146.5 108.5 128.3 35.0% 14.2%
Payables 23.4 17.6 23.1 33.0% 1.3%
Borrowings 15.6 7.1 13.2 119.7% 18.2%
Right of use liabilities (IFRS 16) 0.6 0.5 0.7 20.0% -14.3%
GROSS DEBT vs NET CASH (DEBT) TO EQUITY (%)
Taxation 6.8 4 4.4 70.0% 54.5%
USD$ Total Debt Net Cash (Debt) to Equity (%)
Total Liabilities 46.4 29.2 41.4 58.9% 12.1%
20.0 20.0%
Total Equity 99.0 79.3 85.7 24.8% 15.5%
Less Non-Controlling Interest 1.1 0.0 1.2 N/A -8.3% 15.0 15.0%
Total Shareholders Equity 100.1 79.3 86.9 26.2% 15.2%
10.0 10.0%
Net Asset Value per share (cents) 72.4 58.3 63.0 24.2% 14.9%
5.0 5.0%
Net Cash ($m) -0.1 8.5 4.4 -101.2% -102.3%
0.0 0.0%
Gearing (Net Cash to Equity in %) -0.1 10.7 5.2 -100.9% -101.9%
-5.0 (5.0%)
Return on Total Assets (%)* 12.5 15.6 13.0 -19.6% -3.6% H1 15 H2 15 H1 16 H2 16 H1 17 H2 17 H1 18 H2 18 H1 19 H2 19 H1 20
Return on Invested Capital (%)* 17.0 18.8 17.0 -9.3% 0.3%
* ROTA = LTM EBIT / Total assets
ROIC = LTM EBIT / Invested capital
16Investments
BACKGROUND PERFORMANCE
• Capital has selectively engaged in Drill for Equity and Direct Investment since 2015 • Capital generated substantial (unrealised) returns from the investment portfolio over
H1 2020
• Investments must satisfy a number of criteria:
- Strategic alignment with Capital’s operations • Total investments value increased from $12.5 million (December 2019) to $23.2 million
- Stand alone investment case, with investment committee oversight (June 2020)
- Commercial services contract
- Preferred or exclusive services terms • Investment gains of $9.9 million in H1 2020
- Gains on both listed and unlisted investments, with strong contributions from
• Creates a strategic partnership approach to contracting, helping to develop long Predictive Discoveries and Allied Gold Corp
term relationships
• Cash flow inflow in H1 2020 of $0.5 million, reversing significant outflow in 2019 ($7.9
• Significantly increased activity in 2019, consistent with: million)
- Capital’s accelerated expansion into West Africa
- Lack of funding sources for exploration companies • Contract revenue from investee customers of $8.0 million in H1 2020
- Depressed valuations for exploration companies, despite increasing sector M&A
and supportive gold prices
SELECTED HOLDINGS
172020 Interim Dividend
• Interim dividend declared for H1 2020 of US 0.9cps (2019: interim dividend of US 0.7cps)
• Declared a second half interim dividend of US 0.7cps on 19 March 2020, payment date 04 May 2020
• We will continue our disciplined approach to capital management – we remain committed to a strong
balance sheet
Return excess to
Shareholders Investment
DIVIDEND DECLARED 2014 2015 2016 2017 2018 2019
through dividends
Cents per share 1.9 3.6 2.5 1.7 2.1 1.4
Amount ($’m) $2.56 $4.85 $3.38 $2.31 $2.86 $1.91
DIVIDEND TIMETABLE
August 20, 2020 H1 2020 Results release and dividend declaration Strong
September 03, 2020 Ex-dividend date Balance Sheet
September 04, 2020 Record date
September 25, 2020 Payment date
18Section 3 – Strategy Update
Growth Drivers
       EXPAND CAPACITY WITH EXISTING                                                                                                     GROW ANCILLARY
                                                                             UTILISE IDLE ASSETS
                CUSTOMERS                                                                                                                SERVICES REVENUE

  • Eight existing long-term contracts                        • Idle capacity in exploration fleet                        • Established range of ancillary services across mining
                                                                                                                            cycle
  • Capital’s strategy focused on providing multiple          • 2019 saw a material increase in the depth of Capital’s
    services to existing clients, expanding the services as     exploration customer base                                 • Focus on building capability through people,
    the projects develop                                                                                                    infrastructure and equipment
                                                              • Exploration activity remained subdued during H1
  • Numerous long-term contracts have increased assets          2020, primarily due to COVID-19 restrictions              • New management teams in place for Capital Mining
     during H1 2020                                                                                                         and MSM (Maintenance)
                                                              • Anticipate surge in equity raisings will drive spike in
                                                                exploration activity

                                                                                                                                                                                    20
Increase Assets with Existing Customers
LEVERAGE EXISTING INFRASTRUCTURE • Capital’s strategy focused on providing multiple services to existing clients,
expanding the services as the projects develop
• Leverages the existing on-site infrastructure and adds depth to the service offering
• Increased rig fleet utilisation in H1 2020 attributable to increased demand from
existing customers
• Increased our services across multiple sites in H1 2020, including:
- Bonikro (Allied Gold)
- Geita (AngloGold Ashanti)
- Syama (Resolute)
- Yanfolila (Hummingbird)
EXISTING LONG-TERM CONTRACTS
Bonikro Geita Jabal Sayid North Mara
Cote d’Ivoire Tanzania Saudi Arabia Tanzania
Sukari Yanfolila Tasiast Syama
Egypt Mali Mauritania Mali
21Increase Exploration Fleet Utilisation
IDLE EXPLORATION RIGS • H1 2020 rig utilisation of 57% (up 9.6% on H1 2019), on a fleet of 100 rigs
• Production and underground fleet near full utilisation, with substantial idle
capacity in existing exploration fleet
• Platform for higher utilisation built in 2019, with a record number of
exploration contract wins, eight of which were in West Africa
CURRENT EXPLORATION CONTRACTS
Air Core Diamond Core Reverse Circulation
POTENTIAL REVENUE CAPTURE TANZANIA MALI
CÔTE D'IVOIRE Project Executed
Commenced Commenced
Q2 2020
Q4 2019 Q1 2020
Approximately H1 2020 ARPOR of
40 idle rigs US$170,000 per rig
BURKINA FASO CÔTE D'IVOIRE MALI EGYPT
Recommenced Commenced Commencing Commencing
Q3 2020 Q3 2020 Q3 2020 Q3 2020
Revenue opportunity H1 2020 revenue
> $80 million US$65.1 million
22Grow Non-Drilling Revenue
LOAD & HAUL SERVICES: CAPITAL MINING
• Established the mining division, Capital Mining Services in H2 2019
• Commenced first contract for ancillary mining services at the Bonikro Mine in H2 2019
• Continue to build the core team, including Chief Development Officer, Contracts, Legal and Head of Maintenance
• Actively engaged on multiple tenders across a mix of existing and new customers
• Load & haul tenders represent a larger revenue opportunity for the Group, with potential contract revenues >$40 million per annum in revenue
• Selectively investing in mining equipment, better positioning the Group for tendering success
INCREASED CAPABILITY PROVIDES BROADER OPPORTUNITIES WITH LARGER CLIENT BASE
23Grow Non-Drilling Revenue
ANCILLARY SERVICES LAB SERVICES: MSALABS
• Restructured management team
• Increased investment in African infrastructure
- Acquisition of ELAM laboratory (Cote d’Ivoire)
- Commissioning of new laboratory in Nouakchott (Mauritania)
• Significant increase in new clients including Allied Gold, Endeavor Mining and
Perseus Mining
• African revenue now represents over 50% of MSALAB’s revenue
Capital Mining: Load & Haul MSALABS: Laboratory services MSM: Maintenance services
SERVICE OFFER ACROSS MINING CYCLE MAINTENANCE SERVICES: MSM
• New management team installed to grow the fledgling business
• Multiple distribution agreements signed for product distribution into Africa
• Actively engaged in tenders for maintenance services and hydraulics supplies
• Established infrastructure in West Africa (stores and service centers)
• Introduced new products delivering consumables cost savings to Capital
• Began third party sales in H1 2020
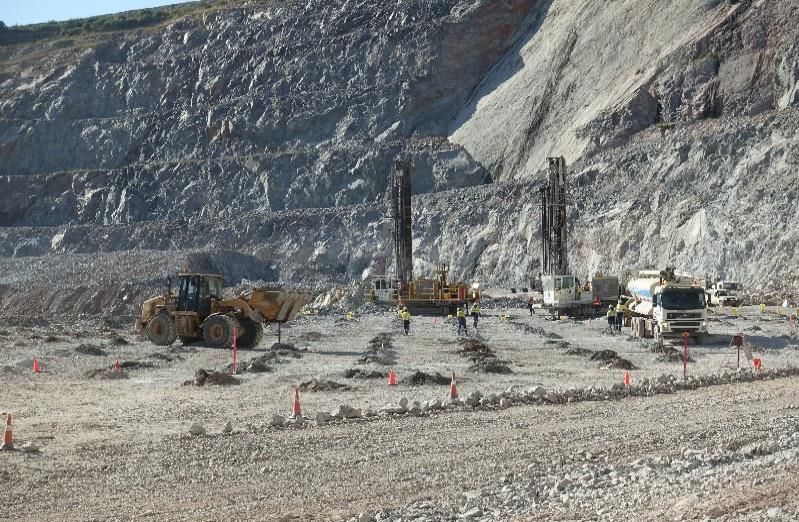
24Young and Expanding Fleet
Our company operates one of the
youngest equipment fleets in the
industry, as a result of our regular
maintenance and upgrades
• Reputation for a quality, reliable fleet
• Equipment is fitted with the latest technologies for enhanced
efficiency, safety and data collection
• Established drill rig fleet includes diamond core, air core, reverse
circulation / grade control, blast hole and underground rigs
• Expanding mining equipment fleet:
- CAT D9 dozers
- CAT 16M grader
- CAT 6020B mining shovel
- CAT 6040 mining shovel
- CAT 340 excavator
- CAT 785 haul trucks
25Outlook
Record gold price is a positive indicator for Capital, with over 90% of Capital Limited revenue from gold producers
Surge in equity market activity during Q2 is a strong lead indicator for demand
Strong industry fundamentals with improved operating cash flows for producers and a fundamental need to replace depleted resources
and reserves
West Africa continuing to attract bulk of African investment, asset movements into the region largely completed, providing strong
platform to take advantage of new opportunities
Substantial increase in tendering pipeline activity across all business units
Uncertainty associated with COVID-19 pandemic continues, some positive signs of restrictions easing, monitoring and management of
the situation will continue
Robust balance sheet, established infrastructure and broader management team in place to capitalise on increased demand
26Capital Limited Investment Proposition
Tier 1 Mine-site based clients • Stable and predictable revenue streams
• Diversity of services across the cycle, coupled with extension into complementary ancillary services, provides increased
Business Diversification
revenue security
Targeted Growth • Focus on high-growth West African region, with geographic concentration to drive margins
Excellence in Execution • Best-in-class project execution, fleet quality and management
Robust Balance Sheet • Capacity to fund growth initiatives and dividend payments
Exploration Fleet Capacity • Idle rig capacity provides growth upside
Executing on Strategic Priorities • Establishment of Capital Mining Services to deliver significant growth opportunities
Shareholder Returns • Focus on shareholder returns through growth, investments and dividend payments (since 2014)
27Appendices
Our Brand Portfolio
         Capital Drilling provides a complete range of drilling solutions for projects across the mining cycle from exploration to production

         Capital Mining provides complete Load and Haul services for clients from development to fully operational mine sites

         MSALABS are a global provider of geochemical laboratory services for the exploration and mining industries

         Mine Site Maintenance (MSM) provide a broad range of maintenance services across Africa

         Well Force International provides a complete rig site solution including equipment rental, on-site surveying and geophysical logging services,
         and HiTT, a unique software solution for borehole management

                                                                                                                                                     29
Revenue Metrics
UTILISATION vs ARPOR REVENUE
65% 220 US$m
210 70.00
198 200
60% 57%
56% 56% 56%
200 65.10
189 188 60.00
62.30 61.50
55% 52% 190 60.00
177 57.11
ARPOR (US$'000)
175 191 49% 50.00 54.48 54.80
Utilisation (%)
189 180 51.60
50% 170 170
46% 183
49% 170 40.00
41.70
45% 39.00 39.70
160 30.00
40%
40% 150
35% 20.00
34% 140
35%
130 10.00
30% 120 0.00
H1 15 H2 15 H1 16 H2 16 H1 17 H2 17 H1 18 H2 18 H1 19 H2 19 H1 20 H1 15 H2 15 H1 16 H2 16 H1 17 H2 17 H1 18 H2 18 H1 19 H2 19 H1 20
COMMENTS
• Improvement in utilisation with increased assets at a number of existing
operations
• Increased fleet utilisation of 57%, up 9.6% on H1 2019
• Stable ARPOR driven by strong performance at core long-term contracts
30Expansion into West Africa
AFRICAN EXPLORATION BUDGETS BY COUNTRY, 2019 Increased Rig Count
Rig count in region tripled in two years from 13 rigs at December
256 companies budgeting
US$1.1 billion 2017 to 42 rigs (42% of total fleet) in West Africa by end Q2 2020
2%
2%
Egypt Established Infrastructure
Offices, warehouses, workshops and accommodation in Bamako
Mauritania (Mali), Yamoussoukro (Côte d’Ivoire) and Nouakchott
Mali Niger (Mauritania)
Senegal 1%
Burkina Sudan
Faso
Guinea
Ghana
Nigeria
Côte
d’Ivoire
1%
Ethiopia
Increased Revenue Contribution
West African revenues represent 31% of Group revenue in H1
2020
West Africa spent an 15%
aggregate of 45% 1% Democratic Republic
of the Congo
5%
Tanzania
3%
Multiple Contract Wins
1%
Angola 3% Malawi • Altus Strategies: Mali • Graphex Mining: Mali
Zambia • Arrow Minerals: Burkina Faso • Hummingbird Resources: Mali
1% • Awale Resources: Côte d’Ivoire • Resolute: Mali
Namibia Madagascar
3%
4% Botswana 1%
Key Business Positions Employed
9%
South Africa Increased depth with new employee recruitment in exploration,
Date as of Mar 07, 2020
Source: S&P Global Market Intelligence finance and laboratories
WEST AFRICA REPRESENTS THE LARGEST REGIONAL OPPORTUNITY 31Compelling Growth Opportunities in West Africa
STRONG EQUITY MARKET SUPPORT 2nd TOP GOLD PRODUCING REGION
$4.7 B raised for West African projects 10.8Moz production in 2019 (Estimated)
Financing for Gold Companies ($B) National Gold Production (Estimate) (Moz)
2009 – 2019 2019
14
12 10.5 12.2
12 10.8 10.4
10 9.8
10
8 6.6 8 6.7 6.3
6 4.7 6 4.5
3.9 4.4 3.6 3.5
4 4
1.6 1.4 1.4 1.3
2 1.1 1.1 1 2
0 0
Canada Australia West USA Mexico Ghana Indonesia Brazil Burkina Colombia Romania China West Australia Russia USA Canada Peru Ghana Mexico South
Africa Faso Africa Africa
SIGNIFICANT EXPLORATION ACTIVITY GREATEST EXPLORATION SUCCESS
Region features strongly in 2019 exploration budgets #1 global region for successful discoveries
2019 Exploration Budget (Gold) Gold Discoveries (Moz)
1,200 2008 - 2018
992.7
1,000 45 41
852.8 40 32
800 733.2 35 27
30
US$ million
23
25 20 19
557.4 16
600 20 12
461.8 15 11 11 11 9 9 8 6
376.9 10
400 5
0
164.2 154.1
Chile
Peru
China
Colombia
South Africa
USA
Mali
Australia
Ecuador
Ghana
Mexico
Russia
Canada
Burkina Faso
West Africa
200
0
Latin America Australia Canada Rest of World West Africa USA Pacific/SE Asia Rest of Africa
Source: S&P Global Market Intelligence
32Client History Armenia Chile
Antofagasta Anvil
DRC
APM
Ethiopia
Lydian
Barrick Tiger BHP Billiton
BHP Ethiopia Potash
CMP
Glencore
MMG
Polar Star
Egypt
Eritrea Ghana Kenya Mozambique
Andiamo Kinross Acacia Boabab
Mali Mauritania Riversdale
Chalice Gold
Sunridge Rio Tinto
Aton Resourcs
Gippsland
Thani Dubai (AngloGold Ashanti) Pakistan Peru PNG
Thani Stratex Resources
Aura Energy Antofagasta BHP Allied Gold
OreCorp Barrick Gold Barrick Gold
Redblack Oil Search
Knight Piesold Santa Barbara
MRL
Saudi Arabia
Burkina Faso Serbia Zambia
Dundee Albidon
Nevsun Barrick Gold
Resources Equinox
First Quantum
MMG
Omega
Côte d'Ivoire Tanzania
Cradle
Namibia
Glencore
Graphex
IMX
Current Active Locations Liontown
Magnis
Regional Offices (Inc Yards and Warehouses) Mantra
MMG
Previous Registered Offices and Operations Botswana Rift Valley
Strandline Resources
Tanga Resources
Alecto Minerals
Khoemacau Copper Mining
33Board of Directors
EXECUTIVE
Jamie Boyton • Over 20 years’ experience in finance industry Brian Rudd • Over 30 years’ experience in the mining industry in Africa and
Executive Chairman • Co-founder of Capital Limited (previously Capital Drilling) Executive Director Australia
• Previously Executive Director and Head of Asian Equity Syndication • Co-founder of Capital Limited (previously Capital Drilling)
and Corporate Broking at Macquarie Bank (HK) • Previous experience includes 6 years as operations/general
manager for Stanley Mining Services Tanzania (Layne
Christensen)
NON-EXECUTIVE
David Abery • Over 20 years experience in Alex Davidson • Over 35 years experience in Michael Rawlinson • Over 20 years investment
Senior NED financial, commercial and mining banking experience with both
strategic matters in African and
NED NED
• 16 years at Barrick Gold; private and public companies
UK corporate environments Executive VP of Exploration • Senior NED at Hochschild
• Ex Finance Director of Petra and Corporate Development Mining, and NED at Adriatic
Diamonds, Tradepoint Financial • Ex NED for Highland Gold, Metals
Networks (subsequently Virt-X) now Namakwa Diamonds & • Ex Director of Liberum Capital
(AIM) and Mission Testing plc NED of Yamana Gold and Talvivaara Mining
(AIM) • Previously Global Co-Head of
Mining and Metals with
Barclays
EXTENSIVE INDUSTRY EXPERIENCE, SOLID COMPLEMENT OF SKILLS
34Corporate Snapshot
CAPITAL STRUCTURE SHAREHOLDING BLOCKS
Fully paid ordinary shares 136,980,903
Share price (as at 30 June 2020) $0.78
Top 10 Institutionals
47.3%
Market capitalisation (undiluted)^ $106.30
Other Founders
14.79%
Cash (as at 30 June 2020) $15.50
Debt (as at 30 June 2020)* includes bank borrowings & O/D $15.60
Enterprise Value $106.40 Other
Directors 11.1%
^ Share options and unvested share grants issued 7.0 million 26.72%
* RCF $12.1m, October 2020. LIBOR +5.75% and Asset financing of $3.5 million
NET ASSET VALUE PER SHARE vs SHARE PRICE DIRECTORS AND SENIOR MANAGEMENT
Jamie Boyton Executive Chairman
NAV per share Share Price in US$
1.80 Brian Rudd Executive Director
1.60 David Abery Senior Independent Non-Executive Director
Alex Davidson Independent Non-Executive Director
1.40
Michael Rawlinson Independent Non-Executive Director
1.20
1.00
André Koekemoer Chief Financial Officer
0.80 0.71 0.68 0.69 0.72
0.66 0.69 0.67 Jodie North Chief Operating Officer
0.63 0.63
0.59 0.57 0.54 0.57 0.58
0.55 0.52 0.52
0.60 0.50 0.50 0.52 0.52 Stuart Thomson Chief Executive Officer, MSALABS
0.40 Jeffery Court Chief Development Officer, Mining
0.20 David Payne Executive, Commercial
0.00 Tony Woolfe Executive, Assets
H1 10 H2 10 H1 11 H2 11 H1 12 H2 12 H1 13 H2 13 H1 14 H2 14 H1 15 H2 15 H1 16 H2 16 H1 17 H2 17 H1 18 H2 18 H1 19 H2 19 H1 20
Rick Robson Executive, Corporate Development
35Capital Limited and Competitors
Perf.
Mkt. Cap. Cash Debt Net Cash Ent. Val. EBITDA (US$m) EV / EBITDA (x) P / Book Div. Yield
Company (12M)
(US$m) (US$m) (US$m) (US$m) (US$m) 2019a 2020e 2021e 2019a 2020e 2021e (x) (%) (%)
Boart Longyear 23.7 20.2 784.3 (764.1) 787.7 87.3 135.2 - 9.0x 5.8x - n/a - (82.1%)
Foraco International 35.2 16.4 147.7 (131.2) 166.4 28.0 - - 5.9x - - 0.8x - 35.8%
Geodrill 65.7 11.0 4.3 6.7 59.0 19.6 19.7 22.6 3.0x 3.0x 2.6x 0.7x - 12.0%
Major Drilling Group 377.9 43.6 37.5 6.1 371.8 36.1 42.7 52.5 10.3x 8.7x 7.1x 0.9x - 28.7%
Mitchell Services 84.4 13.9 33.3 (19.4) 103.8 24.5 32.4 34.8 4.2x 3.2x 3.0x 2.7x - (1.7%)
Orbit Garant Drilling 26.5 1.9 43.5 (41.5) 68.0 10.1 7.8 12.7 6.7x 8.7x 5.3x 0.5x - 5.6%
Swick Mining Services 49.4 7.8 18.2 (10.4) 59.8 17.3 19.5 - 3.5x 3.1x - 0.6x 4.3% (9.8%)
Maca Limited 185.6 40.2 96.3 (56.1) 241.7 47.9 80.5 79.7 5.0x 3.0x 3.0x 0.7x 5.2% 7.2%
Macmahon 421.0 76.3 111.7 (35.4) 456.4 122.2 166.1 176.6 3.7x 2.7x 2.6x 0.9x 1.7% 69.7%
NRW Holdings 627.8 44.0 68.0 (24.0) 651.8 98.0 174.0 197.0 6.7x 3.7x 3.3x 3.2x 2.4% (3.8%)
Perenti 561.4 223.5 757.4 (533.9) 1,095.3 233.0 301.0 311.0 4.7x 3.6x 3.5x 0.9x 3.8% (37.7%)
Mean 5.6x 4.6x 3.8x 1.2x - -
Capital Limited 130.7 17.6 13.2 4.4 126.3 26.9 30.1 34.6 4.7x 4.2x 3.7x 1.4x 1.7% 29.7%
Footnote:
• The share price data is as of 19 August 2020 and sourced from FactSet. Other data sourced from Factset (fiscal years) and most recent company financial reports
• The CAPD yield is calculated using the second interim dividend of 0.7c for the year to 31 December 2019 and the interim dividend of 0.9c for the six months to 30 June 2020, translated at a GBP:USD exchange rate of 1.33 prevailing on 19 August 2020.
PRN-AU BLY-AU FAR-CA GEO-CA MDI-CA MSV-AU OGD-CA SWK-AU CAPD-GB MLD-AU NWH-AU MAH-AU
100%
80%
MAH-AU, 69.7%
60%
FAR-CA, 35.8%
40% CAPD-GB, 29.7%
MDI-CA, 28.7%
20% GEO-CA, 12.0%
OGD-CA, 5.6%
0% MLD-AU, 7.2%
MSV-AU, -1.7%
-20%
NRW-AU, -3.8%
-40% SWK-AU, -9.8%
-60% PRN-AU, -37.7%
-80% BLY-AU, -82.1%
-100%
Aug-19 Sep-19 Oct-19 Nov-19 Dec-19 Jan-20 Feb-20 Mar-20 Apr-20 May-20 Jun-20 Jul-20
36Glossary
The words below used in the presentation have the following meaning:
ARPOR Average Revenue Per Operating Rig LTM Last Twelve Months
CAPEX Cash used on acquisition of property plant and equipment less Profit or loss after tax adjusted for non-cash items +/- the net
(Capital Expenditure) proceeds on disposals of property plant and equipment Operating Cash flow
change in working capital
Earnings (Loss) Before Interest and Taxes [Equal to profit (loss) from
EBIT Operating Cash flow Margin Cash generated from operations / Sales
operations per the financial statements]
Earnings (Loss) Before Interest, Taxes, Depreciation, Amortisation and
EBITDA Net Asset Value Per Share (Cents) Total equity/ Weighted average number of ordinary shares
Fair Value Gain (Loss)
EPS Earnings (Loss) Per Share Net Cash (Debt) Cash and cash equivalents less short term and long term debt
Enterprise value Market capitalisation + Debt - Cash NPAT Net profit (loss) after tax per the financial statements
Operating cash flow minus capital expenditures before financing
Free Cash Flow (Headline) Revenue Average fleet size x Utilisation x ARPOR
activities (Dividends, Loan repayments/drawdowns)
Group, Company Capital Limited and its subsidiaries Return on Capital Employed (ROCE %) LTM EBIT / Total Assets – Current Liabilities
KPI Key Performance Indicator Return on Invested Capital (ROIC) LTM EBIT / Invested Capital
HSSE Health, Safety, Social and Environment Return on Total Assets (ROTA %) LTM EBIT / Total Assets
LTI Loss Time Injury Total assets Current assets plus non-current assets
37Company Contact Details
CAPITAL LIMITED UK BROKERS UK PUBLIC RELATIONS
Jamie Boyton Berenberg (Joh. Berenberg, Gossler & Co. KG) Buchanan
Executive Chairman 60 Threadneedle Street, London EC2R 8HP 107 Cheapside, London EC2V 6DN
Telephone: +44 20 3207 7800 Telephone: + 44 20 7466 5000
André Koekemoer Matthew Armitt Bobby Morse
Chief Financial Officer matthew.armitt@berenberg.com capital@buchanan.uk.com
Mauritius Tamesis Partners LLP
9th Floor, The CORE 125 Old Broad Street, London EC2N 1 AR
Ébène CyberCity Telephone: +44 20 3882 2868
Mauritius Richard Greenfield
Telephone: +230 464 3250 rgreenfield@tamesispartners.com
www.capdrill.com
38You can also read