H1   Next Games Corporation
     January-June 2020
←
→
Page content transcription
If your browser does not render page correctly, please read the page content below

H1 Next Games Corporation
January-June 2020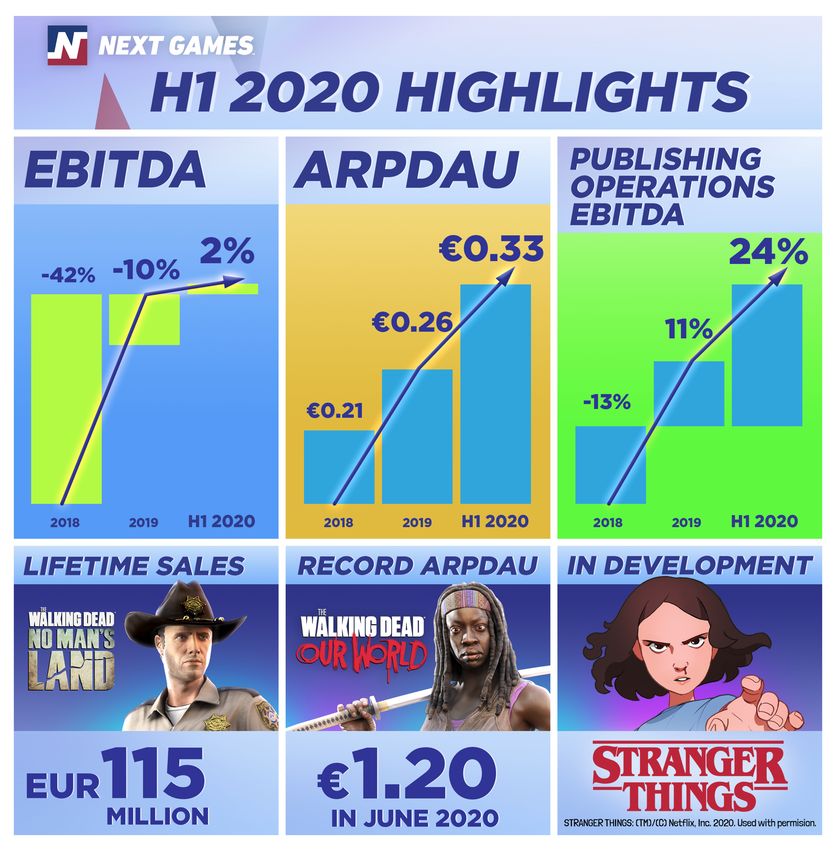
NEXT GAMES CORPORATION HALF-YEAR REVIEW JANUARY-JUNE 2020                                          UNAUDITED

Next Games Corporation Half-Year Review January-June 2020 -
Publishing Profitability Doubled, Turning Company EBITDA
Positive

January-June 2020 in Short
The company has transitioned to reporting financial figures in millions of euros.

•   Revenue was EUR 14.4 (19.2) million
•   Gross profit was EUR 7.5 million, 52% of revenue (EUR 11.3 million; 59%)
•   EBITDA was EUR 0.3 (-1.5) million
•   EBIT was EUR -1.6 (-3.5) million
•   Adjusted Operating Profit was EUR 0.1 (-1.8) million
•   Publishing Operations EBITDA was EUR 3.4 (2.3) million, 24% of revenue (12%)
•   Product development costs were EUR 2.6 (3.3) million, 18% (21%) of revenue
•   At the end of the reporting period, the company had 108 (108) employees
•   Cash flow from operating activities turned positive and was EUR 1.3 (-0.7) million, and cash
    and cash equivalents at the end of the period were EUR 6.5 (4.7) million

(Numbers in brackets refer to the corresponding year-on-year period, unless otherwise mentioned)
NEXT GAMES CORPORATION HALF-YEAR REVIEW JANUARY-JUNE 2020                             UNAUDITED

Chief Executive Officer Teemu Huuhtanen: Significant Profitability
Improvements Puts Us in a Good Position to Release New Games
The first half of 2020 was strong for Next Games. Our strategy to develop licensed games
is working. Our business turned profitable due to the operational profitability of The Walking
Dead games, and a cost level that remained at our target level.

We were able to significantly improve the company’s profitability and our Publishing
Operations achieved a significant milestone by reaching an EBITDA level of 24 per cent (12%)
amounting to EUR 3.4 (2.3) million. This achievement is already a strong indication of the
relative profitability the company is capable of, and we believe that there are still additional
opportunities to improve profitability in the longer term.

Continuing our significant investments into product development is still reflected in the
company’s profitability profile: product development costs amounted to EUR 2.6. million
(18% of revenue) during the reporting period, as many as 52 per cent of employees worked
on new products. Thus, we can be extremely proud of the company’s EBITDA of EUR 0.3
million. This increased profitability was also reflected in cash flow from operating activities,
which turned positive and was EUR 1.3 (-0.7) million. We believe that our investment in
product development is worthwhile in the long run. Although our operating result (EBIT)
was still negative due to the effect of depreciations relating to previous investments made
into technology and our common infrastructure, it also improved significantly by EUR 1.9
million to EUR -1.6 (-3.5) million.

Revenue during the first half of the year, EUR 14.4 million, was in line with our expectations.
We aim to increase revenues through our new products and the company is now in an
excellent position to stack revenue whilst continuing to invest heavily in new product
development. Development of the Strange Things mobile game has proceeded as planned
during the first half of 2020. The game’s concept has been tested, and with the addition of
the latest features preliminary results are promising. We are planning to start bringing the
game to the market and scaling in stages starting Q4 2020.

A key reason for the turnaround in profitability is our licensed games strategy: the appeal of
well-known brands brings a strong organic uplift of players to our games. This free portion of
players lowers our total user acquisition costs. Our advanced analytics enables us to
continuously evaluate the organic user flow and to optimize the total cost of game-specific
user acquisition. This is reflected in the improved profitability of our live games. Continued
focus on development has resulted in the ARPDAU (Average per Daily Active User) of our
“The Walking Dead” games to rise steadily from last year's first quarter average €0.24 to
€0.33.

I’m extremely proud of our achievements during the first half of this year. I want to thank all
the Next Games employees for their incredible work during the first months of 2020, despite
the challenges presented by the COVID-19-pandemic. Even during exceptional
circumstances, we were able to continue to operate our business almost normally and the
development of our games proceeded as planned.

The achievements of the first half, combined with a well-functioning licensed game strategy
and a strong product development pipeline, give us a good position to further develop our
business during the second half of this year, and achieve our outlook for the full year.
NEXT GAMES CORPORATION HALF-YEAR REVIEW JANUARY-JUNE 2020                                     UNAUDITED

Key Figures

                                               Jan-Jun       Jan-Jun                          Jan-Dec
EUR million                                       2020          2019          Change             2019

Company
Revenue                                           14.4             19.2           -25%            34.7
Gross Profit                                        7.5             11.3          -33%            19.7
EBITDA                                             0.3              -1.5           123%            -3.5
Operating Result (EBIT)                            -1.6            -3.5             54%           -7.4
Adjusted Operating Result                           0.1            -1.8           104%            -4.0

Gross profit %                                    52%               59%            7ppt            57%
EBITDA %                                           2%               -8%           10ppt           -10%
Operating Result (EBIT) %                         -11%             -18%            7ppt           -21%
Adjusted Operating Result %                         1%              -9%           10ppt            -11%

Publishing Operations' Profitability
EBITDA                                             3.4              2.3            49%             3.8
EBITDA %                                          24%              12%            12ppt            11%

Research and Development Key Figures
Investments                                        1.7              1.4             21%            2.4
Expenditure                                        3.3              4.0            -17%            7.6

Calculation and Reconciliation of Key figures for Publishing Operations Profitability and
Research and Development can be found in subsequent sections “Publishing Operations” and
“Product Development”

Key Figures per Quarter
                                 Jan-Mar Jan-Mar                    Apr-Jun Apr-Jun
EUR million                         2020    2019 Change               2020     2019            Change
Revenue                               7.3     9.8  -25%                  7.1     9.4             -25%
Gross Profit                            3.8          5.6   -33%             3.8        5.7       -34%
EBITDA                                 -0.2         -1.4    88%             0.5       -0.1       603%
Operating Result (EBIT)                 -1.2       -2.4     52%            -0.5        -1.1       57%
Adjusted Operating Profit              -0.3        -1.3     78%            0.4       -0.5         172%

Gross profit %                         52%         57%      5ppt           53%       60%          7ppt
EBITDA %                               -2%        -14%     12ppt            7%        -1%         8ppt
Operating Result (EBIT) %              -16%       -24%     8ppt            -7%       -12%         5ppt
Adjusted Operating Result %             -4%        -13%    9ppt             5%        -5%        10ppt
NEXT GAMES CORPORATION HALF-YEAR REVIEW JANUARY-JUNE 2020                           UNAUDITED

New Outlook for 2020

The Company expects revenues from already published games (The Walking Dead titles) to
continue on a flat or declining trend. With recent profitability improvements, the company
believes its publishing operations EBITDA from already published games (The Walking Dead
titles) to improve clearly in 2020 compared to 2019 when it was EUR 3.8 million. We also
expect to start scaling 1-2 games during 2020.

Previous Outlook (given on 28 February)

In 2020, Next Games expects to achieve moderate revenue growth. The potential growth will
be weighed towards the end of 2020. The company believes its publishing operations
EBITDA will continue to be profitable. The company expects the revenues from already
published games to continue on a flat or declining trend.

Basis for Change in Outlook 2020

The games industry continues to change, leading to relevant industry adaptation. The
company believes that under current market conditions, games are no longer launched in a
binary manner, they are scaled and grown over time. The speed of scaling games is
dependent on multiple factors. As a result, the Company has decided to remove its full year
2020 revenue guidance. The company intends to evaluate its guidance during the latter part
of the year, when a reasonably reliable estimate of full-year revenue can be given.

Audiocast and Phone Conference

We will hold an audiocast and a phone conference in English. Next Games’ H1 2020 review
will be presented by CEO Teemu Huuhtanen and CFO Annina Salvén.

The English audiocast starts on 28 August 2020 at 11.00 a.m. EEST. You can join by using the
following link: https://nextgames.videosync.fi/2020-h1 or by phone.

Phone conference details:

Dial in by calling your location’s phone number a couple of minutes before the start.
Confirmation code: 53717613#

Finland: +358 981 710 310
Sweden: +46 856 642 651
United Kingdom: +44 333 300 0804
United States: +1 855 85 70686

Next Games in short

Next Games (Helsinki Nasdaq First North: NXTGMS) is the first publicly listed mobile game
developer and publisher in Finland, specializing in games based on entertainment
franchises, such as movies, TV series or books. The developers of the critically acclaimed The
Walking Dead games redefines the way franchise entertainment transforms into highly
engaging service-based mobile games. Currently, Next Games is working on multiple new
games based on popular entertainment franchises including, Blade Runner Nexus, for the
popular Blade Runner franchise and a mobile game based on Netflix’s Stranger Things. For
more information head to www.nextgames.com
NEXT GAMES CORPORATION HALF-YEAR REVIEW JANUARY-JUNE 2020                           UNAUDITED

Next Games Corporation Financial Review January-June 2020

Market Overview

The global games market is projected to reach $159.3 billion in revenue this year and the
games industry is now estimated to be larger than the film and music industries combined.
By 2023, revenue is estimated at $200 billion and the total number of players are estimated
to exceed three billion at an annual growth rate (CAGR) of 5.6 per cent. Engagement and
revenue for all game segments increased as a result of COVID-19 measures, but the largest
increase was seen in mobile games. Mobile games are estimated to generate a total of
$77.2 billion in 2020, up 13.3% from a year ago.

The growth of the gaming industry is driven by increased spending as more and more
players are willing to spend money on games. The gaming market is moving away from the
revenue generated by physical distribution, and free-to-play is the dominant earning model
in mobile and computer games. One of the biggest trends is brand loyalty: people commit
to well-known brands and their importance in the gaming experience grows as consumers
have more and more options with increasing supply.

(Source: @Newzoo 2020 Global Games Market Report)

The biggest news on the market in the spring of 2020 was Apple’s decision to restrict
sharing of IDFA data in connection with its new iOS14 update. IDFA is user-specific
information that enables advertising services, such as Facebook, to allow advertisers to
precisely target ads. Disabling or restricting IDFA would prevent advertisers, such as
gaming companies, from targeting user acquisition as precisely as before. This modification
has prompted concerns in the market about the future profitability of advertising. Next
Games sees this change as positive from the end user’s perspective as it restricts the
monopoly of current advertising services.

Possible restrictions on targeted advertising are typical in the mobile games market and
changes in advertising, and thus user acquisition, are constant. It is undoubtedly easier for
companies such as Next Games to meet these challenges due to our licensed games
strategy. The company already has an existing audience, target group, and effective ways to
reach fans and players through a variety of channels and methods. The company believes
that any restrictions on advertising will increasingly reinforce the importance of existing
gaming and fan communities. As a result of the IDFA change, the company expects Google,
Facebook and other advertisers to possibly implement major changes in the future. While
the full impact of the IDFA change is still difficult to predict, Next Games believes its
marketing strategy will work well in the future.
NEXT GAMES CORPORATION HALF-YEAR REVIEW JANUARY-JUNE 2020                                          UNAUDITED

Revenue and Earnings Development

Next Games Revenues were EUR 14.4 (19.2) million during the reporting period. Despite a
decline of 25%, the company achieved major improvements in profitability.

EBITDA improved EUR 1.8 million and was 0.3 (-1.5), Operating Profit (EBIT) improved EUR
1.9 million and was -1.6 (-3.5) million. Improvements were achieved by the higher profitability
of the Company’s publishing operations, while keeping a stable cost structure.

Loss for the period amounted to EUR -1.8 (-4.0) million. Financial income and expenses
were EUR -0.2 (-0.2) million and the share of losses of associated companies was EUR -0.1 (-
0.1) million. Taxes for the period were EUR 0.1 (-0.3) million, due to changes in deferred taxes.
Earnings per share were EUR -0.06 (-0.22).

(Numbers in brackets refer to the corresponding year-on-year period, unless otherwise mentioned)

Cash Flow, Financing and Balance Sheet

The Company’s Balance Sheet strengthened during the reporting period and was EUR 33.1
(32.5) million as at 30 June 2020 Cash and Cash Equivalents increased EUR 1.8 million and
were 6.5 (4.7) million. During the reporting period the company had access to a EUR 3.0
million credit line which was fully unused at the end of the reporting period. Renewal terms
for the credit line are being negotiated.

Net cash flow from operating activities turned positive and was EUR 1.3 (-0.7) million. In
addition to significant improvements in the financial result, cash flow from operating
activities was positively influenced by overall improved working capital and extended
payment periods.

Next Games continued investing in R&D. During the reporting period cash flow from
investing activities were EUR -1.7 (-1.4) million. The majority of investing activities related to
game development.

Cash flow from financing activities was EUR -0.7 (-0.6) million consisting of the Company’s
IFRS 16 leasing payments.

(Numbers in brackets refer to the corresponding year-on-year period, unless otherwise mentioned)
NEXT GAMES CORPORATION HALF-YEAR REVIEW JANUARY-JUNE 2020                                           UNAUDITED

Publishing Operations

Next Games publishing operations include revenues and expenses directly attributable to
its published games, in addition to an allocated share of the company's general expenses
proportionate to the number of employees working on published games.

Publishing activities represent the profitability of the company's business, without the costs
associated with the product development of unpublished games. The company has
focused on improving the profitability of its publishing operations, as is evident by the
significant improvement in the company's profitability in the first half of the year. Effective
leverage of our licensed game strategy brings a strong organic user flow to the games,
which allows us to attract players with lower user acquisition costs. During the reporting
period, Publishing Operations EBITDA was EUR 3.4 (2.3) million, 24% (12%).

At the end of the reporting period 12% of the employees worked on The Walking Dead: No
Man's Land (14%), 23% on The Walking Dead: Our World (24%).

Definition and calculations of Publishing Operations profitability can be found in section
“Definitions and Calculations of Alternative Performance Measurements and Key Financial
Figures”

Publishing Operations Profitability

                                                Jan-Jun       Jul-Dec     Jan-Jun       Jul-Dec      Jan-Dec
EUR million                                        2020          2019        2019          2018         2018
Revenue                                             14.4           15.5       19.2          24.8         10.5
Gross Profit                                         7.5            8.4        11.3          15.3         6.0
Other Operating Income                                0.1           0.0        0.0           0.0          0.0
Sales and Marketing costs                           -5.0           -7.8       -9.8          -21.2        -5.6
Publishing Operations EBIT                           2.6            0.7        1.4          -6.0          0.5
Publishing Operations Depreciations                  0.8            0.8        0.8            1.0         0.1
Publishing Operations EBITDA                         3.4            1.5        2.3          -5.0          0.5
EBITDA %                                            24%           10 %        12%         -20 %          5%

Combined Key Operational Metrics of Published Games

                      Apr-Jun                Jan-Mar        Oct-Dec        Jul-Dec     Apr-Jun        Jan-Mar
                         2020                    2020            2019          2019        2019           2019
Gross Bookings (MEUR)       6.9                    7.3             8.2           7.9          9.0           9.5
DAU                    232,092                250,539         303,847      295,509     349,993         441,735
MAU                    725,082                 810,815      1,267,688     1,013,796    1,161,302     1,670,936
ARPDAU (USD)              0.37                    0.36           0.33          0.29         0.30          0.27
ARPDAU (EUR)              0.33                    0.32           0.29          0.27         0.29          0.24

(This table includes figures from Compass Point: WEST)
NEXT GAMES CORPORATION HALF-YEAR REVIEW JANUARY-JUNE 2020 UNAUDITED
The Walking Dead: No Man’s Land
The Walking Dead: No Man’s Land game performed steadily during the COVID-19 impacted
first half of the year. Due to improved analytics and live operations, we were able to offer
players better-designed and targeted campaigns and events which resulted in improved
ARPDAU. This development can be directly seen in the improved result of the game. In
particular, a new update to the game with playable content and characters from the tv-
show’s first and second seasons, was received extremely positively among the players. No
Man’s Land achieved EUR 115 million in lifetime gross bookings since its launch in October
2015.
Apr-Jun Jan-Mar Oct-Dec Jul-Dec Apr-Jun Jan-Mar
TWD: No Man's Land 2020 2020 2019 2019 2019 2019
Gross Bookings (MEUR) 4.0 3.9 4.2 3.4 3.8 4.5
DAU 157,645 162,145 183,087 162,940 189,852 225,048
MAU 463,028 482,730 651,104 479,144 539,948 669,181
ARPDAU (USD) 0.31 0.30 0.27 0.23 0.24 0.25
ARPDAU (EUR) 0.28 0.27 0.25 0.21 0.22 0.22
The Walking Dead: Our World
COVID-19 restrictions on movement had an effect on the capability of playing safely
location-based games. This in turn had an effect on the user amounts of The Walking Dead:
Our World during the first half of 2020. However, new updates and functionalities were
quickly introduced to the game, such as story-driven missions and Free Roam (movement
on the map without physically moving) making it easier and safer to play during
restrictions. Despite the decline in users, the game’s ARPDAU development continued
strong which is an essential step in sustainably improving the product’s profitability and
achieving steady revenue. In June, Our World achieved another daily ARPDAU record of
€1.20.
Apr-Jun Jan-Mar Oct-Dec Jul-Dec Apr-Jun Jan-Mar
TWD: Our World 2020 2020 2019 2019 2019 2019
Gross Bookings (MEUR) 2.9 3.4 3.9 4.5 4.8 5.0
DAU 70,093 83,362 114,367 127,078 154,936 210,693
MAU 246,170 309,333 591,469 528,751 602,486 982,345
ARPDAU (USD) 0.51 0.50 0.40 0.40 0.37 0.29
ARPDAU (EUR) 0.46 0.45 0.38 0.36 0.35 0.26NEXT GAMES CORPORATION HALF-YEAR REVIEW JANUARY-JUNE 2020 UNAUDITED
Product Development
Next Games Research and Development activities consist of salaries as well as outsourced
services. In total, activities amounted to EUR 2.6 (3.3) million and were related to both game
and technology development. During the reporting period, the company capitalized in
accordance with IAS 38 EUR 1.7 (1.4) million. 52% (46%) of employees worked in R&D
developing new products.
(Numbers in brackets refer to the corresponding year-on-year period, unless otherwise mentioned)
Research and Development
Jan-Jun Jan-Jun Jan-Dec
EUR million 2020 2019 2019
Personnel expenses -2.0 -2.4 -4.3
Outsourcing -0.4 -0.3 -0.5
Share-based payments -0.1 -0.1 -0.3
General cost allocation -0.8 -1.2 -2.5
Total costs -3.3 -4.0 -7.6
Depreciations -1.0 -0.7 -1.3
Capitalization 1.7 1.4 2.4
Total -2.6 -3.3 -6.6
Percentage of revenue -18% -21% -19%
Game Development Pipeline 30 June 2020
In addition to the two published The Walking Dead games, the company had two games in
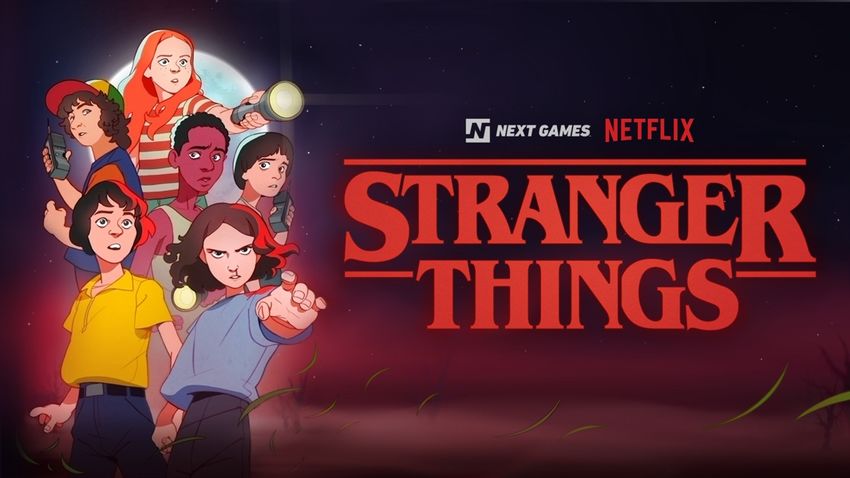
production during the reporting period: Blade Runner Rogue and a mobile game based on
the Stranger Things series. The company also has preliminary projects in the prototyping
and concepting phase and is actively discussing with several notable international license
holders about possible future projects.NEXT GAMES CORPORATION HALF-YEAR REVIEW JANUARY-JUNE 2020 UNAUDITED Products in Development Blade Runner Rogue Blade Runner Rogue (former Blade Runner Nexus) was moved back to the production phase in the end of 2019 as a new Rogue game mechanic was developed and added to the game. With the reform, the name of the game was also changed. The rest of the major updates to serve the new game mechanic are planned for this year. The game has been actively tested and updated during the reporting period in several different markets, including Canada, and the development of the game continues. Stranger Things The development of the Stranger Things mobile game has proceeded as planned during the first half of 2020. During the reporting period, the game has been available on several occasions in select markets via Google Play Early Access testing. The tests have focused on validating the overall game concept and new features with promising results. We are planning to start bringing the game to the market in stages starting in Q4 2020. The testing phase showed that the game works best without location-based elements. For this reason, the development of location-based functionalities that were previously in the game was omitted. The game will be a visual puzzle game, a better fit for the Stranger Things brand. The removal of these functionalities did not cause additional investments or delays in the game’s development. The game is a puzzle RPG that reimagines the Stranger Things universe in the style of an 80s Saturday morning cartoon and is suitable for players of different skill levels. Next Games believes that the game’s chances of success are even better now and that the game appeals to an even wider target audience with the change.
NEXT GAMES CORPORATION HALF-YEAR REVIEW JANUARY-JUNE 2020                                          UNAUDITED

Personnel and Management

At the end of the reporting period, Next Games had 108 (108) employees representing 22 (22)
nationalities. 78% (75%) of the employees are men and 22% (25%) are women. The average
number of employees at Next Games during the reporting period was 110 (119). Of the
employees, 35% (41%) worked in publishing operations, 52% (46%) in product development
and 13% (12%) in administrative positions.

At the end of the reporting period on 30 June 2020, Next Games' Management Team
consisted of the following persons: Teemu Huuhtanen (Chief Executive Officer), Annina
Salvén (Chief Financial Officer), Saara Bergström (Chief Marketing Officer), Kalle Hiitola (Chief
Technology Officer) and Joonas Viitala (Chief Operating Officer). The members of the
Management Team report to the CEO. There were no changes in the management team or
the board of directors during the reporting period.

Shares and Shareholders

On 30 June 2019, Next Games’ share capital amounted to EUR 80,000. The total number of
shares increased during the review period by a total of 62,524 (35,396) shares as new shares
were subscribed for with stock options of which 61,524 shares were subscribed for during
2019 but were registered in 2020.

During the reporting period 1,000 shares were subscribed for with stock options. These
shares have been entered into the trade register on 10 June 2020, as of which date the new
shares have carried equal shareholder rights with the company’s existing shares. The entire
subscription price of EUR 1,140 was recorded in the reserve for invested unrestricted equity,
and the company’s share capital has remained unchanged. The shares have no nominal
value. After the subscriptions, the number of Next Games Corporation’s shares increased to
27,978,748 (18,538,710) shares.

The weighted average of shares during the first half of 2020 was 27,923,438 shares. The
Company has one class of shares. Each share entitles its shareholder to one (1) vote in the
general meeting. During the reporting period the company did not redeem any treasury
shares and held as many treasury shares as in the comparison period: 13,410 (0.007%) of its
own shares.

(Numbers in brackets refer to the corresponding year-on-year period, unless otherwise mentioned)
NEXT GAMES CORPORATION HALF-YEAR REVIEW JANUARY-JUNE 2020                               UNAUDITED

Next Games Corporation Top 20 Major Shareholders

Shareholders                                                   Shares                  % of Shares
1    Ovaskainen Jari Juhani Rainer                          7,078,068                          25.3
2    IDG Ventures USA III, L.P.                              1,188,306                          4.3
3    Hiitola Kalle Johannes                                    971,675                           3.5
4    Achrén Joakim Tomas Johan                                921,698                            3.3
5    Ilmarinen Mutual Pension Insurance Company                819,336                          2.9

6    Jumisko Jaakko                                           813,246                           2.9
7    Achrén Mikael Jan Kennet                                 722,848                           2.6
8    Varma Mutual Pension Insurance Company                   570,000                           2.0

9    Danske Invest Finnish Small Cap Fund                     306,465                            1.1

10 Nuard Ventures Oy                                          286,757                            1.0
11   Vilpo Oy                                                 281,200                            1.0
12 Säästöpankki Small Cap Mutual Fund                         274,438                            1.0
13 Vaah Holdings Oy                                           266,720                            1.0
14 OP-Finland Micro Cap                                       222,784                           0.8
15 Odesangel Ab                                               197,488                           0.7
16 Huuhtanen Teemu Mikael                                      172,919                          0.6
17 Pardon Christophe                                           157,916                          0.6
18 Hollming Toni Kristian                                     144,574                           0.5
19 Big Blue Games Oy                                            116,212                         0.4
20 Vartia Arvo Arnar Antero                                     111,841                         0.4
     20 largest shareholders total                          15,624,491                         55.8
     Nominee registered                                     6,529,124                          23.3
     Other shares                                            5,825,133                         20.8
     In the joint book-entry account                          902,012                            3.2
     Total                                              27,978,748                            100.0

                                                                          Supplied by © Euroland.com
NEXT GAMES CORPORATION HALF-YEAR REVIEW JANUARY-JUNE 2020 UNAUDITED Share-based Incentive Schemes During 2019 the company had five (5) share-based incentive plans: Equity plan 2015, Equity plan 2017, Equity plan 2018, Equity plan 2019 and Equity plan 2020. The equity plans have a vesting period of minimum of 12 months and maximum of 48 months. Options are issued in several instalments and the Board of Directors define the subscription price for the shares in each equity plan, and therefore the subscription price may vary. Options can be issued to current and future employees of Next Games, external consultants and members of management of the company and its group companies. Granting of options always requires the Board of Directors’ decision. The company intends to continue granting options to all new employees at the end of their probation period as a long term incentive. The Board of Directors has issued option rights to recipients free of charge, and the subscription price for the shares is defined in each equity plan. Risks and Uncertainties Next Games is exposed to risks that may arise from the company's operations or changes in the business environment. The Company estimates that no significant changes in risks and uncertainties have occurred during the reporting period. The most important risks relating to Next Games are disclosed in the Company’s Annual Report and Notes to the Financial Statements and can be found at www.nextgames.com Resolutions passed by the Annual General Meeting and the Board of Directors of Next Games Corporation The Annual General Meeting of Next Games Corporation was held in Helsinki on 27 May 2020. The meeting approved the financial statements for the financial period ended 31 December 2019 and granted discharge from liability to all members of the board of directors and the managing director. In accordance with the proposal of the board of directors, the general meeting resolved not to distribute any dividends for the financial period ended on 31 December 2019. The general meeting decided to support the presented remuneration policy for governing bodies. At its constitutional meeting held after the general meeting, the board of directors appointed Petri Niemi as the chairman from among its members. Elina Anckar was elected as chairman and Petri Niemi as member of the audit committee. Both are independent of both the company and its significant shareholders. Petri Niemi was elected as chairman and Jari Ovaskainen as a member of the remuneration committee. Petri Niemi is independent of both the company and its significant shareholders. Jari Ovaskainen is independent of the company. The resolutions are available in their entirety at www.nextgames.com
NEXT GAMES CORPORATION HALF-YEAR REVIEW JANUARY-JUNE 2020                            UNAUDITED

Increased Management Judgement

The preparation of interim reports requires management to make decisions, estimates and
assumptions that affect the application of accounting policies and the recognized amounts
of assets, liabilities, income and expenses. Uncertainty about future developments has
increased as a result of the COVID-19 pandemic, and areas of significant discretionary
assessments include:

•   Timing of revenue recognition
•   Deferred tax assets
•   Measurement of intangible assets identified and recognized in business combinations
•   Impairment testing of goodwill
•   Capitalization of development costs
•   Share-based payment arrangements
•   Extension and termination options of lease agreements

Items requiring consideration are assessed on an ongoing basis. Estimates are based on a
number of factors, including expected future events that may have a significant business
impact on the Company. These include, for example, changing player acquisition prices in
the market, money and time players spend in our games, the ability to move outdoors, and
many other factors such as the company’s ability to complete game projects and publish
them during a pandemic. The effects of the COVID-19 pandemic have been minor in the
company's gaming business, as a result of which there have been no changes in the timing
of revenue recognition, goodwill, capitalization of the development costs or impairments.
Recognition of revenue has been impacted by seasonal player behavior which is typical
during the reporting period.

The terms of the company's lease have not changed, and as a result, there have been no
changes to the extension or cancellation options and the value of the lease liabilities has not
changed significantly.

Despite the COVID-19 pandemic, the company has been able to continue game
development as planned, as a result of which the outlook for 2020 remains unchanged. The
company has estimated that a possible second wave of the pandemic will not have a
significant impact on business.

As a result of management's assessment, the COVID-19 pandemic has not resulted in
revaluations to the company's income statement or balance sheet figures.
NEXT GAMES CORPORATION HALF-YEAR REVIEW JANUARY-JUNE 2020                                                               UNAUDITED

Significant Events After the Reporting Period

No significant events.

Upcoming Events
25 November 2020 - Capital Markets Day

Helsinki 28 August 2020

Board of Directors
Next Games Corporation

Statements are made in this report which describe, inter alia, the current beliefs and expectations of the management of Next Games
regarding the future plans and objectives concerning future activities and goals of Next Games. All such statements involve risks and
uncertainties, which may cause the achievements of Next Games to differ materially from what has been expressed or implied in such
statements.
NEXT GAMES CORPORATION HALF-YEAR REVIEW JANUARY-JUNE 2020                               UNAUDITED

Definitions and Reconciliation of Alternative Performance Measurements
and Key Financial Figures

Key Operational Metrics Defined

DAU (Daily Active Users). A user is counted as a daily active user if they sign into the game at
least once during a 24-hour period in UTC. Average DAU is calculated by adding the total
number of active players as of the end of each day in a given period and dividing by the
number of days in the period. DAU is a key measure for player network engagement.

MAU (Monthly Active Users). A user is counted as a monthly active user if they sign into the
game at least once during a 30-day period. Average MAU is calculated by adding the total
number of active players as of the end of each month in a given period and dividing by the
number of months in the period. MAU is a key measure of the overall size of the player network.

ARPDAU (Average Revenue Per Daily Active User). ARPDAU is calculated by dividing daily gross
bookings by daily active users (DAU). ARPDAU is an important measure of monetization as it
places sales in relation to player volume.

Calculation of Key Financial Ratios

Gross Bookings = A non-IFRS Financial Measure, defined as the total amount paid by our users
for virtual items in a given reporting period. It does not include deferrals, and thus it is revenue-
adjusted with the change (+/-) in deferred revenue.

Gross Profit = Revenue adjusted for (+/-) server expenses, expenses and depreciations related to
royalties and license fees, as well as platform cut.

EBITDA = Operating Profit (EBIT) adjusted with depreciations

Oikaistu liikevoitto = Liiketulos (EBIT) oikaistuna poistoilla. IFRS 16 mukaiset toimitilojen
vuokriin kohdistuvia poistoja ei oikaista liiketuloksesta. IFRS 2 osakeperusteiset maksut
oikaistaan liiketuloksesta.

Publishing Operations EBITDA = Revenues generated by the company’s published games,
adjusted by the costs and investments related to game’s maintenance, further development,
marketing, customer support, and adding back depreciation.

Publishing Operations EBIT = Revenues generated by the company’s published games,
adjusted by the costs and investments related to game’s maintenance, further development,
marketing and customer support.

Adjusted Operating Profit Operating profit (EBIT) is adjusted for depreciations except for
depreciations of premises, falling under IFRS 16 standard. In addition share based payments
under IFRS 2 are adjusted for.

Equity Ratio             Capital and reserves total
                        ------------------------------- x100
                     Total Assets – Advances Received

Earnings per share (EPS), undiluted = Profit (loss) for the financial year divided by the average
number of outstanding shares during the financial period

Earnings per share (EPS), diluted = Profit (loss) for the financial year divided by the average
number of outstanding shares during the financial period after adding the number of shares
with potential dilution effect.
NEXT GAMES CORPORATION HALF-YEAR REVIEW JANUARY-JUNE 2020 UNAUDITED
Reconciliation of Alternative Performance Measurements
EBITDA
Jan-Jun Jan-Jun Jan-Dec
EUR million 2020 2019 2019
Operating Result (EBIT) -1.6 -3.5 -7.4
Depreciations 2.0 2.0 4.0
EBITDA 0.3 -1.5 -3.5
Adjusted Operating Profit
Jan-Jun Jan-Jun Jan-Dec
EUR million 2020 2019 2019
Operating Result (EBIT) -1.6 -3.5 -7.4
IFRS 16 Depreciations -0.5 -0.5 -1.0
Depreciations 2.0 2.0 4.0
IFRS 2 adjustment 0.3 0.2 0.5
Adjusted Operating Profit 0.1 -1.8 -4.0
Profitability of Publishing Operations
Jan-Jun Jan-Jun Jan-Dec
EUR million 2020 2019 2019
Revenue 14.4 19.2 34.7
Cost of Revenue -6.8 -8.0 -15.0
Gross Profit 7.5 11.3 19.7
Other Income 0.1 0.0 0.0
Sales and Marketing costs -5.0 -9.8 -17.6
Publishing Operations EBIT 2.6 1.4 2.1
Publishing Operations Depreciations 0.8 0.8 1.7
Publishing Operations EBITDA 3.4 2.3 3.8NEXT GAMES CORPORATION HALF-YEAR REVIEW JANUARY-JUNE 2020 UNAUDITED Half Year Financial Figures Jan-Jun 2020 Next Games applies International Financial Reporting Standards (IFRS). This unaudited half- year review does not apply IAS 34 requirements for interim reports that does not concern First North companies. Basis of preparation The Consolidated Financial Statements have been prepared in accordance with International Financial Reporting Standards (IFRS) and interpretations issued by the IFRS Interpretations Committee (IFRS IC) applicable to companies reporting under IFRS as adopted by the European Union. Notes to the Consolidated Financial Statements also comply with the Finnish accounting and corporate legislation complementing the IFRS standards. The preparation of Consolidated Financial Statements requires management to make estimates and assumptions that affect the application of accounting policies and the recognized amounts of assets, liabilities, income and expenses. Areas involving significant estimates or judgements are: • Timing of revenue recognition • Deferred tax assets • Measurement of intangible assets identified and recognized in business combinations • Impairment testing of goodwill • Capitalization of development costs • Share-based payment arrangements • Extension and termination options of lease agreements These areas are explained in more detail in the individual notes. Estimates and judgements are continually evaluated. They are based on historical experience and other factors, including expectations on future events that may have a financial impact on the entity and that are believed to be reasonable under the circumstances.
NEXT GAMES CORPORATION HALF-YEAR REVIEW JANUARY-JUNE 2020                      UNAUDITED

Consolidated Statement of Comprehensive Income

                                                     Jan-Jun       Jan-Jun     Jan-Dec
EUR million                                             2020          2019        2019
Revenue                                                  14.4          19.2        34.7
Cost of revenue                                          -6.8          -8.0        -15.0
Gross Profit                                               7.5          11.3        19.7
Other Operating income                                     0.4          0.0          0.0
Research and Development                                  -2.6         -3.3         -6.6
Sales and Marketing                                       -5.0         -9.8        -17.6
Administrative                                             -1.9         -1.6        -3.0
Operating result (EBIT)                                   -1.6         -3.5         -7.4

Finance income                                               0.0        0.0          0.1
Finance costs                                               -0.2       -0.2         -0.3
Finance cost, net                                           -0.2       -0.2         -0.2

Share of associates' result                                 -0.1        -0.1        -0.2

Profit before taxes                                         -1.9       -3.7         -7.8
Current income taxes                                        0.0         -0.1         -0.1
Change in deferred tax                                       0.1       -0.2         -0.4
Total income tax expenses                                    0.1       -0.3         -0.5
Result for the period                                       -1.8       -4.0         -8.3
Total comprehensive result for the period                   -1.8       -4.0         -8.3
Result attributable to the owners of the parent             -1.8       -4.0         -8.3

Result per share for profit attributable to
the owners of the parent
Non-Diluted earnings per share, EUR                     -0.06         -0.22        -0.41
Diluted earnings per share, EUR                         -0.06         -0.22        -0.41
NEXT GAMES CORPORATION HALF-YEAR REVIEW JANUARY-JUNE 2020 UNAUDITED
Consolidated Balance Sheet
30 Jun 30 Jun 31 Dec
EUR million 2020 2019 2019
Assets
Non-current assets
Goodwill 3.3 3.3 3.3
Intangible assets 11.0 10.5 10.6
Property. plant and equipment 4.7 6.0 5.3
Shares of associates 0.1 0.3 0.2
Other long term receivables 1.1 0.4 1.1
Deferred tax assets 1.3 1.4 1.2
Total non-current assets 21.6 21.9 21.7
Current assets
Trade receivables and other receivables 5.0 5.9 5.2
Cash and cash equivalents 6.5 4.7 7.7
Total current assets 11.5 10.6 12.9
Total assets 33.1 32.5 34.6
30 Jun 30 Jun 31 Dec
EUR million 2020 2019 2019
Equity and liabilities
Equity
Share capital 0.1 0.1 0.1
Reserve for invested unrestricted equity 61.7 54.0 61.7
Retained earnings -38.6 -30.9 -30.6
Profit (loss) for the period -1.8 -4.0 -8.3
Total equity -21.3 -19.1 -22.8
Liabilities
Non-Current liabilities
Loan from public administration 0.5 0.5 0.5
Lease liabilities 2.8 3.6 3.2
Total non-current liabilities 3.3 4.2 3.7
Current liabilities
Governmental agency loan 0.1 0.2 0.2
Lease liabilities 1.0 1.0 1.0
Deferred income 2.0 1.3 1.0
Trade payables 2.1 2.2 3.7
Other liabilities 0.1 0.1 0.1
Accrued liabilities 3.0 4.4 2.2
Total current liabilities 8.5 9.2 8.1
Total liabilities 11.7 13.4 11.8
Total equity and liabilities 33.1 32.5 34.6NEXT GAMES CORPORATION HALF-YEAR REVIEW JANUARY-JUNE 2020 UNAUDITED
Consolidated Statement of Changes in Equity
Reserve for
invested
Share unrestricted Retained
EUR million capital equity earnings Total
Equity on Jan 1st 2019 0.1 53.9 -31.1 22.9
Result for the period -4.0 -4.0
Total comprehensive result for the period -4.0 -4.0
Transactions with owners:
Share issues based on stock options 0.1 0.1
Purchase of treasury shares
Share-based payments 0.2 0.2
Equity at June 30th 2019 0.1 54.0 -35.0 19.1
Reserve for
invested
Share unrestricted Retained
EUR million capital equity earnings Total
Equity on Jan 1st 2020 0.1 61.7 -38.9 22.8
Result for the period -1.8 -1.8
Total comprehensive result for the period -1.8 -1.8
Transactions with owners:
Share issues based on stock options 0.0
Purchase of treasury shares
Share-based payments 0.3 0.3
Equity at June 30th 2020 0.1 61.7 -40.4 21.3NEXT GAMES CORPORATION HALF-YEAR REVIEW JANUARY-JUNE 2020 UNAUDITED
Consolidated Statement of Cash Flows
Jan-Jun Jan-Jun Jan-Dec
EUR million 2020 2019 2019
Net cash flows from operating activities 1.3 -0.7 -3.6
Net cash flows from investing activities -1.7 -1.4 -2.7
Net cash used in financing activities -0.7 -0.6 6.6
Net decrease/increase in cash and cash
equivalents -1.1 -2.6 0.4
Cash and cash equivalents as of January 1st 7.7 7.3 7.3
Translation differences 0.0 0.0 0.1
Cash and cash equivalents as of June 30th 6.5 4.7 7.7
Related Party Transactions
Next Games’ related parties include its subsidiaries, associate and the members of the Board of
Directors, CEO, the members of the Management Team, as well as shareholders having
significant influence over the Company. Related parties also include the close family members
of these individuals and entities that are controlled or jointly controlled by a person identified as
a related party. Transactions with related parties were made on an arm’s length basis. Next
Games related party transactions include normal business transactions with license partners
(AMC). Transactions are normal in Next Games business model and are following arm’s length
principle.
Mergers and Acquisitions
There were no mergers or acquisitions during the reporting periodYou can also read