Habitat Selection by Lynx in the North Cascades
←
→
Page content transcription
If your browser does not render page correctly, please read the page content below
Habitat Selection by Lynx in the North Cascades

                         Final Report

Seattle City Light, Skagit Wildlife Research Grant Program

                     Gary M. Koehler, Ph.D.
            Washington Department of Fish and Wildlife
                               and
                     Keith B. Aubry, Ph.D.
      USDA Forest Service, Pacific Northwest Research Station

                        December 10, 2003
Winter Habitat Selection and Food Habits of Lynx on the

                    Okanogan Plateau, Washington

                      Jeff A. von Kienast

         A thesis submitted in partial fulfillment of the
                 requirements for the degree of

                       Master of Science

                   University of Washington
                             2003

Program Authorized to Offer Degree: College of Forest Resources
University of Washington
                            Graduate School

 This is to certify that I have examined this copy of a masters’ thesis by

                           Jeff A. von Kienast

    and have found that it is complete and satisfactory in all respects,
          And that any and all revisions required by the final
                Examining committee have been made.

Committee Members:

      ____________________________________________________
      Stephen D. West

      ____________________________________________________
      Keith B. Aubry

      ____________________________________________________
      James K. Agee

      Date: ________________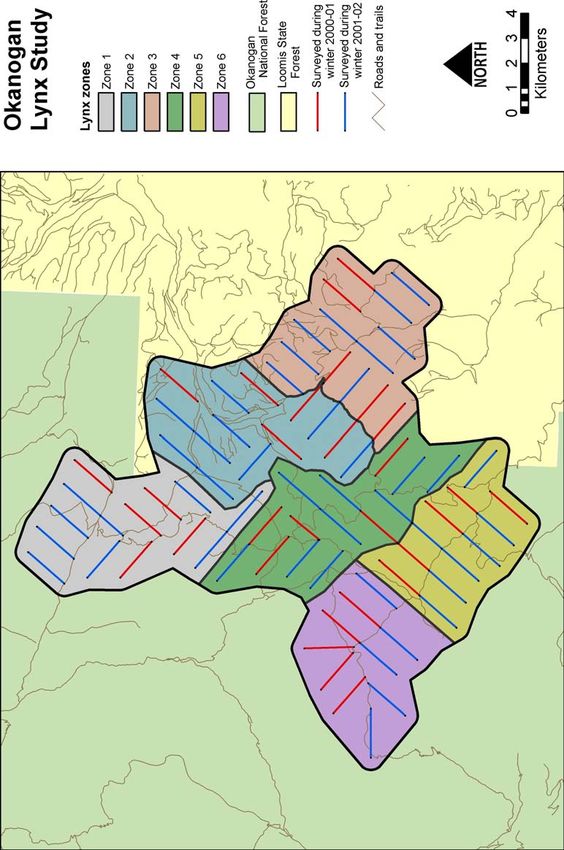
TABLE OF CONTENTS

List of Figures ..................................................................................................................... ii
List of Tables ..................................................................................................................... iii

Chapter I:            Fine-Scale Habitat Selection........................................................................1
                      Introduction..................................................................................................1
                      Study Area ...................................................................................................4
                      Methods......................................................................................................11
                              Field Methods ................................................................................11
                              Physiographic Conditions ..............................................................14
                              Forest Structure..............................................................................14
                              Relative Prey Abundance...............................................................15
                              Data Analyses ................................................................................16
                      Results ........................................................................................................18
                              Physiographic Conditions ..............................................................20
                              Forest Structure..............................................................................21
                              Relative Prey Abundance...............................................................25
                              Stepwise Logistic Regression Analyses.........................................25
                      Discussion ..................................................................................................25
                              Physiographic Conditions ..............................................................25
                              Forest Structure..............................................................................29
                              Relative Prey Abundance...............................................................32

Chapter II:           Food Habits................................................................................................34
                      Introduction................................................................................................34
                      Methods......................................................................................................36
                              Scat Analyses .................................................................................36
                              Prey Chases and Hunting Behaviors..............................................37
                      Results ........................................................................................................37
                              Scat Analyses .................................................................................37
                              Prey Chases and Hunting Behaviors..............................................38
                      Discussion ..................................................................................................42
                              Scat Analyses .................................................................................42
                              Prey Chases and Hunting Behaviors..............................................44
                              Summary and Conclusions ............................................................48

Bibliography ......................................................................................................................53

                                                                   i
LIST OF FIGURES
Number
1. Location of lynx study area on the Okanogan Plateau, Washington .............................5
2. Forest cover types on the Okanogan Plateau, Washington and point locations from
telemetry studies conducted by J.David Brittell and Gary M. Koehler .........................6
3. Land ownership and major patterns of disturbance on the Okanogan Plateau,
Washington ....................................................................................................................7
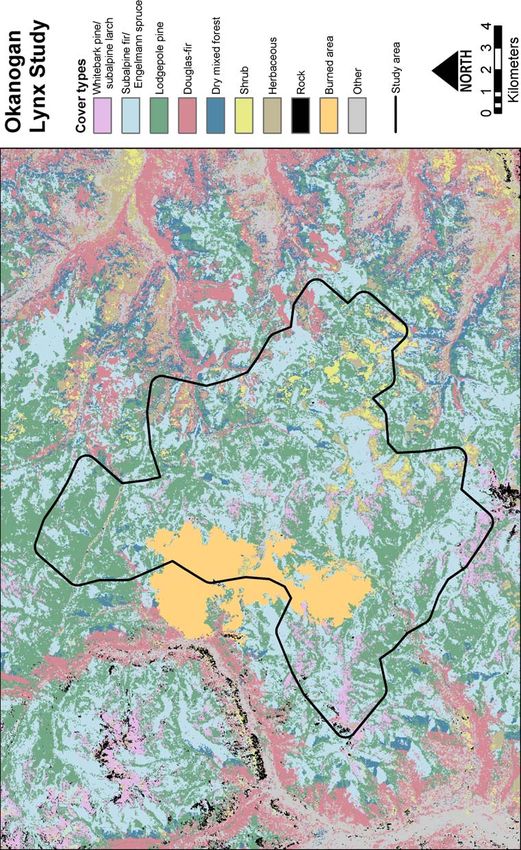
4. Forest cover types and outer boundary of lynx snowtracking study on the
Okanogan Plateau, Washington .....................................................................................8
5. Lynx zones and availability transects sampled on the Okanogan Plateau,
Washington ..................................................................................................................12
6. Lynx zones and trails sampled on the Okanogan Plateau, Washington ......................19
7. Size class and number of stems per plot on lynx trails and availability transects on
the Okanogan Plateau, Washington ..............................................................................24
ii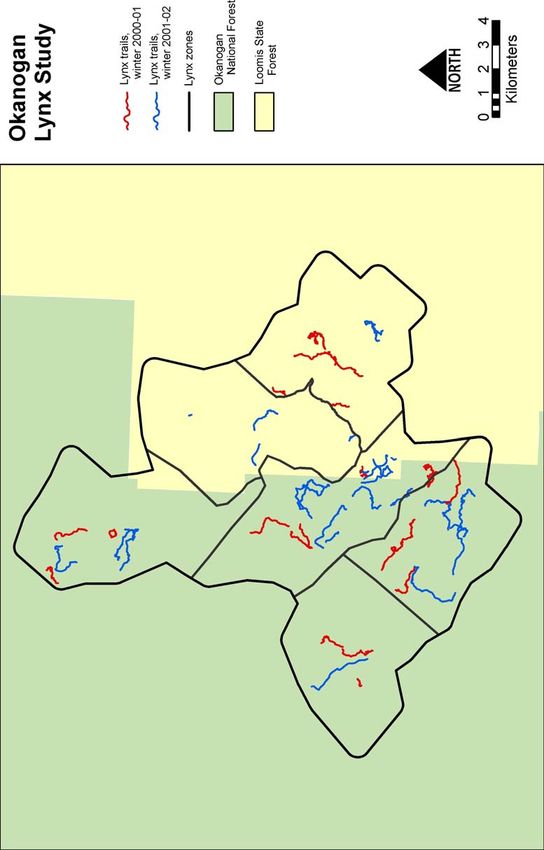
LIST OF TABLES

Number

1. Descriptive statistics for datasets used in logistic regression analyses of habitat
   selection by lynx on the Okanogan Plateau, Washington during the winters of
   2000/01 and 2001/02....................................................................................................17

2. Physiographic variables used in stepwise logistic regression analyses of habitat
   selection by lynx on the Okanogan Plateau, Washington during the winters of
   2000/01 and 2001/02....................................................................................................22

3. Forest structure variables used in stepwise logistic regression analyses of habitat
   selection by lynx on the Okanogan Plateau, Washington during the winters of
   2000/01 and 2001/02....................................................................................................23

4. Prey variables used in stepwise logistic regression analyses of habitat selection
   by lynx on the Okanogan Plateau, Washington during the winters of 2000/01
   and 2001/02..................................................................................................................26

5. Food items found in 46 lynx scats collected on the Okanogan Plateau, Washington
   during the winters of 2000/01 and 2001/02 .................................................................39

6. Results of prey chases by lynx on the Okanogan Plateau, Washington during the
   winters of 2000/01 and 2001/02 ..................................................................................40

                                                               iii
ACKNOWLEDGMENTS

       Primary funding for the first year of this study was provided by Seattle City Light.

The U.S. Fish and Wildlife Service provided the majority of funding for year 2. Michelle

Lynn, Bryon Holt, and Martha Jensen were instrumental in acquiring the funding from

their respective agencies. The U.S. Forest Service provided a great deal of support for

this study. The Okanogan National Forest provided field quarters, snowmobiles, and

training for my crew, the Rogue River National Forest provided snowmobiles and field

computers, and the Pacific Northwest Research Station provided snowmobiles and field

equipment. The Washington Department of Fish and Wildlife provided additional

funding and field equipment. I especially wish to thank Keith Aubry, Bob Naney, John

Rohrer, and Jim Goode of the U.S. Forest Service and Gary Koehler of the Washington

Department of Fish and Wildlife for all of their efforts in supporting this project. I wish

to thank my graduate committee members Stephen D. West, Keith B. Aubry, and James

K. Agee for their advice and review of this thesis. Cathy Raley provided valuable

statistical advice and answered incessant questions from me about statistical software.

Tim Max and Pat Cunningham provided statistical advice for the hierarchical logistic

regression design. Extensive GIS support was provided by Beth Galleher, Leslie Jagger,

and Rick Jordan of the Pacific Northwest Research Station, and is greatly appreciated.

Field assistants on this study were Ben Maletzke, Dan Harrington, Sherrie Farmer, Justin

Hadwen, Mike Kroeger and Keith Bagnall. My field assistants worked during difficult

                                             iv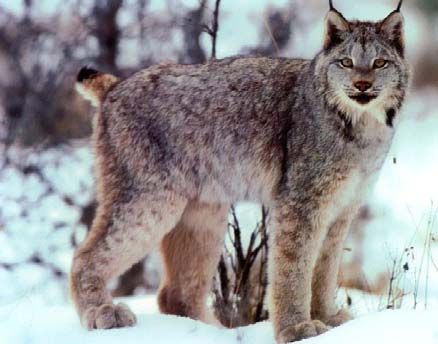
and sometimes dangerous field conditions and I truly appreciated their work ethic,

professionalism, and good judgment. Thanks to Mark Skatrud and Gary Koehler who

helped me to learn the study area, and to Mark Skatrud and Mike Tessendorf for sharing

their data on lynx locations and GIS coverages with me. Gary Allard and the crew at

Hamilton Farm Equipment in Okanogan provided us with excellent service during our

many snowmobile breakdowns and always got us up-and-running again quickly. Lastly,

I am indebted to the Principal Investigators of this study, Keith B. Aubry and Gary M.

Koehler, for their patience and advice, and for providing me with the opportunity to

conduct the fieldwork and to obtain a Master of Science degree.

                                            v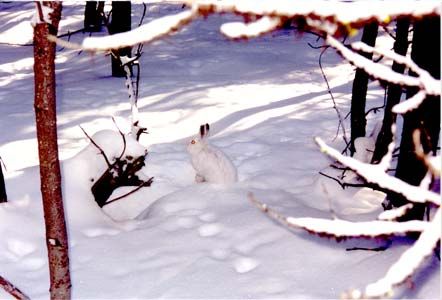
1

                CHAPTER I: FINE-SCALE HABITAT SELECTION

                                     INTRODUCTION

       The conservation of Canada lynx (Lynx canadensis) in the U.S. is an extremely

emotional issue that has generated a level of public interest comparable to that which

surrounded the federal listing decision for the northern spotted owl (Strix occidentalis

caurina) in the late 1980’s. Lynx interest groups have recently purchased timber rights in

a portion of the Loomis State Forest in Washington at a cost of over $16 million, and

activists reportedly burned a ski lodge in Colorado to protest inadequate protection of

lynx habitat. Some have argued that logging, road construction, and ski and snowmobile

areas may destroy lynx habitat and provide human access that disrupts hunting activities,

kitten rearing, and increases the likelihood that lynx will be killed illegally or incidentally

(Ruediger et al. 2000). However, reliable information from lynx populations in southern

boreal forests that could be used to evaluate the validity of these claims is lacking.

Numerous petitions have been submitted to list the lynx under the federal Endangered

Species Act, and several lawsuits were filed against the U.S. Fish and Wildlife Service

during the 1990’s (Ruggiero and McKelvey 2000). These actions eventually led to

federal listing of the lynx as “threatened” in the contiguous U.S. due to the inadequacy of

existing regulatory mechanisms (USFWS 2000).

       In the western states, lynx are known to select areas where lodgepole pine, (Pinus

contorta) is predominant. In Montana, Koehler et al. (1979) reported 23 of 29 relocations

of lynx were in densely stocked lodgepole pine stands. Lynx used lodgepole pine and

Engelmann spruce (Picea engelmannii)-subalpine fir (Abies lasiocarpa) forest cover
2
types more than expected in the northern Cascade Range of Washington (Koehler 1990).
In Washington, lynx primarily occupy mid- and late-successional (>40 yr old) subalpine
fir/lodgepole pine forests (Koehler 1990, McKelvey et al. 2000a), and in Montana
(Koehler et al. 1979) and Nova Scotia (Parker 1981, Parker et al. 1983) lynx select mid-
successional (20-40 yr old) conifer forests. Mid-successional forests that result from
wildfires (Koehler 1990, Poole et al. 1996) and timber harvesting (Parker 1981,
Thompson et al. 1989) are believed to be preferred by lynx because they support
abundant snowshoe hare (Lepus americanus) populations on which lynx depend for both
survival and reproduction (Parker 1981, Koehler 1990, Koehler and Aubry 1994, Hodges
2000a, McKelvey et al. 2000a).
Koehler and Brittell (1990) provided lynx management guidelines for forest
managers. These findings provided the foundation for lynx habitat management plans for
the Okanogan National Forest, Washington Department of Natural Resources Loomis
State Forest, Plum Creek Timber Company, and Boise Cascade Corporation timberlands.
Because of the recommendations made by Koehler and Brittell (1990), management
plans developed for the Loomis State Forest and private timberlands in Washington
primarily address snowshoe hare habitat requirements; other than considerations for
denning habitat, these plans do not directly address lynx habitat relations. However, the
timber management guidelines presented by Koehler and Brittell (1990) were based on
informed hypotheses about the habitat relations of lynx and snowshoe hares that have
never been rigorously tested. Good hare habitat may not always be good lynx habitat,
because lynx hunting success may be determined, in part, by stand structure (Murray et3
al. 1995) and prey vulnerability (Murray and Boutin 1991, Haglund 1966), as well as
snowshoe hare density (Murray et al. 1994, O’ Donoghue et al. 1998a).
The age or structural conditions of forests that are selected by lynx for hunting in
western montane regions are not well understood, yet are likely to be important
determinants of habitat quality for lynx. Knowledge of lynx habitat relations in the U.S.
at any spatial scale is limited (Aubry et al. 2000b), and studies of lynx habitat use in the
western mountains of the contiguous U.S. are urgently needed (Koehler and Aubry,
1994). New research on lynx in the U.S. should address multiple spatial scales and
multiple levels of biological organization (Aubry et al., 2000b). Radiotelemetry studies
of lynx that documented habitat use in the U.S. (Smith 1984, Brainard 1985, Koehler et
al. 1979, Koehler 1990) have monitored relatively few animals, and such studies do not
provide reliable information on fine-scale habitat selection (i.e., within forest stands;
Aubry et al. 2000a). Intensive snow-tracking studies comparing habitat use with
availability may provide insights into fine-scale habitat selection by lynx that could be
used to design silvicultural treatments and forest management strategies that will be
beneficial to this listed species.
Beginning in the 1980’s, extensive timber harvesting (both clearcuts and pre-
commercial thinning) has occurred on the Loomis State Forest, whereas none has
occurred on the adjacent portion of the Okanogan National Forest. In addition, a stand-
replacement fire (the Thunder Mountain fire) occurred on the Okanogan National Forest
in 1994. Both of these areas were included in the study area where Brittell et al. (1989)
and Koehler (1990) conducted lynx research in the 1980’s. These stand and landscape-4
scale differences in both natural and anthropogenic disturbances, and the continued
presence of a resident population of lynx in that area, provide a unique opportunity to
investigate fine-scale habitat selection by lynx.
STUDY AREA
The study was conducted on the Okanogan Plateau in the north-central Cascade
Range of Washington, approximately 25 km northwest of Conconully, Washington
(Figure 1). The study area is 200 km², is within the Okanogan Highlands physiographic
province (Franklin and Dyrness 1973), and was delineated primarily from telemetry
locations (Figure 2) obtained by Koehler (1990) and Brittell et al. (1989). Thus, lynx
were known to occur throughout the study area.
The study area is characterized by moderate slopes and broad, rounded summits
with elevations ranging from 1,400 to 2,260 m. Borders of the study area are defined by
the Chewuck River on the west and the headwaters of the Middle Fork Toats Coulee
Creek and Sinlehekin Creek drainages on the east. Lands are managed by the Okanogan
National Forest and Washington Department of Natural Resources, Loomis State Forest
(Figure 3). Forests occur on 85 percent of the area; burned areas on 9 percent;
herbaceous plant communities on 3 percent; shrub communities on 3 percent; and rock,
snow, and other cover categories on 1 percent (Bio/West, Inc., Figure 4). Major forest
associations within the study area are Engelmann spruce and subalpine fir, with
lodgepole pine being the dominant early seral species. Aspen (Populus tremuloides)
occurs occasionally on mid-slope and riparian areas. Douglas-fir (PseudotsugaFigure 1. Location of lynx study area on the Okanogan Plateau, Washington.
5Figure 2. Forest cover types on the Okanogan Plateau, Washington (data from Utah State Veg Grids). Point locations
from radiotelemetry studies of lynx conducted by J. David Brittell and Gary M. Koehler during the 1980s are shown as
burgundy circles. The Thunder Mountain fire (shown in orange) occurred after these studies took place.
6Figure 3. Land ownership and major patterns of disturbance on the Okanogan Plateau, Washington. The Okanogan
National Forest is shown in green and the Loomis State Forest is shown in yellow. The 1994 Thunder Mountain fire is
shown in orange and harvest units since 1991 are shown in blue.
7Figure 4. Forest cover types and outer boundary of lynx snowtracking study area on the Okanogan Plateau, Washington.
89
menziesii) dominates on south-facing aspects at lower elevations. Whitebark pine (Pinus
albicaulis) and subalpine larch (Larix lyalli) are found near timberline. Small to
moderate-sized openings frequently occur near ridgelines, and vegetation within these
non-forested habitats are generally composed of herbaceous plants with sagebrush types
(Artemisia spp.) interspersed. Several wet meadows are located within the central portion
of the study area.
Snow covers the area from November through April, but snowpacks may persist
on north-facing slopes until June (Brittell et al. 1989). Snow depths at the Mutton Creek
snow course station (Natural Resources Conservation Service 2003a), located
approximately 4 km south of the study area boundary at 1,730 m, averaged 60 cm during
winter 2000/01 (year 1) and 99 cm during winter 2001/02 (year 2). Snow depth was not
measured at higher elevations within the study area, but based on our field observations,
did not appear to exceed 2 m. The average minimum and maximum temperatures in the
central portion of the study area for February are –9.3º C and –2.5º C, respectively (Daly
and Taylor 2000).
Wildfires are an important determinant of forest composition within the study
area. The majority of fires result from lightning strikes. The Thunder Mountain fire
burned approximately 18 km² within the study area in 1994. Fire-return intervals have
been estimated at 250 yr (Fahnestock 1976) in the Pasayten Wilderness, located north and
west of the study area, and 109-137 yr in the North Cascades (Agee 2000), however,
large fires have burned more frequently within the study area in recent years (Thunder
Mountain fire in 1994 and Thirtymile fire in 2001). Subalpine fir and Engelmann spruce10
are both considered to be intolerant of fire, possessing thin bark, a low crown with
persistent branches, and shallow root systems, which generally results in tree mortality
when exposed to fire (Agee 1993). Because of the lack of fire resistance among
dominant tree species, most large fires in this area tend to be stand-replacement events
(Agee 1993).
Potential prey of lynx in the study area include the snowshoe hare, red squirrel
(Tamiasciurus hudsonicus), Columbian ground squirrel (Spermophilus columbianus),
porcupine (Erethizon dorsatum), beaver (Castor canadensis), voles (Clethrionomys spp,
Microtus spp, Phenacomys intermedius, Synaptomys borealis), blue grouse
(Dendragapus obscurus), and spruce grouse (Falcipennis canadensis). Moose (Alces
alces), and mule deer (Odocoileus hemionus) may be available as carrion. Other
carnivores that inhabit the study area and may compete with lynx include the mountain
lion (Felis concolor), bobcat (Lynx rufus), coyote (Canis latrans), American marten
(Martes americana), long-tailed weasel (Mustela frenata), and short-tailed weasel
(Mustela erminea). Avian predators that are present in winter and may compete with
lynx include goshawks (Accipiter gentilis) and, possibly, great-horned owls (Bubo
virginianus).
The area was historically and is currently grazed by domestic cattle during the
summer months. There are a few gravel roads within the Okanogan National Forest
portion of the study area, but logging roads are numerous on the Loomis State Forest, due
to intensive clear-cutting and partial cutting in the last 2 decades. Snowmobiling is a
popular winter activity in the study area, and several groomed trails are available in the11
Okanogan National Forest. Snowmobile access within the Loomis State Forest is not
confined to groomed routes. Snowmobile activity is heavy during the weekends, but
generally few snowmobiles are seen during the week.
Trapping for lynx occurred in the study area until 1981 when the season was
suspended to facilitate Brittell and Koehler’s field studies (Brittell et al. 1989). The
history of trapping and lynx management in this area are discussed in Brittell et al. (1989)
and McKelvey et al. (2000b).
METHODS
Field Methods
Field work was conducted from December 27, 2000 to March 7, 2001 and again
from December 12, 2001 to March 11, 2002. Snowmobiles provided all access to and
within the study area.
Investigation of habitat selection by lynx was accomplished by comparing habitat
conditions on systematically arrayed transects (availability) to those along lynx trails
(use). Surveys along transects were used to quantify available forest conditions and
relative prey abundances throughout the study area. Snow tracking of lynx was used to
describe fine-scale habitat use. Sampling on transects and tracking of lynx were
conducted on snowshoes. A systematic survey grid covering the entire study area was
generated using a Geographic Information System (GIS). Seventy-eight 2-km transects
were placed 1 km apart within the study area, which was divided into six comparably
sized zones (Figure 5), each of which approximated the average size of a female lynxFigure 5. Lynx zones and availability transects sampled on the Okanogan Plateau, Washington. Transects sampled
during the winter of 2000/01 are shown in red; transects sampled during the winter of 2001/02 are shown in blue.
1213
home range (39 km²) as determined by Koehler (1990). Zones were numbered 1-6, and
there were 10-14 transects within each zone. All plots along each transect were located
with Universal Transverse Mercator (UTM) coordinates. To obtain a representative
sample of use and availability, both temporally and spatially, a zone was randomly
selected at the beginning of the season, and the next sequential zone was searched each
working day after that. Transects sampled within each zone were selected randomly.
Lynx tracks were located by searching all available roads and trails by snowmobile
within the zone selected until a lynx track was found. If a lynx track was not located in
the selected zone, the next sequential zone(s) was searched until a track was located or
available fuel or time was expended. If more than one lynx track was located, the
freshest track was selected.
Data on habitat characteristics (physiographic conditions, forest structure, and
relative prey abundance) were collected within 5-m radius plots at 200-m intervals along
both availability transects and lynx trails. Starting points for all transects and lynx trails
began at the snowmobile trail, with the first sample plot located 200 m from the starting
point. For availability transects, locations of sample plots (UTM waypoints) were
entered in Rockwell Precision Lightweight GPS Receivers (PLGRs) global positioning
system (GPS) units. To locate sample plots, we used a compass to follow the bearing of
each transect line. We then used the PLGR unit to navigate to the exact waypoint. A hip
chain was used to measure 200-m intervals along lynx trails. Trimble ProXL GPS units
were used to digitize lynx trails. Trimble units were set to record locations at two-second
intervals while traveling along lynx trails. When we negotiated around or over14
obstructions along the lynx trails such as windfall patches, we used the pause function of
the Trimble unit to avoid taking repeated locations from the same place, which created
“noise” in the trail feature. To record a point along a lynx trail, the Trimble units were
set to receive and average five locations at one-second intervals.
Physiographic Conditions
Relative snow firmness was measured by dropping a 100-g balance weight
(penetrometer) attached to a nylon cord three times each from heights of 20 cm, 50 cm,
and 100 cm above the snow surface. All penetrometer drops were conducted within 1 m
of plot center on undisturbed snow. On lynx trails, penetrometer drops were placed
between two consecutive lynx tracks. The depth penetrated into the snow was measured
in cm by pulling the string taught without disturbing the weight, grasping the string with
the thumb and forefinger at the top of the snow surface, pulling the weight from the
snow, and measuring the distance between the thumb and the bottom of the weight. The
average of the three drops from each height was recorded.
The average slope (%) of each plot was estimated using a clinometer. Aspect was
measured to the nearest degree using a compass, then converted to degrees from
southwest (0º - 180º). Thus, higher values were representative of wetter and cooler
environmental conditions. Elevation for each plot was generated from UTM coordinates
and digital elevation models using ArcInfo.
Forest Structure
All trees >1 m in height above the snow surface within the plot were identified to
species and assigned to one of five diameter-at-breast-height (dbh) classes:15 10.2–17.8 cm; 17.9-27.9 cm; 28.0–50.8 cm; and >50.8 cm. Canopy cover was visually estimated at two levels, >2.5 m above the snow surface, and 96 hr since the last snowfall to be unreliable due to the effects of solar radiation, which obliterated tracks of both lynx and prey in open areas. For data analyses, track counts were standardized to the number of track intercepts per day by dividing the number of tracks by the number of hours since last snowfall, then multiplying by 24.
16

Data Analyses

       Variables included in my analyses were based primarily on those that were

identified as important to lynx in previous studies (Brittell et al. 1989, Koehler 1990). In

part, this variable selection process was designed to reduce the number of variables

included, given my relatively small sample sizes. Several subsets of the complete set of

data were used for model building (Table 1). These included: (1) Physiographic

variables. Selection of physiographic conditions such as slope, aspect, and elevation are

not expected to be influenced by the presence or absence of forest vegetation, so I

retained all plots in analyses of these physiographic variables. (2) Forest structure

variables. Because the primary objective of this study is to investigate fine-scale habitat

selection by lynx, all plots (both use and availability), which did not contain live trees,

were removed from the forest structure analysis. One of the physiographic variables,

snow firmness, may be influenced by forest structure due to the effects of shading by the

forest canopy and melting/sloughing of snow from the canopy during warm periods,

therefore I also analyzed snow firmness using the forest structure data subset. (3) Prey

variables. Analysis of prey data was further reduced from the forest structure data set by

including only those transects and trails which were sampled within 12-96 hr after the last

snowfall.

       Individual plots along a lynx trail are not independent of each other because the

lynx is likely to choose how it moves through the landscape based on previous

experience, energetic or competitive constraints placed upon the individual, or other

factors that can’t be measured or even identified by the researcher. In addition, the
Table 1. Descriptive statistics for datasets used in logistic regression analyses of habitat selection by lynx on the Okanogan
Plateau, Washington during the winters of 2000/01 and 2001/02.
Lynx trails Availability transects
No. of Mean (range) no. Total no. No. of Mean (range) no. Total no.
Dataset trails of plots/trail of plots transects of plots/transect of plots
Winter 2000/01
Physiographic 23 8.7 (5 - 13) 200 30 9.4 (6 - 10) 283
Vegetation 20 8.8 (5 - 13) 175 29 8.5 (5 - 10) 247
Prey 19 8.7 (5 - 13) 165 24 8.5 (5 - 10) 204
Winter 2001/02
Physiographic 17 15.2 (7 - 23) 259 46 9.8 (6 - 11) 450
Vegetation 17 14.4 (7 - 22) 244 41 9.0 (6 - 11) 367
Prey 14 14.9 (7 - 22) 209 33 9.1 (6 - 11) 300
1718
location of a plot is dependent on the location of the previous plot for both lynx trails and
availability transects. Consequently, I analyzed habitat selection by lynx using each trail
or availability transect as the unit of analysis. Some transects were not sampled
completely due to concerns about potential avalanche danger and, occasionally, due to
complete loss of satellite coverage by the GPS unit. Lynx trails were followed as far as
possible, given time constraints and tracking conditions. For all subsets of the data,
availability transects and lynx trails were included in statistical analyses only if they
contained ≥5 plots.
Final selection of variables included in logistic regression analyses was based on
results of contingency table analyses for categorical variables and Mann-Whitney U tests
and cumulative percent curves for continuous variables (Zar 1999). I conducted the
majority of univariate data exploration using SPSS 10.0 for windows. To test the
hypothesis that habitat characteristics used by lynx did not differ from availability, I
conducted stepwise logistic regression analyses (GenMod, SAS version 8e) incorporating
a hierarchical design (i.e., plots within transects). This is analogous to repeated-measures
analysis, but with repeated measures being made spatially, rather than temporally.
Because my analyses were exploratory in nature, I used αFigure 6. Lynx zones and trails sampled on the Okanogan Plateau, Washington. Trails sampled during the
winter of 2000/01 are shown in red; trails sampled during the winter of 2001/02 are shown in blue.
1920
eight availability transects were either fully or partially sampled during the study, 30 in
year 1 and 48 in year 2 (Figure 5). Two hundred and eighty-six availability plots were
sampled in year 1 and 454 in year 2.
Lynx tracks were never found within the boundaries of the Thunder Mountain
fire either during snow-tracking sessions or while sampling plots on availability transects.
Additionally, we did not record lynx crossing openings greater than 150 m in size.
Physiographic Conditions
Snow conditions varied substantially between the two winters of the study. In
year 1, the snow pack remained powdery throughout the entire depth of the snow pack
and for nearly the entire study period. No discernable ice crusts were present within the
snow profile. Temperatures generally remained below freezing until March when they
increased and the snow pack began to firm up. In year 2, the snow pack was much more
firm, and had multiple ice layers within the snow profile. Snow density is a quantitative
measure of water content in the snow pack that provides an indication of bearing strength
of the snow between the two winters. Snow density is derived by dividing the snow
water equivalent (SWE) by the snow depth. Snow density at Mutton Creek Snow Course
station for February 2001 was 0.21 and increased to 0.32 for February 2002 (Natural
Resources Conservation Service 2003a). Average snow density for the month of
February at this station over the past 35 yrs is 0.27. These differences in snow density
resulted in dramatic differences in the bearing strength of snow on the study area between
the two winters. Because habitat selection by lynx may be influenced by differences in21
snow conditions, data from each winter was analyzed separately. During the second field
season, the 100-g weight when dropped from heights of 20 cm and 50 cm did not contain
enough energy to penetrate ice layers within the upper snow profile. Consequently,
analyses of snow firmness was limited to data from 100-cm drops.
Lynx were highly selective for firmer snow in year 1 (Table 2) but did not select
for snow firmness in year 2. Mean elevation for lynx trails was slightly higher than
availability transects during both winters (Table 2), but differences between lynx trails
and availability transects were not significant in either year. Mean slope on lynx trails
was slightly greater than availability transects in year 1 (Table 2), though not significant.
Selection for flatter slopes by lynx was significant in year 2 (Table 2). Probability of
lynx use was not significantly influenced by aspect in either year. However, overall
mean aspects were more southerly for lynx trails than availability transects in year 1
(Table 2).
Forest Structure
Lynx selected for greater understory cover in year 1 but not in year 2 (Table 3).
Overstory cover was not selected for by lynx in either year. Lynx selected for stands
with higher densities of live treesTable 2. Physiographic variables used in stepwise logistic regression analyses of habitat selection by lynx on the Okanogan
Plateau, Washington during the winters of 2000/01 and 2001/02. Descriptive statistics are calculated at the level of trails and
transects. P-values represent the results of univariate logistic regression analyses.
Lynx trails Availability transects
Variable Mean SE Range Mean SE Range P-value1
Winter 2000/012
Snow firmness3 (cm) 23.8 1.36 11.5 - 32.1 29.1 0.87 16.5 - 39.1 0.003 (+)
Elevation (m) 1861.6 1.82 1690.3 - 2034.6 1853.4 2.24 1512.7 - 2034.7 0.773
Slope (%) 30.0 1.94 13.0 - 49.2 27.0 1.38 14.3 - 41.6 0.214
Aspect4 83.9 6.44 27.2 - 145.6 92.2 4.57 46.8 - 136.6 0.291
Winter 2001/025
Snow firmness3 (cm) 21.7 0.80 14.4 - 25.8 21.7 1.00 2.5 - 31.7 0.999
Elevation (m) 1867.8 2.81 1645.5 - 2123.1 1833.3 1.68 1619.7 - 2108.4 0.289
Slope (%) 23.7 1.62 14.3 - 39.4 27.4 1.03 12.4 - 42.0 0.062 (-)
Aspect 90.3 6.70 32.3 - 141.0 9208 4.21 32.5 - 147.4 0.753
1
The direction of significant relationships are shown in parentheses.
2
Sample sizes for all variables except snow firmness for the winter of 2000/01 were N=23 for lynx trails and N=30 for availability transects.
3
Expressed as the mean depth a 100-g weight penetrates the snow when dropped three times from 100 cm above the snow surface; lower values indicate firmer snow. Sample sizes for snow
firmness in winter 2000/01 were N=20 for lynx trails and N=29 for availability transects; sample sizes for snow firmness in winter 2001/02 were N=17 for lynx trails and N=41 for
availability transects.
4
Expressed as the angular distance from southwest (0-180°); higher values indicate cooler and wetter aspects.
5
Sample sizes for all variables except snow firmness for the winter of 2001/02 were N=17 for lynx trails and N=46 for availability transects.
22Table 3. Forest structure variables used in stepwise logistic regression analyses of habitat selection by lynx on the Okanogan
Plateau, Washington during the winters of 2000/01 and 2001/02. Descriptive statistics are calculated at the level of trails and
transects. P-values represent the results of univariate logistic regression analyses.
Lynx trails Availability transects
Variable Mean SE Range Mean SE Range P-value1
Winter 2000/012
Understory cover (%) 35.0 1.90 18.3 - 55.0 29.0 1.41 13.0 - 49.0 0.017 (+)
Overstory cover (%) 42.6 2.63 26.1 - 70.0 38.6 1.82 21.7 - 61.0 0.215
Density of live trees 7” dbh 44.3 4.71 2.9 - 100.0 42.4 4.25 0 - 85.2 0.752
Winter 2001/02 4
Understory cover (%) 24.8 2.53 6.2 - 44.3 25.1 1.41 5.0 - 42.0 0.912
Overstory cover (%) 37.9 3.33 14.4 - 76.4 37.1 1.65 18.0 - 60.0 0.815
Density of live trees 7” dbh 43.5 3.63 20.8 - 87.4 38.5 3.04 0 - 90.5 0.292
1
The direction of significant relationships are shown in parentheses.
2
Sample sizes for the winter of 2000/01 were N=20 for lynx trails and N=29 for availability transects.
3
Expressed as the mean density of stems per plot (78.5 m²) within each trail or transect.
4
Sample sizes for the winter of 2001/02 were N=17 for lynx trails and N=41 for availability transects.
2324
Density of subalpine fir
3
Number of stems/plot
2.5
2 Lynx trails
1.5
Availability
1 transects
0.5
0
50.8
17.8 27.9 50.8
dbh class
Density of Engelmann spruce
4.5
Number of stems/plot
4
3.5
3 Lynx trails
2.5
2 Availability
1.5 transects
1
0.5
0
50.8
17.8 27.9 50.8
dbh class
Density of lodgepole pine
9
Number of stems/plot
8
7
6 Lynx trails
5
4 Availability
3 transects
2
1
0
50.8
17.8 27.9 50.8
dbh class
Figure 7. Size class and number of stems per plot on lynx trails and availability transects
on the Okanogan Plateau, Washington.25
densities of live trees >17.9 cm dbh during year 2, but no selection for these stands was
apparent in year 1 (Table 3). Selection did not occur for stands with higher percentages
of lodgepole pine >17.9 cm dbh in either year.
Relative Prey Abundance
Lynx selected for higher relative abundance of snowshoe hares in year 1, but hare
indices between lynx trails and availability plots were similar in year 2 (Table 4).
Relative abundance of red squirrels was similar between use and expected in year 1, but
lynx selected against higher relative abundance of red squirrels in year 2 (Table 4).
Stepwise Logistic Regression Analyses
During the stepwise logistic regression analyses, I selected the univariate model
with the lowest P-value for each data subset, then built all possible 2-variable models.
However, none of the multivariate models resulted in significance for more than one
variable at α < 0.1. Therefore, final habitat selection models are the univariate models
shown in Tables 2-4.
DISCUSSION
Physiographic Conditions
Lynx selected for small differences in bearing strength of snow during year 1 (Table 2).
These results support the findings of Murray and Boutin (1991) in southwest Yukon.
They demonstrated that snow was significantly firmer on lynx trails than it was 1 m off
the trail, and that the use of hard-snow travel routes by lynx was not entirely due to travel
on trails hardened by other animals. On the Okanogan Plateau, I believe that lynx usedTable 4. Prey variables used in stepwise logistic regression analyses of habitat selection by lynx on the Okanogan Plateau,
Washington during the winters of 2000/01 and 2001/02. Descriptive statistics are calculated at the level of trails and transects.
P-values represent the results of the univariate logistic regression analyses.
Lynx trails Availability transects
Variable Mean SE Range Mean SE Range P-value1
Winter 2000/012
Snowshoe hares3 2.3 0.31 0.9 - 6.2 1.1 0.21 0.2 - 4.0 0.006 (+)
Red squirrels3 0.4 0.12 0 - 2.0 0.3 0.08 0 - 1.3 0.430
Winter 2001/024
Snowshoe hares 1.5 0.29 0.5 - 4.5 1.4 0.22 0 - 5.9 0.889
Red squirrels 0.3 0.05 0 - 0.6 0.9 0.18 0 - 4.9 0.007 (-)
1
The direction of significant relationships are shown in parentheses.
2
Sample sizes for winter of 2000/01 were N=19 for lynx trails and N=24 for availability transects.
3
Expressed as the mean number of track crossings along 20-m segments at each sample plot (5-m radius plus 15 m beyond plot) within each trail or transect.
4
Sample sizes for winter of 2001/02 were N=14 for lynx trails and N=33 for availability transects.
2627 multiple behavioral strategies to remain on firmer snow during year 1, whenever possible. At the landscape scale, lynx typically traveled in forested stands where snow was firmer, due to intermittent warm spells which caused the snow load in the canopy to slough and compact the snow profile. Snowshoe hare trails were used by lynx, as well as trails of conspecifics. Groups of lynx walked in each other’s tracks while traveling through the landscape. Often, the lynx following placed their feet so perfectly in the previous cat’s track that it was not possible to determine whether there were multiple animals until they diverged. Single lynx also followed previous lynx tracks in the same manner. Lynx were frequently found walking on both groomed and un-groomed snowmobile trails, which compacted snow and provided for ease of movement. Occasionally, we found lynx traveling on our snowshoe trails along transect lines. Although lynx used firmer snow surfaces whenever possible, I am not suggesting that travel by lynx was limited to these conditions. Lynx trails were often found crossing roads within 100 m or less of where we found them previously, and were found in many of the same places they were found during the late 1980’s (G. Koehler, personal communication). We also followed two trails, approximately 1 month apart, that were almost exactly on top of one another. Therefore, my observations are that, with the exception of intensive hunting behavior within a habitat patch, lynx generally maintained what appeared to be pre-determined travel routes. Use of compacted surfaces by lynx described above was limited to situations where it provided a more energetically efficient means of moving in the chosen direction of travel. If a compacted surface diverged from the direction of travel, lynx continued without hesitation on undisturbed snow.
28

       During year 2, maximum daily temperatures were generally higher than in year 1

(Natural Resources Conservation Service 2003b), which resulted in more periods of

melting, and multiple ice crusts in the snow profile. Consequently, snow firmness

increased throughout the study area in year 2, resulting in no difference detected in snow

firmness between used and available habitat conditions (Table 2).

       Koehler (1990) reported that lynx in north-central Washington used higher

elevations in summer than in winter. A reanalysis of Koehler’s data (McKelvey et al.

2000a) found that the majority of telemetry locations from 1985 to 1987 were at

elevations between 1,700 and 2,000 m during all seasons. My data were consistent with

these findings; mean elevations for lynx trails were 1,862 m and 1,868 m for year 1 and

2, respectively (Table 2). Only ten percent of plots along lynx trails were above 2,000 m

(45/456), and only two of 40 lynx trails (5%) were entirely above 2,000 m. Mean

elevations for lynx trails were slightly higher than for availability transects (Table 2), but

were not significantly different. Within my study area, forest composition changes

abruptly from subalpine fir/Engelmann spruce at higher elevations to Douglas-fir types

below approximately 1,450 m, depending on aspect. Due to the fact that my study area

was delineated, in part, based on Koehler’s (1990) finding that lynx occurrence was

primarily within the high-elevation subalpine fir/Engelmann spruce zone, it is not

surprising that lynx use of elevation was not different than availability.

       Lynx have been reported to use flatter slopes than available in both north-central

Washington (McKelvey et al. 2000a) and in the southern Canadian Rockies (Apps 2000).

Selection for flatter slopes is likely related to energetic demands if prey and vegetative
29
composition and density remain similar throughout the range of available habitats. Lynx
on my study area did not select for flatter slopes during year 1, but did in year 2 (Table
2). During the first winter of study, I believe that habitat selection by lynx was driven
primarily by snow firmness; thus lynx were limited by snow conditions and energetic
constraints in their ability to select for flatter slopes. During year 2, lynx were able to
select for significant, though small, differences in slope, which further suggests that they
attempt to reduce energetic costs whenever possible.
Lynx use of aspects was not significantly different than expected during either
year of the study, although lynx used more southerly aspects in year 1 compared to
availability (Table 2). Snow firmness on north-facing aspects (≥315º and ≤45º) was
extremely low in year 1. During that year, plot-level data confirm that lynx were
selecting routes on north-facing aspects where snow firmness was substantially greater
than available (use: mean = 21.9 cm, availability: mean = 31.3 cm) compared to averages
along availability transects and lynx trails within the entire study area (Table 2).
Forest Structure
Numerous studies have shown that lynx and snowshoe hares select mid-
successional (20-40 yr old) forest stands that have regenerated from stand-replacement
disturbances. Throughout the taiga, lynx select such stands at all phases in the hare cycle
(Mowat 2000). Habitat selection by lynx in interior Alaska was nearly exclusive for a
25-yr-old burn, and lynx trails were rarely seen in an early seral burn (9 yr old) or mature
forest greater than 100 yr old (Paragi et al. 1997). Very few lynx studies have been
conducted in areas where 20-40 yr old stands were not available for lynx. Some studies30 have shown that lynx will select for mature coniferous forests as well as mid-successional stands. However, most of the researchers have not defined ‘mature’. Therefore, based on the age range of other forest types, which were defined, I assume that ‘mature’ stands described in these studies were >60 yrs old. Kesterson (1988) and Staples (1995) demonstrated strong selection by lynx for a mid-successional burn (approx. 40 yr old) and mature forest patches within the burned area in the Kenai National Wildlife Refuge. In Nova Scotia, Parker (1981) found that the habitats most preferred by lynx were early (14 yr old) and mid (22-28 yr old) successional stages followed closely by open mature conifer and open bog types. Koehler (1990) reported that pellet plot counts of snowshoe hares were highest in 20-yr-old lodgepole pine stands during the late 1980’s, and that these stands made up 40 yr old) successional forest. Early seral stands (
31

of small-diameter lodgepole pine are extremely rare 15 yr after Brittell and Koehler’s

research. It appears that the young lodgepole pine stands with dense hare populations

Koehler (1990) identified during his study have now reached the stem-exclusion stage

and are no longer providing high-quality habitat for hares.

       Lynx selected areas for hunting that had higher understory cover than available

during year 1 (Table 3). Habitat patches that were used by lynx for hunting had the

highest densities of small-diameter stems and/or included areas where subalpine fir and

Engelmann spruce canopies extended to the ground. In year 2, relative abundance of

hares was slightly lower overall and hares were more evenly dispersed between lynx

trails and availability transects (Table 4). Lynx did not select for higher understory cover

in year 2, but used stands with higher densities of mature trees less than expected (Table

3). Because I measured understory cover as any cover below 2.5 m above the snow

surface, a large proportion of this variable was influenced by the branches of large trees

near the snow surface. I believe that the canopies of large trees had an important

influence on snow firmness in year 1, due to the sloughing of snow from the canopy.

Therefore, I hypothesize that lynx used these stands during year 1 both to find hares and

to gain the advantage of firm snow for chasing hares. Major (1989) found that the

distance of a hare from escape cover was an important factor in determining the hunting

success of lynx during a chase, and that longer distances from escape cover resulted in

more successful kills by lynx. He also found that visibility was considerably higher in

areas where lynx chased hares compared to visibility in available habitat types. During

my study, snow was firmer in year 2 compared to year 1 and hares were more evenly
32
dispersed, so lynx may have been concentrating their movements in more open areas
where escape cover for hares was reduced and where visibility was higher.
Relative Prey Abundance
Hares generally avoid clearcuts, young stands (33
negative effect on the hare population, either through reduction in food availability,
decreased reproduction, or increased vulnerability to predation.
Relative abundance of red squirrels decreased slightly on use trails from year 1 to
year 2, but increased on availability transects (Table 4). Red squirrels are dependent on
cone-producing trees. During year 2, lynx selected against the largest size classes of
trees, and habitats with red squirrels were used significantly less than expected. Based on
behaviors interpreted from snow-tracking, lynx concentrated their hunting efforts on
hares during both years and squirrels were preyed upon opportunistically. The fact that
lynx did not select within-stand characteristics that provide high-quality habitat for
squirrels supports our observations that lynx were not concentrating their hunting efforts
on locating squirrels, at least during year 2 of the study.34
CHAPTER II: FOOD HABITS
INTRODUCTION
Throughout North America, the distribution of lynx is virtually coincident with
the distribution of snowshoe hares (Aubry et al. 2000a). Ruggiero et al. (2000)
concluded that snowshoe hares are the dominant prey of lynx throughout their range.
Within their home ranges, lynx select stands where snowshoe hares are most abundant
(Parker 1981, Koehler 1990, Murray et al. 1994). With the exception of two studies
conducted in the taiga during low hare densities (Brand and Keith 1979, O’Donoghue et
al. 1998), food habits studies of lynx have shown that snowshoe hares are present in 52-
100% of all samples analyzed (Aubry et al. 2000a).
Hodges (2000b) concluded that habitat use by snowshoe hares is linked to dense
understory cover rather than canopy closure, and that hares appear to select habitats for
cover rather than for food, though cover and food often co-vary. Based on pellet counts,
Koehler (1990) found that the density of snowshoe hares in Washington was four to five
times greater in 20-year-old lodgepole pine stands than it was in lodgepole stands >43
years old, and nine times greater than in Engelmann spruce/subalpine fir stands. Koehler
(1990) suggested that hares used densely stocked young lodgepole pine stands because
they provided the forage, escape, and thermal cover required by snowshoe hares for
survival. Koehler found that small-diameter (35
Litvaitis et al. (1985) found that hares began to colonize harvest units 6-7 years after
cutting, and increased to peak population levels 20-25 years after harvest.
Red squirrels are considered to be an important alternative prey of lynx,
particularly in southern boreal forests where hare densities are thought to be similar to
hare population lows in the taiga (Aubry 2000a). Food habits studies of lynx have shown
that red squirrels are the second most numerous prey species, after snowshoe hares. In
Washington, Koehler (1990) found red squirrel remains in 24% of lynx scats collected in
both summer and winter. Apps (2000) reported red squirrels were the prey item in 30%
of 137 kills located while snow-tracking lynx in the southern Canadian Rockies. In the
taiga, behavioral data showed that lynx actively hunted for red squirrels and may have
switched from preying on hares to preying on red squirrels during a hare population low
(O’Donoghue et al. 1998b).
Frequency of occurrence of prey species other than snowshoe hares and red
squirrels have been as high as 39% in food habits studies of lynx during summer.
However, during the winter, many small mammal species hibernate or spend the majority
of their time in subnivean habitats, which make them unavailable as prey for lynx. Voles
are occasionally found on the snow surface, and have been identified as prey items during
winter food habits studies (Apps 2000, Kesterson 1988, O’Donoghue et al. 1998b,
Staples 1995). Grouse and carrion are also found to occur in lynx scats during winter
(Major 1989, Brand et al. 1976, Staples 1995).
The second objective of this study is to investigate winter food habits of lynx on
the Okanogan Plateau.36
METHODS
Scat Analyses
Scats were collected along lynx trails only if they were associated with fresh,
identifiable lynx tracks. Each individual scat was placed into a small paper bag, and
marked with the date, collector, location (UTM), and sample number. Scats were kept as
snow-free as possible by either scraping the snow off the scat, or shaking the snow out of
the bag once the scat was collected. Scats were dried at the field quarters by opening the
top of the paper bag and placing them in a makeshift dryer (plywood box with an
incandescent bulb). When they had dried thoroughly, the paper bags were closed and
stored in a cool, dry environment. The scats were never removed from the original paper
bags, nor were they touched during the entire process. All scats were sent to the Wildlife
Conservation Genetics Laboratory in Missoula, Montana for DNA identification, and all
were confirmed to be from lynx.
Scats were weighed and prepared for analysis by placing them in individual nylon
mesh bags and soaking them in a mild soap and water solution for 24-48 hr. Each scat
was hand-agitated in a clean soap and water solution to remove lipid content, then placed
in a 500-micrometer sieve and rinsed with water. Remaining materials were placed into a
petri dish and separated with forceps into bone, hair, skin, feather, and plant categories
using a 10X dissecting microscope. Remains were identified using reference collections
and standard mammal and hair identification manuals (Verts and Carraway 1998, Moore
et al. 1974).37
Prey Chases and Hunting Behaviors
Segments of lynx trails exhibiting a bounding gait were recorded as chases.
Behaviors that indicated lynx had sighted prey, such as crouches, body drags or
abbreviated strides prior to a bounding pattern were also included in the chase segment.
Chase and kill-site data recorded included species chased, outcome, and total chase
distance. If lynx were able to pounce on a prey item without a chase, we recorded the
behavior as an ambush. Scats and urine stains were recorded as scent markings. Lynx
frequently sat in the snow leaving an impression of their hindquarters; this kind of
impression was described by Major (1989) as a “lookout site”. Lynx beds were recorded
as either resting beds or ambush beds. Resting beds were usually ice-encrusted,
presumably from body heat generated by the lynx from extended use. Typically, some
portion of resting beds appeared to have an impression of the lynx in a curled-up position.
Ambush beds were impressions of a lynx lying in the snow with it’s forefeet stretched out
in front of it. Generally, ambush beds were not ice-encrusted, indicating short-duration
use, but there were some exceptions. Lynx frequently deviated, sometimes only slightly,
from their direction of travel to investigate snow-covered brush piles, logs, thickets, etc.
This behavior was recorded as a structure investigation.
RESULTS
Scats Analyses
Forty-six scats were analyzed for food contents, 20 from year 1 and 26 from year
2. In year 1, remains of snowshoe hare were found in 18 scats (90%) and red squirrels in38
9 (45%) scats (Table 5). Two scats contained remains of unknown sciurids (10%), and
remains of an unknown bird and a porcupine were each found in a single scat (5%).
Vegetation was found in 10 (50%) of scats in year 1 and consisted of one to a few conifer
needles or fragments of herbaceous vegetation that were probably ingested incidentally
during a meal.
In year 2, snowshoe hare remains were found in 22 (85%), red squirrels in 4
(15%), and southern red-backed voles (Clethrionomys gapperi) in 3 (12%) of the 26
scats. Grouse and unknown bird remains were each found in 1 scat (4%). Nine (35%) of
the scats contained vegetation (Table 5).
Prey Chases and Hunting Behaviors
Four prey items were located along lynx trails in year 1 (Table 6). Snowshoe
hares were identified as prey on three occasions and 1 was a blue grouse. Chase trails
were recorded prior to locating two of the hare kills. At the site of the third hare kill, all
evidence of a chase was obliterated by the lynx, which had spent considerable time at the
feeding site. At this kill, there were two lynx beds within 5 m of the carcass, and several
lynx trails radiating out from the carcass remains. An attempt was made to follow all
lynx trails originating at the feeding site for approximately 50 m. However, a bounding
pattern could not be found in the general area of the kill site. Therefore, it appeared that
the lynx had ambushed the hare from above, which was a hunting technique we identified
from tracks in the snow during year 2. An additional bed was located approximately 100
m uphill from the feeding site indicating that the lynx had spent a considerable amount of
time around this hare carcass. The grouse kill was located in an open sagebrush area. ItYou can also read