Half-Year 2018 Results - Jan Jenisch, CEO Géraldine Picaud, CFO July 27, 2018
←
→
Page content transcription
If your browser does not render page correctly, please read the page content below

Half-Year 2018 Results
Jan Jenisch, CEO
Géraldine Picaud, CFO

July 27, 2018
© LafargeHolcim Ltd 2015
01   Highlights and Key Developments
     Jan Jenisch, Chief Executive Officer

                                            2
Half-year 2018 highlights

›   Strong revenue growth of 6.2% LFL in Q2 and 4.8% LFL in the first half, supported by volume
    increase with accelerating momentum in Q2

›   Recurring EBITDA improvement in Q2 with a LFL growth of 1.5%; first half recurring EBITDA of
    CHF 2’484 million, down 1.4% on a LFL basis

›   Full year 2018 targets confirmed

›   New Strategy 2022 – “Building for Growth”: On track, focus on execution and delivery

                                                                                                   3
Strategy 2022 – “Building for Growth”
Execution on track
Three bolt-on acquisitions in the UK, the US and France
Capturing organic growth in key markets: +4.8% Net Sales growth in H1
Growth
Winning of major infrastructure contracts (e.g. UK highway project)
Simplification Closure of regional headquarters in Singapore and Miami completed
Performance
Simplification Closure of corporate offices in Paris and Zurich ongoing
Simplification plan and country focused organization implemented, cost saving program underway
&
Performance
Committed to maintain our investment grade rating
Financial
Ongoing review of asset portfolio and investment / divestment options; divestment plan of
Strength selected assets of at least CHF 2 billion
Key leadership team established within new organizational set-up
Vision
& People
Start of LafargeHolcim Business School in autumn 2018
4
Half-year 2018 bolt-on acquisitions
First bolt-on acquisitions - Executing on our growth strategy
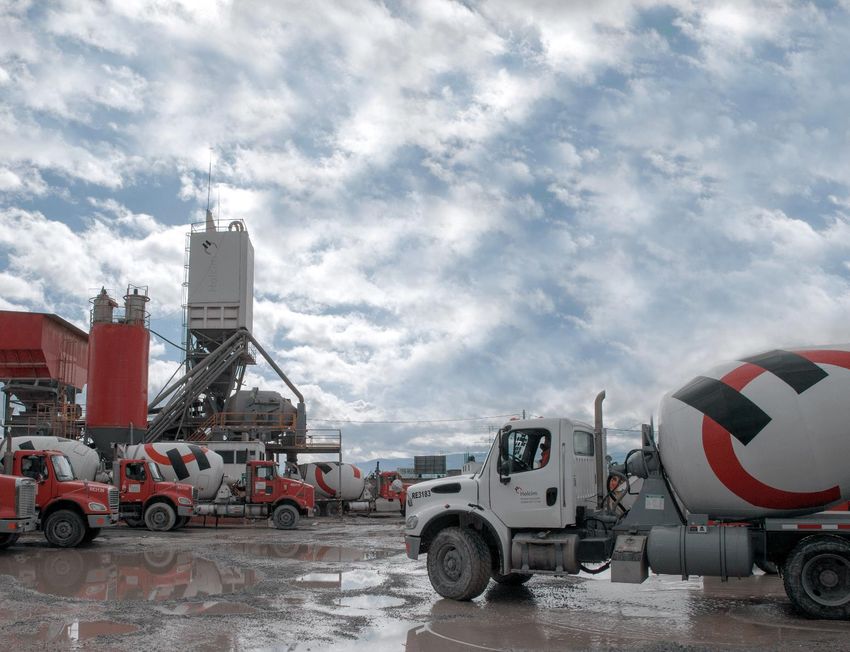
Tarrant Concrete, US (announced July 2018)
› Leading provider of ready-mix concrete in the Dallas/Fort Worth area in Texas
› Net Sales USD 40 million
› Will strengthen the Group’s existing operations in one of the most attractive and largest
ready-mix concrete and aggregates markets in the USA
Vritz, France (announced July 2018)
› Sand quarry in Western France
› Extraction rights until 2045
› Will strengthen the Group’s current footprint in a fast growing area in Western France
Kendall Group, UK (announced February 2018)
› Leading aggregates and ready-mix concrete manufacturer in the South of England
› Net Sales CHF 33 million
› Expected to benefit from above average growth in the region, especially in the housing
segment
5
02   Half-year 2018 financial results
     Géraldine Picaud, Chief Financial Officer

                                                 6
Half-year 2018 performance highlights
Solid progress on Net Sales and Free cash flow in the first half

                                                                                                          Recurring
                              Net Sales                                                                                                                          Free cash flow
                                                                                                          EBITDA 2)

    H1 2018                                     Q2 2018                          H1 2018                                      Q2 2018                                     H1 2018

        +4.8% 1)                                  +6.2% 1)                          -1.4%                        1)            +1.5% 1)                             +28%

           CHF 13’272 m                              CHF 7’442 m                         CHF 2’484 m                             CHF 1’784 m                          CHF -473 m

   1)   Like-for-like
   2)   Variance calculated on 2017 Recurring EBITDA restated for the inclusion of the Group share of net income of Huaxin (CHF 46 million in H1 2017, CHF 39 million in Q2 2017)

                                                                                                                                                                                    7
Half-year 2018 Net Sales bridge
Acceleration in Net Sales momentum over the first half

CHF m

                                                       +2.7%

                                                 +4.8% LFL                                                                        ›    In Q2, Net Sales of CHF 7’442 m
                                                                                                                                       › LFL of CHF 430 m (+6.2%, vs +3.1% in Q1 2018)
                                                                                            -0.7%
                      -1.3%
                                                          +605            13'357
                                                                                                                                       › Scope of CHF -76 m (-1.1%)
                                                                                                            13’272**
                                                                                                                                       › FX of CHF 3 m (neutral)
                                                                                             -85
    12’918*
                       -166            12'752

     H1 2017           Scope         H1 2017 LFL           LFL         H1 2018 LFL            FX             H1 2018

* Net Sales H1 2017 restated by CHF 438 million due to the reporting of gross sales from Trading activities, following the application of IFRS 15, effective 1 January 2018. No impact on Recurring EBITDA
** Of which CHF 363 million from Trading activities

                                                                                                                                                                                                             8
Half-year 2018 total Net Sales by segment
Improving top line in most segments

           Cement          Aggregates              RMX             Solutions & Products       Group Net Sales
                                                                                              split by segment

           +5.6 %              +4.6%              +5.0%                    -0.8%

        8'755      8'866
                                                         2'657                                        8%
                                               2'475                                         18%

                                                                                                                 61%
                                      1'917
                            1'796                                                           13%

                                                                        1'029    1'050

      H1 2017              H1 2017             H1 2017                 H1 2017
                                                                                           Cement   Aggregates   RMX   SOP
                 H1 2018             H1 2018             H1 2018                 H1 2018

Net Sales in CHF m
% LFL growth / decline

                                                                                                                         9
Half-year 2018 Recurring EBITDA bridge
Growth in Q2 largely offsets soft Q1

CHF m
                                                           -3.8%

                                                      -1.4% LFL                                                                 ›     In Q2, Recurring EBITDA of CHF 1’784 m
                    -0.8%
                                                 +142            -177                                                                 › LFL of CHF 26 m (+1.5%, vs -7.7% in Q1 2018)
    2'582            -21
                                                                                              -1.6%
                                                                                                                                      › Scope of CHF -7 m (-0.4%)
                                  2'561
                                                                               2'526           -42
                                                                                                                                      › FX of CHF -8 m (-0.5%)
                                                                                                             2’484

   H1 2017          Scope      H1 2017 LFL       Volume       Price / cost   H1 2018 LFL        FX          H1 2018

* Recurring EBITDA H1 2017 restated by CHF 46 million due to the reclassification of the Group share of net income of Huaxin to JVs

                                                                                                                                                                                10
Half-year 2018 regional performance
Growth in Net Sales and Recurring EBITDA in 4 regions out of 5
North America Latin America Europe Middle East Africa Asia Pacific
+3.4% +9.4%
+2.3% 3'807 +17.1%
3'664
-7.4%
2'475 +1.2% 773
+12.9% 1'535
+2.0% +5.2% -33.5%
599
1'428
488 365
470
Net Sales to external customers (CHF m) Recurring EBITDA (CHF m) % LFL growth / decline
11North America
Continued earnings progression, acceleration in volume growth throughout the first half
CHF m H1 2018 Q2 2018
Net Sales1) 2’475 1’608
LFL growth +2.3% +5.5% 1)
Reported growth +3.0% +7.4%
Recurring EBITDA 470 462
LFL growth +2.0% +1.6%
› Further solid contribution of the region
› Acceleration of volumes throughout the first half in the US
supported by positive market conditions and successful
commercial initiatives
› Volumes up in Canada, stable earnings contribution
› Increase in profits constrained by higher logistic costs and
maintenance activities to cope with demand growth
1) Net Sales to external customers 12Latin America
Strong growth in top line and earnings
CHF m H1 2018 Q2 2018
Net Sales1) 1’428 742
LFL growth +12.9% +11.7%
Reported growth -2.1% -3.2%
Recurring EBITDA 488 253
LFL growth +5.2% +3.0%
› Continued strong contribution from the region
› Further solid trends in Mexico supported by RMX activities
› Good performance from Argentina despite higher costs to
fulfill demand and volatility in currency
› Activity impacted by transporters strike in Brazil in overall
encouraging environment
1) Net Sales to external customers 13Europe
Acceleration in top line and profit growth in the first half
CHF m H1 2018 Q2 2018
Net Sales1) 3’664 2’147
LFL growth +3.4% +7.2%
Reported growth +10.2% +14.1%
Recurring EBITDA 599 509
LFL growth +1.2% +9.3%
› Strong market trends in most countries leading to
acceleration in volumes in main segments throughout H1
› Acceleration in Net Sales growth in Germany and France
although production constraints temporarily affected
earnings growth
› Further strong contribution from Eastern and Central Europe
› Broadly stable volumes in the UK but lower profits on the
back of higher input costs
1) Net Sales to external customers 14Middle East Africa
Challenging conditions in several countries
CHF m H1 2018 Q2 2018
Net Sales1) 1’535 785
LFL growth -7.4% -6.3%
Reported growth -11.7% -9.2%
Recurring EBITDA2) 365 189
LFL growth -33.5% -36.4%
› Difficult H1 and challenging market conditions in several
countries, notably reflecting shift in supply & demand
balance in Algeria and demand decline in Iraq
› Improving top line trends in Nigeria, supported by higher
market demand and commercial initiatives
› Solid performance in Egypt despite increasingly volatile
environment
› Turnaround in progress in South Africa to address current
operational issues
1) Net Sales to external customers 15
2) Contribution from share of net income from JVs: CHF 33m in half-year 2018 vs. CHF 33m in half-year 2017Asia Pacific
Strong Net Sales and earnings growth
CHF m H1 2018 Q2 2018
Net Sales1) 3’807 1’971
LFL growth +9.4% +9.3%
Reported growth +3.6% +4.0%
Recurring EBITDA2) 773 475
LFL growth +17.1% +20.9%
› In China, continued increase in profits supported by pricing
momentum and benefit from vertically-integrated waste
recycling business
› In India, growth in Net Sales and profits driven by solid
volumes, supported by sustained market demand and
higher sales of premium products
› South East Asia recorded lower profits; encouraging top
line trends were observed in the Philippines and in
Indonesia
1) Net Sales to external customers 16
2) Contribution from share of net income from JVs: CHF 178m in half -year 2018 (of which CHF 145m for Huaxin) vs. CHF 78m in half-year 2017 (restated for Huaxin CHF 46m)On track: Update on CHF 400 m fixed-cost savings program
2018 Q1 2019 Q2 2019 onwards
Major SG&A restructuring plans All measures implemented by
committed and announced end Q1 2019 CHF 400 m
cost savings full year
Streamlining of regional and top run rate 1)
management organization
Run rate on new SG&A
Miami and Singapore regional basis effective by Q2 2019
headquarters closed
1) measured at 2017 currency exchange rates
Closing of Paris and Zurich corporate
offices ongoing
Largest countries’ savings plans
initiated in H1
17Half-year 2018 financial performance
EPS of CHF 0.62 in the first half
H1 2018 before H1 2017 before
H1 2018 Variation
impair. & divest. impair. & divest.
CHF m
Net Sales 1) 13'272 13'272 12'918 354
2)
Recurring EBITDA 2'484 2'484 2'582 -97
Depreciation, amortization & impairment -1'106 -1'104 -1'125 21
3)
Restructuring and others -300 -300 -38 -262
Operating Profit 1'078 1'080 1'418 -338
Profit/loss on disposals and other non-op. items -52 -4 41 -45
Share of profit of associates 9 9 20 -11
Net financial expenses -449 -455 -398 -57
Income Taxes -191 -186 -306 120
ETR 32.7% 29.5% 28.3%
Net Income 394 444 774 -331
Net income - Group share 318 371 651 -281
EPS (CHF) 0.53 0.62 1.07 -0.45
1) Net Sales H1 2017 restated by CHF 438 million due to the change in accounting policies for trading activities
2) Recurring EBITDA H1 2017 restated by CHF 46 million due to the reclassification of the Group share of net income of Huaxin to JVs
3) Others include litigation, implementation and other non-recurring costs
18Half-year Free Cash Flow bridge
Good progress on Free Cash Flow driven by Net Working Capital improvement
CHF m
-473 -473
-661
-2
-101 +76
+312
-97
H1 2017 Recurring EBITDA Net Working Capital Capex Share of JVs Others H1 2018
19Net Financial Debt December 2017 to June 2018
Net debt of CHF 16.1 billion at end of June
CHF m
-88 +170
+1’270
-44
+473
16'127
14'346
NFD Free cash flow Disposals/ Acquisitions Dividends FX Others NFD
(Dec 2017) (June 2018)
2003 Outlook 2018
Jan Jenisch, Chief Executive Officer
212018 Outlook and targets confirmed
› Positive prospects for demand in 2018
› Strong market trends in Europe
› Continued solid growth in North America
› Good growth prospects in most countries in Latin America
› China and India to remain supportive; South East Asia to stabilize
› Challenging outlook in a number of countries in Middle East Africa
› 2018 full year targets confirmed
› Net Sales growth of 3-5% on a like for like basis
› Recurring EBITDA growth of at least 5% on a like-for-like basis
› Acceleration of Recurring EBITDA growth in the second half 2018
222018 Upcoming Events
› October 26, 2018: Q3 earnings release
› November 2018: Capital Markets Day
23Disclaimer
These materials are being provided to you on a confidential basis, may not be distributed to the press or to any other persons, may not be
redistributed or passed on, directly or indirectly, to any person, or published or reproduced, in whole or in part, by any medium or for any purpose.
This document does not constitute or form part of any offer or invitation to sell or issue, or any solicitation of any offer to purchase or subscribe
for, any securities of LafargeHolcim or any subsidiary or affiliate of LafargeHolcim nor should it or any part of it form the basis of, or be relied on in
connection with, any purchase, sale or subscription for any securities of LafargeHolcim or any subsidiary or affiliate of LafargeHolcim or be relied
on in connection with any contract or commitment whatsoever.
The information contained herein has been obtained from sources believed by LafargeHolcim to be reliable. Whilst all reasonable care has been
taken to ensure that the facts stated herein are accurate and that the opinions and expectations contained herein are fair and reasonable, it has
not been independently verified and no representation or warranty, expressed or implied, is made by LafargeHolcim or any subsidiary or affiliate
of LafargeHolcim with respect to the fairness, completeness, correctness, reasonableness or accuracy of any information and opinions contained
herein. In particular, certain of the financial information contained herein has been derived from sources such as accounts maintained by
management of LafargeHolcim in the ordinary course of business, which have not been independently verified or audited and may differ from the
results of operations presented in the historical audited financial statements of LafargeHolcim and its subsidiaries. Neither LafargeHolcim nor any
of its respective affiliates, advisers or representatives shall have any liability whatsoever (in negligence or otherwise) for any loss or damage
howsoever arising from any use of this presentation or its contents, or any action taken by you or any of your officers, employees, agents or
associates on the basis of the this presentation or its contents or otherwise arising in connection therewith.
The information contained in this presentation has not been subject to any independent audit or review and may contain forward-looking
statements, estimates and projections. Statements herein, other than statements of historical fact, regarding future events or prospects, are
forward-looking statements, including forward-looking statements regarding the group’s business and earnings performance, which are based on
management’s current plans, estimates, forecasts and expectations. These statements are subject to a number of assumptions and entail known
and unknown risks and uncertainties, as there are a variety of factors that may cause actual results and developments to differ materially from
any future results and developments expressed or implied by such forward-looking statements. Forward-looking statements contained in this
presentation regarding past trends or activities should not be taken as a representation that such trends or activities will continue in the future.
Although LafargeHolcim believes that the estimates and projections reflected in the forward-looking statements are reasonable, they may prove
materially incorrect, and actual results may materially differ. As a result, you should not rely on these forward-looking statements. LafargeHolcim
undertakes no obligation to update or revise any forward-looking statements in the future or to adjust them in line with future events or
developments, except to the extent required by law.
24You can also read