Half-year. 2020. Investor Presentation 27 August 2020 - UBM Corporate
←
→
Page content transcription
If your browser does not render page correctly, please read the page content below

office.                                     residential.    hotel.

 ©bloomimages                                ©bloomimages    ©WOOW

half-year. 2020.
Investor Presentation
27 August 2020
                                                                               1
UBM Development AG – Investor Presentation                             27.08.2020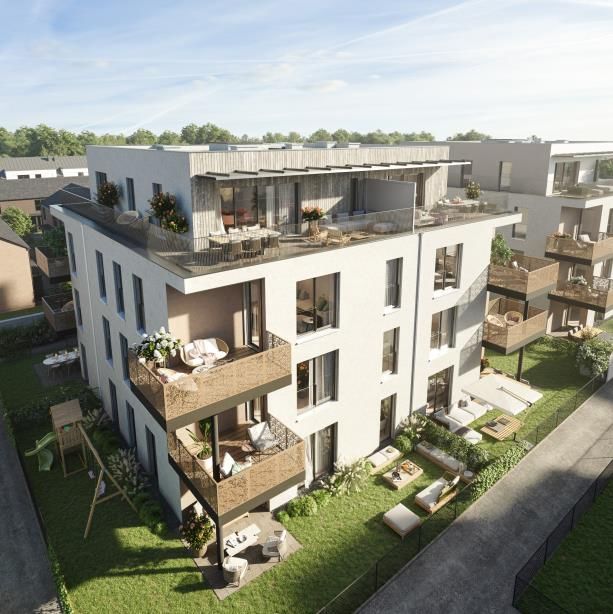
DISCLAIMER

disclaimer.

This presentation was prepared by UBM Development AG (the “Company” or “UBM”) solely for use at investors’ meetings and is
furnished to you solely for informational purposes.
This presentation dates as of 27 August 2020. The facts and information contained herein might be subject to revision in the
future. Neither the delivery of this presentation nor any further discussions of the Company with any of the recipients shall, under
any circumstances, create any implication that there has been no change in the affairs of the Company since such date. None of
the Company or any of its parent companies or subsidiaries or any of such person's directors, officers, employees or advisors nor
any other person makes any representation or warranty, express or implied as to, and no reliance should be placed on, the
accuracy or completeness of the information contained in this presentation. None of the Company or any of its parent companies
or subsidiaries or any of their directors, officers, employees and advisors nor any other person shall have any liability whatsoever
for any loss howsoever arising, directly or indirectly, from any use of this presentation. The same applies to information contained
in other material made available at such investors' meetings.
This document is selective in nature and is intended to provide an introduction to, and overview of, the business of the Company.
Wherever external sources are quoted in this presentation, such external information or statistics should not be interpreted as
having been adopted or endorsed by the Company as being accurate.
This presentation contains forward-looking statements relating to the business, financial performance and results of the Company
and/or the industry in which the Company operates. These statements generally are identified by words such as "believes",
"expects", "predicts", "intends", "projects", “plans", "estimates", "aims", "foresees", "anticipates", "targets", and similar expressions.
The forward-looking statements, including but not limited to assumptions, opinions and views of the Company or information from
third party sources, contained in this presentation are based on current plans, estimates, assumptions and projections and involve
uncertainties and risks. Various factors could cause actual future results, performance or events to differ materially from those
described in these statements. The Company does not represent or guarantee that the assumptions underlying such forward-
looking statements are free from errors nor do they accept any responsibility for the future accuracy of the opinions expressed in
this presentation. No obligation is assumed to update any forward-looking statements.
By accepting this presentation you acknowledge that you will be solely responsible for your own assessment of the market and of
the market position of the Company and that you will conduct your own analysis and be solely responsible for forming your own
view of the potential future performance of the Company‘s business.
                                                                                                                                             2
UBM Development AG – Investor Presentation                                                                                       27.08.2020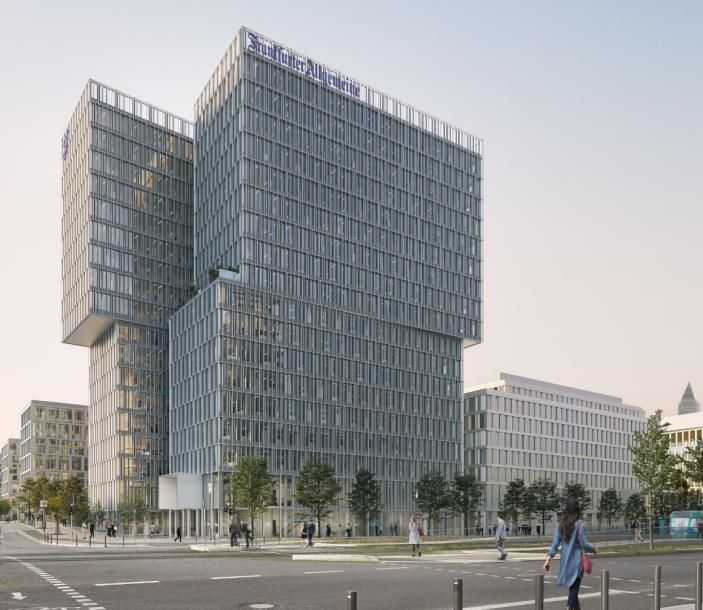
SUMMARY

summary. half-year.

   1       full steam ahead. ready for a V-shaped recovery.

   2       winners take it all. shakeout on the horizon. pipeline +60%.

   3       confident for resi AND office. different reasons. same result.

   4       no opportunity without change. FAZ. green building. smart office.

   5       ready to fire. strong financials. hotel operation write-downs digested.

   6       agility is key for the future. developers can always create value.

                                                                                             3
UBM Development AG – Investor Presentation                                           27.08.2020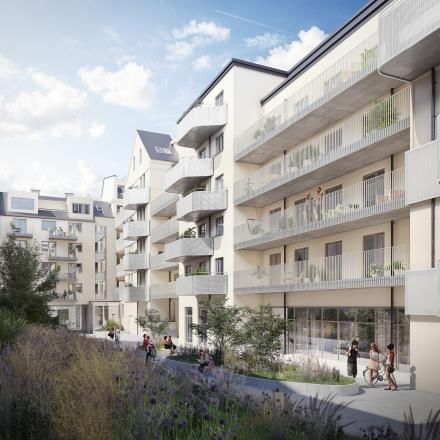
FULL STEAM AHEAD

   1         recession. deep and short.
 G10 Real GDP (pre-crisis level =100)1

             Q2/08                                                Q4/21                              Q4/11    ▪   No fundamental
   100
                                                                                                                  economic reasons for
    98      Q4/19
                                                                                                                  depression
    96                                                             financial crisis
    94
    92                                                                                                        ▪   Low deleveraging
    90                                                                                                            pressure (dovish central
    88                            COVID-19-crisis
                                                                                                                  banks)
    86
 quarters 0          1      2      3      4     5      6      7    8     9       10     11     12   13   14

 German Truck Toll Mileage Index (1 March =100)2                                                              ▪   Decisive, sizeable
 102                                                                                                              reaction by policy
  98
                                                                                                                  makers worldwide

  94
                                                                                                              ▪   Sharply rising
  90
                                                                                                                  consumer confidence
  86                                                   recorded truck mileage                                     and rebound in China
  82
   01. Feb       29. Feb      28. Mrz     25. Apr      23. Mai    20. Jun

1Morgan   Stanley: Global Macro Mid-Year Outlook – 14 June 2020    2Spiegel   – 28 July 2020
                                                                                                                                             4
UBM Development AG – Investor Presentation                                                                                         27.08.2020
FULL STEAM AHEAD

  1     no business as usual.
 What stays?                                 What changed?
 ▪     Low interest rates                    ▪   Appetite for risk
                                                   ▪   “A”-locations only
 ▪     Money flooding the markets                      (“B”-locations hard/long hit)
                                                   ▪   Restrictive bank financing
 ▪     Real assets inflation                           (more equity, less leverage)
       (properties, gold, shares)                  ▪   Top credit only
                                                       (developers, tenants and investors)

                                             ▪   Preference for asset classes
                                                   ▪   Residential, Logistics
                                                       (yield compression continues)
                                                   ▪   Office – new type office up,
                                                       old-style office down
                                                   ▪   Hotel, Retail – recovery to take years

 real estate market massively impacted as most other businesses...
                                                                                                5
UBM Development AG – Investor Presentation                                            27.08.2020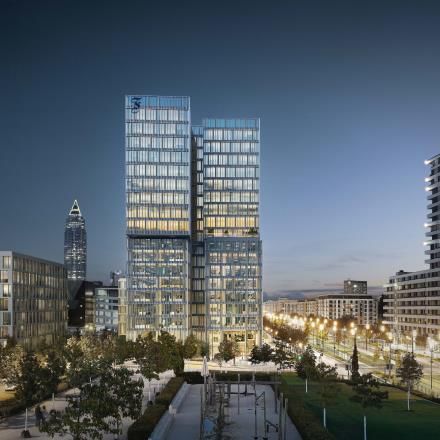
WINNERS TAKE IT ALL

  2     opportunity hunting. on the horizon.

                                             ▪   Over-leveraged competitors
                                                 after more than a decade of
                                                 booms

                                             ▪   Mezzanine investors are
                                                 becoming nervous

                                             ▪   Insolvencies to increase
                                                 dramatically

 shakeout – no question if, only when…
                                                                                    6
UBM Development AG – Investor Presentation                                  27.08.2020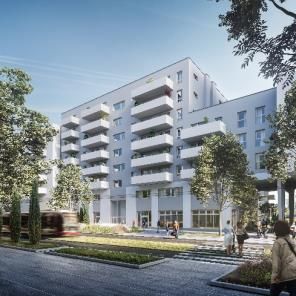
WINNERS TAKE IT ALL

  2      pipeline +60%. more projects activated.
Development Pipeline (HY20-HY24)               New Pipeline Breakdown
in € bn                                        by asset class             ▪   Further projects activated
                                                                              from original € 2.5bn
                                                                              pipeline
                        2 bn
       +60%                                                 Residential
                                       Re-classification
                                                                          ▪   ~70% of pipeline in
                                                                              residential & office –
    1.25bn                                           16%                      and growing
                                                               43%
                                      Hotel    16%                        ▪   Re-classification: FAZ
                                                                              shows the way – trading
                                                                              as another alternative
                                                      25%

                                                                          ▪   No new hotel projects –
                                                Office                        cautious on asset class
  initial corona   current pipeline
     pipeline
                                                                              going forward

 first step of comeback in our own hands…
                                                                                                          7
UBM Development AG – Investor Presentation                                                        27.08.2020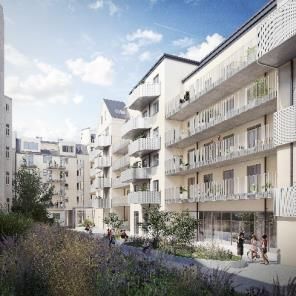
CONFIDENT FOR RESI AND OFFICE

  3     residential booms. prices increase.

                                             ▪ Increase in residential sale
                                               prices over last three months

                                             ▪ Institutional demand grows
                                               (buy to rent)

                                             ▪ Importance of “Home”
                                               significantly increased as
                                               direct result of lockdown

 3,500 apartments in pipeline. 2,700 in four top cities…
                                                                                8
UBM Development AG – Investor Presentation                              27.08.2020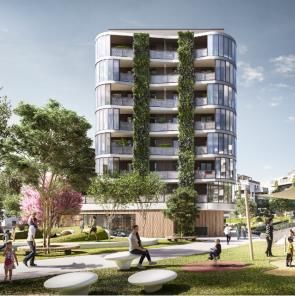
CONFIDENT FOR RESI AND OFFICE

    3          new type. office space.
 Supply-Demand Ratios1
               Ratio < 1 = demand > supply                                                        ▪       Most tenants consider reducing
               even in a scenario with minus 20% the
  1,0          supply-demand ratio stays below 1                                                          office space – work from home
                                                                                   0.99                   (wfh), layoffs, cost saving
                                                                      0.94
  0,8                                                   0.86
                                                                                                          programmes

                              0.69         0.71
  0,6                                                                                             ▪       Opportunity for developers,
                 0.50
                                                                                                          headache for holders of office
  0,4                                                                 0.75         0.79                   assets
                                                        0.69
                              0.55         0.57

  0,2            0.40
                                                                                                  ▪       Growing demand for new type of
                                                                                                          office space – competitive with
  0,0
                                                                                                          “wfh”, more flexible, more space
                                                                                                          per employee, data generator
                                            2
                  minus 20% scenario                     steady rental demand

  smart office – “new type” office space to re-invent office life…
1 Calculated   as (sqm available in pipeline HY2020-2022 + vacancy as of HY2020) / (rental demand 2018-2019)   2 JLL:   Auswirkungen von Corona auf die Büromärkte – Juni 2020
                                                                                                                                                                                 9
UBM Development AG – Investor Presentation                                                                                                                            27.08.2020
NO OPPORTUNITY WITHOUT CHANGE

  4     FAZ. walk the talk.
Role model F.A.Z. Tower and offices in Frankfurt:

                                                           F.A.Z. Tower
                                                           ▪ 24,000m² meet high interest from
                                                               quality investors

                                                           Building II
                                                           ▪ Termination of hotel lease contract

                                                           ▪   Re-planning initiated at earliest
                                                               possible point of time

                                                           ▪   15,000 m² of office space as
      FAZ Tower                              Building II       substitute for hotel
      Office                                 Hotel

                                             Office

 from hotel to “new type” office within a few months…
                                                                                                     10
UBM Development AG – Investor Presentation                                                    27.08.2020
NO OPPORTUNITY WITHOUT CHANGE
4 green building. new reality.
▪ Renewable raw materials –
timber construction (pre-fab), clay
plaster, straw insulation, etc.
▪ Natural cooling through planting
as integral part of construction
▪ New mobility concepts –
more bike rooms, less car parking
▪ Cradle to cradle (C2C) –
life-cycle management, building
material passport and recycling
become imperative
filling a buzzword with substance and adding tangible value…
11
UBM Development AG – Investor Presentation 27.08.2020READY TO FIRE
5 earnings. record half-year.
Earnings before tax (EBT) / Net Profit Fast and decisive action
in €m
43.8
▪ Execution of strategic partnership
with ARE (Austrian Real Estate)
28.1
29.3 ▪ Introduction of short-time work as the
26.6
only (Vienna-listed) real estate
20.8 21.3 company
▪ Reduction of more than € 1.5m in
personnel expenses – helped to
shake up minds
▪ Hotel operation write-downs – book
H1 2018 H1 2019 H1 2020
value, shareholder loans and
accumulated losses of € 15m in total
managing means taking it into your own hands…
12
UBM Development AG – Investor Presentation 27.08.2020READY TO FIRE
5 balance sheet. strength.
Net debt
in €m
- € 200m ▪ Successful optimisation of balance
sheet pays off
691.2
477.9 421.8 442.4 487.2 ▪ Financial strategy with focus on risk
▪ Mechanisms to control and steer
balance sheet in place
▪ Equity ratio of 34.2% and LTV of
2016 2017 2018 2019 H1 2020 35.6%
Cash
in €m + € 190m ▪ Successful liquidity measures in
234.5
critical Corona phase
200.4 212.4
▪ Temporary payment stop, short-
time work, strict cash management
75.2
42.3 ▪ Cash protected to utilise
opportunities
2016 2017 2018 2019 H1 2020
putting us in pole position to benefit from the new normal…
13
UBM Development AG – Investor Presentation 27.08.2020AGILITY IS KEY
6 outlook. opportunities ahead.
first half-year second half-year & beyond
Calibration Re-invention
▪ Delivering strong results ▪ FAZ as role model
▪ Collecting financial firing power ▪ Green building, smart office
▪ Introducing strategic partnerships ▪ Trading opportunities
▪ Writing down hotel operations ▪ Benefitting from others’ weakness
developers can create value in times of boom and crisis…
14
UBM Development AG – Investor Presentation 27.08.2020backup.
▪ ubm at a glance 16
▪ pipeline 17-22
▪ hotel 23-24
▪ portfolio book values 25-26
▪ financials 27-34
▪ investor relations 35-39
15
UBM Development AG – Investor Presentation 27.08.2020EQUITY STORY
ubm. at a glance.
▪ Asset classes Residential and Office
focus.
▪ Strategic focus on green building and smart office
▪ Top cities in Europe only
▪ Top management (Executive Committee) invested with € 5m in UBM shares
stock market.
▪ Options entitle management to 5% of the increase in value
▪ Syndicate (Ortner & Strauss) core shareholder with approx. 39%
▪ Prime market listing Vienna Stock Exchange, maximum transparency
▪ Pipeline of €2bn (HY2020-HY2024)
pipeline.
▪ ~70% of pipeline in residential & office – and growing
▪ Change from hotel projects to other asset classes
▪
track record. More than 145 years of corporate history
▪ Sustainable earnings growth over last decade
▪ Clear values: competent. consequent. transparent.
▪ Portfolio value: €1.41bn
size.
▪ Total assets: €1.37bn
▪ Equity: €468m
16
UBM Development AG – Investor Presentation 27.08.2020PIPELINE
development pipeline. (I).
Rooms, Lettable Area,
Project Asset Apartments Share Compl. Status1
immergrün (I), Berlin Residential 392 apartments 50% Q4/20 Part. S.
Anders Wohnen (II), Munich Residential 101 apartments 50% Q4/20 Part. S.
QBC 1&2, Vienna Office 37,000 m² 65% Q4/202 Fwd. S.
voco Kneuterdijk, The Hague Hotel 204 rooms 100% Q2/21
Astrid, Prague Office 4,000 m² 100% Q2/21 Fwd. S.
Neugraf, Prague Residential 177 apartments 50% Q2/21 Part. S.
Anders Wohnen (III), Munich Residential 100 apartments 50% Q2/21 Part. S.
Mercure Mlynska, Katowice Hotel/Office 268 rooms, 2.800 m² 100% Q3/21 Fwd. S.
Holiday Inn Express, Düsseldorf Hotel 455 rooms 50% Q3/21
barany.7, Vienna Residential 126 apartments 100% Q3/21 Fwd. S.
Pohlgasse, Vienna Residential 121 apartments 50% Q3/21 Fwd. S.
Am Kanal, Potsdam Hotel/Residential 198 rooms, 126 micro apartm. 50% Q4/21
Ibis Styles Mogilska, Krakow Hotel 259 rooms 100% Q4/21 Fwd. S.
Sugar Palace, Prague Hotel 175 rooms 75% Q4/21
Note: selected projects
1 Fwd. S. = Forward Sale, Part. S. = Partial Sale
2 Closing Q1 2021
17
UBM Development AG – Investor Presentation 27.08.2020PIPELINE
development pipeline. (II).
Rooms, Lettable Area,
Project Asset Apartments Share Compl. Status1
siebenbrunnen 21., Vienna Residential/Office 178 apartments, 5,500 m² 100% Q1/22 Part. S.
Hafeninsel V, Mainz Residential/Office 50 apartments, 3,000 m² office 50% Q2/22
Nordbahnhof Viertel, Vienna Residential 193 apartments 50% Q3/22
F.A.Z. Tower (I), Frankfurt Office 23,800 m² 75% Q3/22
Rankencity, Graz Residential 201 apartments 70% Q4/22
F.A.Z. Tower (II), Frankfurt Office 15,000 m² 75% Q2/23
Gmunder Höfe, Munich Residential 443 apartments 30% Q3/23 Part. S.
LeopoldQuartier, Vienna Residential/Reclassification Site 23,000 m² 90% >2023
Astrid Garden, Prague Residential 125 apartments 100% >2023
Arcus City, Prague Residential 284 apartments 100% >2023
Village im 3., Vienna Residential/Office 500 apartments, 14,000 m² 51% >2023
Kelsenstrasse, Vienna Office 25,000 m² 50% >2023
Baubergerstr., Munich Mixed Site 28,000 m² 60% >2023
Paket 6 Mixed 26 properties 50% >2023
Note: selected projects
1 Fwd. S. = Forward Sale, Part. S. = Partial Sale
18
UBM Development AG – Investor Presentation 27.08.2020PIPELINE
residential pipeline.
immergrün (I), Neugraf,
Berlin Prague
Apartments: 392 Apartments: 177
Completion: Q4/20 Completion: Q2/21
2020 2021
Anders Wohnen (II+III), barany.7,
Munich Vienna
Apartments: 101+100 Apartments: 126
Completion: Q4/20+Q2/21 Completion: Q3/21
Note: selection of projects in UBM‘s pipeline 19
UBM Development AG – Investor Presentation 27.08.2020PIPELINE
residential pipeline.
siebenbrunnen 21. Rankencity,
Vienna Graz
Apartments: 178 Apartments: 201
Completion: Q1/22 Completion: Q4/22
2022 >2023
Nordbahnhof Viertel, Arcus City,
Vienna Prague
Apartments: 193 Apartments: 284
Completion: Q3/22
Note: selection of projects in UBM‘s pipeline 20
UBM Development AG – Investor Presentation 27.08.2020PIPELINE
office pipeline.
QBC 1&2, F.A.Z. Tower,
Vienna Frankfurt
GLA: 37,000 m² GLA: 23,800 m²
Completion: Q4/20 Completion: Q3/22
2021 2022 >2023
Astrid Office, Kelsenstrasse,
Prague Vienna
GLA: 4,000 m² GLA: 25,000 m²
Completion: Q2/21 Completion: >2023
Note: selection of projects in UBM‘s pipeline 21
UBM Development AG – Investor Presentation 27.08.2020PIPELINE
hotel pipeline.
voco Kneuterdijk, Mercure Kattowice
The Hague Mlynska
Category: 4+* Category: 4*
Keys: 204 Keys: 268
Completion: Q2/21 Completion: Q3/21
2021
HIEx Düsseldorf Sugar Palace,
Moskauer Strasse Prague
Category: 3* Category: 5*
Keys: 455 Keys: 175
Completion: Q3/21 Completion: Q4/21
Note: selection of projects in UBM‘s pipeline 22
UBM Development AG – Investor Presentation 27.08.2020HOTEL
ubm hotels. leaseholds.
Our partners:
Germany Holiday Inn Munich Westpark1
5 hotels – 1,223 rooms Holiday Inn Leuchtenbergring1
Holiday Inn Frankfurt “Alte Oper“
HIEX Berlin Klosterstraße
HIEX Munich City West
Austria
1 hotel – 156 rooms Kempinski Hotel Das Tirol Jochberg
Poland InterContinental Warsaw
6 hotels – 1,420 rooms Radisson Blu Hotel, Krakow
Park Inn by Radisson Krakow
Radisson Blu Hotel, Wrocław
Holiday Inn Warsaw City Centre
Holiday Inn Gdansk City Centre
Netherlands
1 hotel – 207 rooms Crowne Plaza Amsterdam - South
1 Franchise
23
UBM Development AG – Investor Presentation 27.08.2020HOTEL
hotels. ubm as "middle-man".
Income from
Operations
Lease Payment
Hotel Hotel
Owner Operator
Lease Guarantee
Management
e.g. Union, Deka, e.g. InterContinental,
Amundi 50% share held by UBM
Fees Radisson, Kempinski
24
UBM Development AG – Investor Presentation 27.08.2020PORTFOLIO BOOK VALUES
book value breakdown. € 1.4bn.
Book value by asset category
2%
23%
Developments ▪ Development portfolio well above
Standing Assets 70% (= target ratio)
Land Bank ▪ Pure Play Developer
75%
Book value by country
3% ▪ Germany and Austria represent
9%
28% Germany 70% of portfolio
18% Austria ▪ Poland share at 18% due to standing
Poland assets (Poleczki Park)
Czech Rep.
42%
Other
Data as of 30 Jun 2020 / Book value split excluding capitalisation of lease contracts of € 19m 25
UBM Development AG – Investor Presentation 27.08.2020PORTFOLIO BOOK VALUES
standing assets.
Book values (IFRS)
▪ Austria prime assets and Poleczki
Other granular
(~€ 20m)
represent close to € 270m (82%) of
Poland granular
standing assets
(~€ 30m)
Austria prime ▪ Sale of Austrian prime assets
(~€ 130m) dependent on equity partners
(Palais Hansen Kempinski,
€ 323m Jochberg Kempinski, Wien Mitte)
▪ Poleczki Business Park in Poland -
good yield, lump-sum investment
Poland Poleczki1 Austria granular
(~€ 140m) ▪ High granularity of remaining assets
(~€ 5m)
requires time and management
attention
As of 30 Jun 2020
1 Poleczki business park in Warsaw, € 140m represent % of holding 26
UBM Development AG – Investor Presentation 27.08.2020FINANCIALS
key performance indicators.
Key Earnings Figures (in €m) 1-6/2020 1-6/2019 %Δ
Total Output1 181.3 182.6 -0.7%
Revenue 79.6 92.0 -13.5%
EBT 43.8 29.3 49.5%
Net profit (before non-controlling interests) 26.6 21.3 24.5%
Key Asset and Financial Figures (in €m) 30 Jun 2020 31 Dec 2019 %Δ
Total assets 1,367.9 1,316.4 3.9%
Equity 468.1 462.5 1.2%
Equity ratio 34.2% 35.1% -0.9PP
Net debt2 487.2 442.4 10.1%
Cash and cash equivalents 234.5 212.4 10.4%
Key Share Data and Staff 30 Jun 2020 31 Dec 2019 %Δ
Earnings per share (in €)3 2.99 2.54 17.6%
Earnings per share including hybrid interest (in €) 3.45 3.01 14.9%
Market capitalisation (in €m) 230.9 352.7 -34.5%
Dividend per share (in €)4 2.20 2.20 0.0%
Staff5 342 389 -12.1%
1 Total Output corresponds to the revenue generated by fully consolidated companies and companies consolidated at equity as well as the sale proceeds from share deals in
proportion to the stake held by UBM
2 Net debt equals current and non-current bonds and financial liabilities, excluding leasing liabilities, minus cash and cash equivalents.
3 Earnings per share after deduction of hybrid capital interest (change in calculation method beginning in 2020, prior year data adjusted). Reported amounts based on HY results.
4 The dividend is paid in the respective financial year, but is based on profit for the previous financial year. …
5 Decline due to deconsolidation Hotel Holiday Inn Gdansk City Centre (2019: 55 employees ubm hotels) 27
UBM Development AG – Investor Presentation 27.08.2020FINANCIALS
income statement.
in T€ 1-6/2020 1-6/2019 %Δ
Total Output1 181,346 182,587 -0.7%
Revenue 79,604 92,046 -13.5%
Changes in the portfolio 387 -2,680 n.a.
Share of profit/loss from companies accounted for at equity -8,579 13,157 -165.%
Net result from fair value adjustments (accord. to IAS 40) 69,454 27,877 149.1%
Material cost -58,186 -61,030 -4.7%
Personnel expenses -18,649 -18,867 -1.2%
Other operating income & expenses -23,730 -14,317 65.7%
EBITDA 40,301 36,186 11.4%
Depreciation and amortisation -1,902 -2,189 13.1%
EBIT 38,399 33,997 12.9%
Financial income2 16,024 7,247 121.1%
Financial cost -10,583 -11,922 -11.2%
EBT 43,840 29,322 49.5%
Income tax expense3 -17,273 -7,978 116.5%
Net Profit 26,567 21,344 24.5%
Earnings per share (in €) 2.99 2.54 17.6%
1 Total Output corresponds to the revenue generated by fully consolidated companies and companies consolidated at equity as well as the sales
proceeds from share deals in proportion to the stake held by UBM
2 Includes income from share deals
3 Of which € -2.7m (H1 2019: € -1.7m) from current taxes and € -14.5m (H1 2019: € -6.3m) from deferred taxes in H1 2020 28
UBM Development AG – Investor Presentation 27.08.2020FINANCIALS
total output and revenue. bridge.
in €m 181.3
10.8 Rentals
9.3
Hotel operations2
38.5 General contracting &
project management
79.6
5.4 0.9
122.8
27.3
Proceeds from sale of
properties 46.0
Total Output 1 Revenue
1 Total Output corresponds to the revenue generated by fully consolidated companies and companies consolidated at equity as well as the
sale proceeds from share deals in proportion to the stake held by UBM.
2 Due to deconsolidation of UBM hotels Management GmbH 29
UBM Development AG – Investor Presentation 27.08.2020FINANCIALS
total output and EBT. segment reporting.
in T€
Total Output by region 1-6/2020 1-6/2019 %Δ EBT by region 1-6/2020 1-6/2019 %Δ
Germany 72,612 60,114 20.8% Germany 78,117 36,005 117.0%
Austria 62,215 63,793 -2.5% Austria -19,306 -4,504 n.a.
Poland 35,476 38,349 -7.5% Poland -11,065 -5,368 n.a.
Other 11,043 20,331 -45.7% Other -3,906 3,189 n.a.
Total 181,346 182,587 -0.7% Total 43,840 29,322 49.5%
Total Output by 1-6/2020 1-6/2019 %Δ EBT by 1-6/2020 1-6/2019 %Δ
asset class asset class
Residential 66,959 44,324 51.1% Residential 62,990 2,524 2395.6%
Office 39,009 6,739 478.9% Office -91 16,121 n.a.
Hotel 26,455 70,051 -62.2% Hotel -10,904 7,913 n.a.
Other 18,365 30,853 -40.5% Other -3,363 7,805 n.a.
Service 30,558 30,620 -0.2% Service -4,792 -5,041 n.a.
Total 181,346 182,587 -0.7% Total 43,840 29,322 49.5%
30
UBM Development AG – Investor Presentation 27.08.2020FINANCIALS
balance sheet. assets.
in T€ 30 Jun 2020 31 Dec 2019 %Δ
Non-current assets 835,185 851,371 -1.9%
Intangible assets 2,700 2,747 -1.7%
Property, plant and equipment 11,370 40,242 -71.7%
Investment property 371,459 467,740 -20.6%
Investments in companies accounted for at equity 170,858 134,484 27.0%
Project financing 246,965 181,157 36.3%
Other financial assets 12,667 11,501 10.1%
Financial assets 3,573 3,412 4.7%
Deferred tax assets 15,593 10,088 54.6%
Current assets 532,699 465,018 14.6%
Inventories 152,505 128,169 19.0%
Trade receivables 102,496 103,294 -0.8%
Financial assets 33,373 9,716 243.5%
Other receivables and current assets 9,226 8,751 5.4%
Cash and cash equivalents 234,542 212,384 10.4%
Assets held for sale 557 2,704 -79.4%
Total assets 1,367,884 1,316,389 3.9%
31
UBM Development AG – Investor Presentation 27.08.2020FINANCIALS
balance sheet. equity & liabilities.
in T€ 30 Jun 2020 31 Dec 2019 %Δ
Equity 468,067 462,506 1.2%
Share capital 22,417 22,417 0.0%
Capital reserves 98,954 98,954 0.0%
Other reserves 215,504 205,147 5.0%
Mezzanine/hybrid capital 126,793 130,315 -2.7%
Non-controlling interests 4,933 5,673 -22.5%
Non-current liabilities 661,925 637,555 3.8%
Provisions 7,225 6,759 6.9%
Bonds 435,916 435,018 0.2%
Non-current financial liabilities 201,284 186,145 8.1%
Other non-current financial liabilities 11,473 1,306 778.5%
Deferred tax liabilities 6,027 8,327 -27.6%
Current liabilities 237,892 216,328 10.0%
Provisions 538 686 -21.6%
Bonds 49,780 49,713 0.1%
Current financial liabilities 55,534 33,680 64.9%
Trade payables 69,654 57,199 21.8%
Other current financial liabilities 33,837 24,263 39.5%
Other current liabilities 18,040 17,563 2.7%
Taxes payable 10,509 33,224 -68.4%
Total equity & liabilities 1,367,884 1,316,389 3.9%
32
UBM Development AG – Investor Presentation 27.08.2020FINANCIALS
overview. cash flow.
in €m
105.9 2.0 487.2
442.4 -97.8
25.5 379.2
25.1 2.4
-18.2
326.3
Net debt Sales Operat. Net Dividend Interest Tax Net Invest- Net debt
proceeds1 CF2 debt I debt II ments Others
31 Dec 19 (net) (net) 30 Jun 20
1 Incl. advance payments (IAS 2) and PoC IFRS 15 valuations
2 Operative cash flow after working capital and before interest/taxes 33
UBM Development AG – Investor Presentation 27.08.2020FINANCIALS
cash flow. net debt reconciliation.
Sales Operating CF Dividends Interest Tax Investments Other Net debt
in T€
Proceeds incl. WC (net) (net) (Income Tax) Neutral
Profit /Loss for the period 26,567 26,567
Depreciation, impairment & reversals of impairment on fix. & fin. assets -67,503 -67,503
Interest income/expense 5,028 5,208
Income from companies accounted for at equity 8,668 8,668
Dividends from companies accounted for at equity 16,300 16,300
Decrease in long-term provisions 419 419
Deferred income tax 14,536 14,536
Operating cash flow 4,015 0 4,015 0 0 0 0 0 0
Increase /decrease in short-term provisions -148 -148
Increase/decrease in tax provisions -22,715 -22,715
Losses/gains on the disposal of assets -11,217 -11,217
Increase /decrease in inventories 1,263 4,003 6,147 -8,887
Increase/decrease in receivables 6,113 30,331 -4,915 -19,303
Increase/decrease in payables 12,676
Interest received 234 234
Interest paid -2,615 -2,615
Other non-cash transactions 8,927 8,927
Cash flow from operating activities -3,467 34,334 -7,230 0 -2,381 0 -28,190 0 0
Proceeds from sale of property, plant and equipment & investment property 3,760 3,760
Proceeds from sale of financial assets 6,500 6,500
Proceeds form the repayment of project financing 30,891 30,891
Investments in intangible assets -
Investments in property, plant and equipment & investment property -11,124 -11,124
Investments in financial assets -13,833 -13,833
Investments in project financing -52,479 -52,479
Proceeds from the sale of consolidated companies 22,371 22,371
Cash outflows from the acquisition of subsidiaries,
less cash and cash equivalents acquired -9 -9
Cash flow from investing activities -13,923 63,513 0 0 0 0 -77,436 0 0
Dividends -23,459 -23,459
Dividends paid out to non-controlling interests -1,620 -1,620
Proceeds from bonds and notes -
Repayment of bonds and notes -
Increase in loans and other financing 112,346 112,346
Repayment of loans and other financing -47,054 -47,054
Acquisition of minority interests -300 -300
Cash flow from financing activities 39,913 0 0 -25,079 0 0 -300 0 65,292
Change to cash and cash equivalents 22,523
Cash and cash equivalents as of 1 Jan 212,384
Currency translation differences -365 -365
Cash and cash equivalents as of 31 December 234,542
Tax paid 25,452 25,452 -25,452
Total: Positions Net Debt Bridge 97,847 18,222 -25,079 -2,381 -25,452 -105,926 -365 65,292 34
UBM Development AG – Investor Presentation 27.08.2020INVESTOR RELATIONS
bonds. overview.
Bond Term Nominal Coupon Book value as of
(in €m) 30 Jun 2020 (IFRS)
2.75% Bond 2019-2025 120.0 2.75% 118.8
3.125% Bond 2018-2023 120.0 3.125% 120.2
3.25% Bond 2017-2022 150.0 3.25% 146.7
4.25% Bond 2015-2020 49.81 4.25% 49.81
Promissory note loans 2016-2021 32.0 3.769% 32.0
Bearer bond 2016-2021 18.5 3.75% 18.3
5.50% Hybrid bond2 Unlimited maturity 100.0 5.50% 98.9
6.00% Hybrid bond2 Unlimited maturity 25.3 6.00% 25.3
1 € 25.16m was exchanged for 2.75% Bond 2019-2025
2 Attributable to equity 35
UBM Development AG – Investor Presentation 27.08.2020INVESTOR RELATIONS
financing structure.
Annual Debt Maturity Profile in €m 1
280
Group Debt Structure1
260
240
Average Cost of Debt:
220
2.8% p.a.
200 147
124
180 Long- & Short-Term
160 Financial Liabilities:
€ 236.0m2
140
(average 2.0% p.a.)
120
100 Bonds:
80 € 485.7m3
120 119
50 131 (average 3.3% p.a.)
60 50
40
20 43
31
15 1 16
0
2020 2021 2022 2023 2024 >2024
Project Financing Bonds Hybrid Capital
1 Data as of 30 Jun 2020 for fully consolidated companies
2 Excluding leasing liabilities
3 Including bearer bonds and promissory note loans
36
UBM Development AG – Investor Presentation 27.08.2020INVESTOR RELATIONS
shareholder structure.
Shareholder Structure Free Float – Geographical Split2
Rest of world
Syndicate Free float 1 Other Europe
5%
8%
Austria
UK 10%
38.8% 40%
49.8%
37%
5.0%
J. Dickinger 6.4% Germany
IGO
Industries Group
As of June 2020
1 Free float including Management Board and Supervisory Board (3.9%)
2 Free float geographical split excluding Management Board and Supervisory Board
37
UBM Development AG – Investor Presentation 27.08.2020INVESTOR RELATIONS
coverage. regular research.
Bank Analyst Price target Recomm. Date
Baader Bank Andre Remke 44.00 Add 3.6.2020
SRC Research Stefan Scharff 44.00 Buy 26.5.2020
M.M. Warburg Simon Stippig 43.80 Buy 27.5.2020
Hauck & Aufhäuser Julius Stinauer 43.00 Buy 28.5.2020
Raiffeisen Centrobank Oliver Simkovic 43.00 Hold 2.6.2020
ERSTE Group Christoph Schultes 40.00 Buy 29.6.2020
Consensus 42.97
Average Share Price Target of € 42.97
38
UBM Development AG – Investor Presentation 27.08.2020INVESTOR RELATIONS
investor relations.
Financial Calendar 2020 & 2021 Shareholder Information
Q3 Report 2020 26 Nov 20 Share price € 29.701
Annual Financial Report 2020 23 Apr 21
Market capitalisation € 221.9m
Record Date – AGM 17 May 21
Number of shares
Q1 Report 2021 25 May 21 outstanding 7,472,180
Annual General Meeting 27 May 21 Ticker symbol UBS VI
Ex-Dividend 2 Jun 21 ISIN AT0000815402
Record Date Dividend 03 Jun 21
IR contact
Dividend Payment 04 Jun 21 Anna Vay, CEFA
Head of Investor Relations & Corp. Communications
Half-Year Report 2021 25 Aug 21 Tel: +43 664 626 1314
Mail: investor.relations@ubm-development.com
Q3 Report 2021 25 Nov 21
1 Closing Price: 20 August 2020 39
UBM Development AG – Investor Presentation 27.08.2020You can also read