HALF YEAR FY2019 RESULTS - 21 February 2019 - CSG
←
→
Page content transcription
If your browser does not render page correctly, please read the page content below

Confidential and Preliminary Draft: For Discussion Purposes Only

HALF YEAR FY2019 RESULTS
21 February 2019

 Presented by      Mark Bayliss, Executive Director & Chairman
                   Julie-Ann Kerin, Managing Director & Chief Executive Officer
                   Ashley Conn, Chief Financial Officer
Key highlights: Transformation delivering growth in H1 earnings
■ Underlying EBITDA of $8.1m; Increase of 76% vs PCP1 of $4.6m
■ Transformation program being successfully implemented:
Right sizing on track: $10m working capital reduction + $7.7m of cost-outs
Organisation realigned with the closure of the Enterprise IT business, and focus on SME sector
Restructured business into Print, Technology and Finance
CSG 2021 Program launched: Cultural transformation underway and 14 key strategic initiatives in progress
■ Technology momentum building with high value technology subscription seats at 24,617 and initial wins with Alibaba partnership
■ Print underpinned by positive performance in Australia, while focus is still on improving performance in New Zealand
■ Key board & executive appointments; Mark Bayliss (Executive Chairman), Ashley Conn (CFO), Chris Mackay (NZ Country Manager), Craig
Bowring (Treasury & Leasing) and currently recruiting a new Head of People and Culture
■ Strengthened balance sheet with leverage reduced to ~1x underlying EBITDA guidance
■ On track to achieve previous underlying FY19 EBITDA guidance of $17.0m - $20.0m
1 All comparisons to H1 FY18 unless otherwise stated
CSG - Business Technology Made Easy 2
Delivering commitments in FY19
Our Commitments Our Actions Status
Restructure the business to focus on SME across Print and Technology Business divisions realigned, with Enterprise IT workforce
Complete
underpinned by Finance exited
New NZ Country Manager, Head of Service, Auckland Sales
Personnel changes in NZ to improve profitability Complete
Manager and removed under-performing sales heads
Cost-out initiatives with total net expected cost savings of ~$7.7m in FY19 Delivered cost savings of ~$5.0m in H1 In Progress
Development and rollout of next generation salesforce.com (Customer Hub) Customer Hub live in Australia
platform delivering best in class customer experience and significant operating New Zealand go live planned for H2 FY19 In Progress
efficiencies
Drive technology cross-sales through integrated digital marketing campaigns Guided Selling module in Customer Hub completed and rolled
In Progress
and a ‘single view’ of the customer. out to create a single view of the customer
Australia Complete
Update commission plans to reward cross-sell between Print and Technology
New Zealand In Progress
Grow lease receivables by driving equipment sales and improve approval
Automation of finance approvals rolled out in Guided Selling In Progress
efficiency
Focus on customer acquisition with our major partners in both Print and
Key initiatives are underway In Progress
Technology
CFO with extensive advisory experience Complete
NZ Country Manager with greater autonomy and Complete
Experienced key appointments accountability Complete
Head of Treasury and Leasing
Head of People and Culture In Progress
Improve working capital through a reduction in inventory by ~$10.0m in FY19 $3.9m reduction achieved in H1, on track for FY19 In Progress
CSG - Business Technology Made Easy 3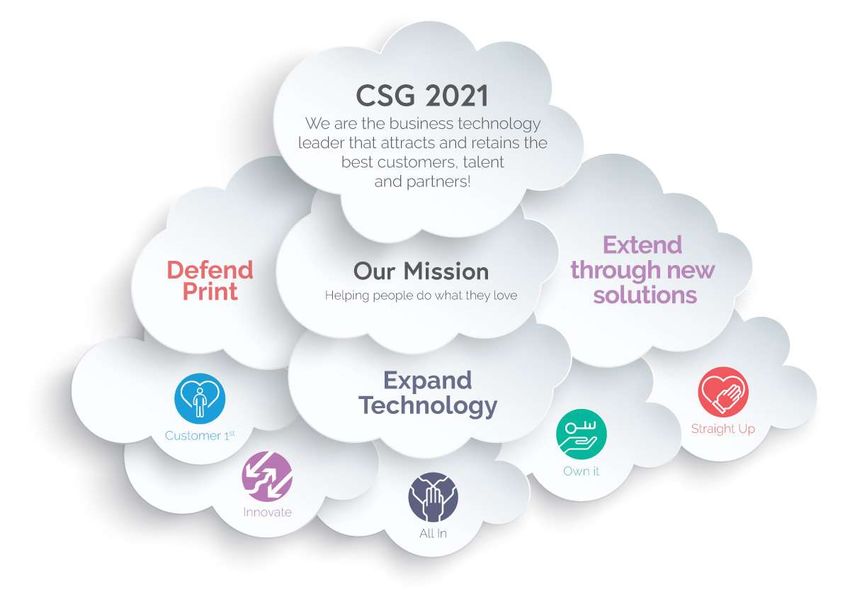
Confidential and Preliminary Draft: For Discussion Purposes Only

CSG – Business Technology Made Easy

                        FINANCIAL OVERVIEW
Benefits from transformation underpin EBITDA growth of 76% to $8.1m
Profit & Loss ■ Revenue down 6.2% to $109.9m (up 1.3% vs H2 FY18)
Technology equipment and subscription revenue up 11.4%
$m H1 FY19 H1 FY18
Lower print equipment sales (17.5%) predominantly driven by New
Revenue 109.9 117.2 (6%) Zealand and (~$1.5m) reduced Enterprise contribution
Underlying EBITDA1 8.1 4.6 76% Print service revenue decline (-5.4%) in line with expectations
Underlying EBITDA margin 7.4% 3.9% ■ Focus on improving the quality of revenue
EBITDA2 7.5 1.6 369% Refocused sales teams by division
Depreciation & amortisation3 (4.3) (3.5) Continued growth of Technology annuity subscription revenue
Net interest expense (1.4) (1.7) Implementing initiatives to maintain Print service revenue
Profit before tax 1.7 (3.6) 147% ■ Underlying EBITDA up 76% to $8.1m
Income tax (0.5) 0.7 Focus on sustainable and scaleable profit growth
Statutory net profit after tax 1.2 (3.0) 143% Benefits from cost reduction program
Underlying NPAT4 3.3 1.9 74%
1 H1 FY19: Before deconsolidation impact of sale of pcMedia ($0.6m), non-cash share issue and LTIP expense $1.3m, and non-recurring expenses of $0.1m; H1 FY18: non-cash LTIP ($0.1m) and non-recurring expenses ($2.9)
2 H1 FY18: Includes ~$1.5m of one-off costs relating to digital display implementation overrun, ~$0.9m of one-off acquisition and legal costs and ~$0.4m of restructuring charges and related costs
3 H1 FY19: Includes additional amortisation of $0.5m in H1 FY19 (before tax effect) in relation to an asset created for historic commissions paid that will be amortised over the next 3 years (as required by AASB 15)
4 H1 FY19: Before deconsolidation impact of sale of pcMedia ($0.6m), non-cash share issue and LTIP expense $1.3m, and non-recurring expenses of $0.1m, historic commission amortisation $0.5m (before tax effect and as required
by AASB 15) and before customer contract amortisation of $1.5m (before tax effect)
CSG - Business Technology Made Easy 5
Earnings growth underpinning operating cash flow growth
Cash Flow ■ Operating cash flow up 18.4% to $9.0m
Reduction in inventory levels by $3.9m as a result of improved
$m H1 FY19 H1 FY18 operational management and forecasting
Underlying EBITDA 8.1 4.6 On track to achieve inventory reduction of $10m by 30 June 2019
Cash impact of non-recurring items (0.2) (2.5) Working capital impact of ($7.7m) due to seasonal timing of
Net lease book working capital 6.4 10.4 creditor payments post 30 June and $2.0m in restructure-related
Change in inventory 3.9 7.3 payments
Change in other working capital (7.7) (10.7) Reduction in net lease book working capital reflecting lower
Net interest and tax paid (1.6) (1.5) print equipment sales
Operating cash flows 9.0 7.6 ■ Capex of $2.5m driven by investment in technology enablers
Capex (2.5) (2.1) (e.g. Customer Hub) to promote efficiency in sales,
Payments for businesses (0.6) (3.6) operations process and enhanced customer experience
Investing cash flows (3.1) (5.7)
Equity raising / shareholder distributions 17.1 (0.2) ■ Payments for businesses consists of deferred payments to
Proceeds / repayment of borrowings (4.1) 0.2 complete the acquisition of CodeBlue in New Zealand
Financing cash flows 13.0 (0.0) ■ Financing cash flows of $13.0m reflects the September capital
FX / Other 0.6 (0.6) raise (net $17.1m)2, partially offset by senior debt repayment
Net movement in cash 19.5 1.3
Opening cash 14.2 20.3
Closing cash 33.7 21.6
Cash conversion1 Cash conversion calculated as adjusted pre-tax operating cash flow / underlying EBITDA. Adjusted pre-tax
1
54% 25%
operating cash flow calculated as reported operating cash flow adjusted for tax paid, net interest paid, non-
recurring cash items and change in lease book working capital
2 Gross proceeds from capital raising were $18m, $17.1m net of associated fees and costs
CSG - Business Technology Made Easy 6Strengthened balance sheet with reduced leverage
Balance Sheet ■ Cash balance $33.7m ($10.0m restricted cash relating to the
31 DEC 30 JUN finance business)
$m Movement
2018 2018
■ Significant progress made to reduce leverage in the business over
Assets
the half
Cash 33.7 14.2 19.5
Receivables 27.8 38.1 (10.3) Corporate debt of $44.4m; down from $48.3m as at 30 June 2018
Lease receivables 229.4 242.2 (12.8) Net Debt of $20.7m vs $42.0m as of 30 June 2018
Inventory 44.8 48.7 (3.9)
Signed in-principle agreement with CBA to extend maturities to 28 Feb
Goodwill & intangibles 57.3 58.2 (0.9) 2020
Other 12.7 13.2 (0.5)
Total Assets 405.7 414.6 (8.9) ■ Decrease in receivables to $27.8m driven by period cross-over for a
Liabilities receipt from the finance company for a material sale in June 2018
Trade & other payables1 46.3 62.6 (16.3)
■ Decrease in lease receivables to $229.4m reflecting lower print
Corporate borrowings 44.4 48.3 (3.9)
equipment sales
Deferred consideration 1.2 5.4 (4.2)
Lease receivable debt 206.1 213.0 (6.9) ■ Successfully executing inventory initiatives, on track to achieve
Other 3.5 2.9 0.6 $10m reduction by 30 June 2019
Total Liabilities 301.5 332.2 (30.7)
■ Trade & other payables reduced to $46.3m due to seasonal timing
Equity
Contributed equity
of creditor payments post 30 June, a $5.5m pay-out to finance
232.2 213.4 18.8
company relating to material sale noted in Receivables and $2.0m
Retained earnings & reserves (143.0) (145.9) 2.9
in restructure related payments
Minority Interest 15.1 14.9 0.2
Total Equity 104.2 82.4 21.7 ■ Deferred consideration reduced as final CodeBlue earn-outs paid
and pcMedia business sold
CSG - Business Technology Made Easy 1 Includes provisions 7Cash flow focused on reducing leverage
Net Debt Leverage ■ Net debt of $20.7m as at 31 December 2018
5.0 Represents ~1.0x net debt leverage based on reaffirmed
4.1x underlying EBITDA guidance
4.0
■ Further deleveraging to occur led by the achievement
3.0
of the underlying EBITDA guidance and ongoing
Leverage at Guidance inventory reductions
2.0
1.2x 1.0x
1.0
0.0
Net Debt Leverage at 30 Net Debt Leverage FY19 Net Debt Leverage FY19
June Low end of Guidance High end of Guidance
2 3
1Net Debt excluding restricted cash of $10.0m
2 Adjustedfor $2.1m movement in restricted cash
3 Includes
trade & other payables seasonal movement and to bring creditors back to terms,
CSG - Business Technology Made Easy and excludes restructure related payments 8Confidential and Preliminary Draft: For Discussion Purposes Only
CSG – Business Technology Made Easy
SEGMENT PERFORMANCE
In the H1 FY19 result, CSG has for the first time reported its segments as Technology, Print, Finance and Other given the operating restructure
announced in July 2018. The operating restructure included the closure of certain Enterprise operations and a strategic refocus on the SME
sector. While H1 FY18 information is provided for comparative purposes, the business was not operated along these segmental lines in H1
FY18. In order to present comparative information, Management has prepared H1 FY18 segmental information consistent with H1 FY19.Technology as a Subscription gains momentum
Technology – Summary financials
Revenue ($m) H1 FY19 H1 FY18 Variance ■ CSG’s innovative Technology as a Subscription model
continues to gain momentum with subscription revenue
Technology equipment 7.0 7.1 (7.9%) growth of 18%
Technology subscription 13.7 12.0 18.1%
■ Technology Other, predominantly professional services
Technology other 5.4 4.2 10.2%
related to implementation and consulting services, grew 10%
Total Technology revenue 26.1 23.4 11.4%
■ Continue to invest in the Australian technology sales team
EBITDA 1.8 2.2 (19.8%)
following closure of the Enterprise IT business
EBITDA margin 6.9% 9.4%
EBIT
■ This investment will have a short term EBITDA margin impact
1.5 2.1 (28.4%)
for FY19, with a plan in place to restore EBITDA margin to
EBIT margin 5.8% 9.0% FY18 levels in FY20
CSG - Business Technology Made Easy 10Technology continues to gain traction in the SME space
Seats Added ■ Total subscription seats added in H1 FY19 were lower than
4,000 3,644 prior periods following the closure of the Enterprise IT
business
3,000 2,691
1,859 ■ In FY18 Enterprise contributed ~1,600 seats per half
2,000 1,333 ■ The Technology business was refocused on subscription sales
to the SME market in Australia and New Zealand:
1,000 2,291
1,785
1,358
New SME seats up 69% on H2 FY18
-
H1 FY18 H2 FY18 H1 FY19 New SME seats up 28% on H1 FY18
SME Seats Added Enterprise Seats Added
■ 5 Year Term Annuity Subscription Value has increased by:
Subscription Seats Dec 2018 Jun 2018 Dec 2017 9.1% on June 2018
5 Year Term Annuity Subscription Value1 $135.9m $124.6m $117.8m 18.1% on December 2017
Exiting MRR2 $2.3m $2.1m $2.0m ■ Decline in ARPU since Dec 2017 primarily due to mix of new
Seats 24,617 22,326 19,635 subscriptions sold including Enterprise Comms sales which
have a lower ARPU than Managed IT subscriptions
ARPU ~$92 ~$93 ~$100
■ pcMedia sold3 to focus on high value subscriptions
1 5 Year Term Annuity Subscription Value calculated as number of subscriptions multiplied by the ARPU (average
revenue per subscription) multiplied by average contract term of 5 years
2 MRR calculated as number of subscriptions at the end of the period multiplied by the ARPU
3 Sale of pcMedia results in reduction in low value seats of ~30,000 low value seats and ~1,200 high value seats
CSG - Business Technology Made Easy 11Print & Display: Australia leading, New Zealand transformation underway
■ Lower print equipment sales, with the reduction driven by New
Print & Display – Summary financials Zealand and the exit of the Enterprise business in Australia
Revenue ($m) H1 FY19 H1 FY18 Variance ■ Transformation of New Zealand print sales force is underway. The
Print equipment 24.5 29.7 (17.5%) sales force has been restructured to remove underperformers and
Display equipment 7.5 6.7 12.0%
recruit additional high performing print sales resources
Print service 36.0 38.0 (5.4%) ■ Australia is performing well with higher margin SME print
equipment sales up 8%, offset by reduced contribution from the
Other print & display 4.7 6.7 (29.0%)
Enterprise business
Total Print & Display revenue 72.7 81.1 (10.3%)
■ Higher display equipment sales being driven by focused sales
EBITDA 4.3 (2.1) 304.8% team in Australia and a deeper referenceable display base
EBITDA margin 5.8% (2.6%)
■ Some key wins in Display with multi-location retail and food and
EBIT 2.2 (3.8) 157.9% beverage customers
EBIT margin 3.1% (4.7%)
■ Print and Display SME transactions per sales staff are up 25% on
H2 FY18, reflecting improved productivity of focused print and
Transactions per sales head has increased driven by display only sales force
Australian performance
25
20 ■ The gains have been driven in the Australian sales force with
20
16 transactions per sales staff up 31% on H2 FY18
15
15
■ Print service revenue decline in line with expectations but
10 initiatives in place to mitigate decline in revenue and margin
5 ■ Continued to deliver high quality customer service with a strong
0 in-field NPS1 score of 73
H1 FY2018 H2 FY2018 H1 FY2019 1Net Promoter Score (NPS) is a method of measuring customer loyalty. To calculate
NPS, customers are categorised as “Promoters”, “Passives” or “Detractors” based on
how likely they would be to recommend CSG to a friend or colleague. The percentage of
Detractors is then subtracted from the percentage of Promoters.
CSG - Business Technology Made Easy 12Finance: Enabling customer ownership and “technology as a
subscription” strategy
Finance – Summary financials
KPIs H1 FY19 H1 FY18 Variance ■ Lower revenue and receivables balance reflects lower print
equipment sales
Finance revenue 12.2 13.4 (8.7%)
■ Diversified industry and geographical exposure resulting in
EBITDA 3.6 3.8 (6.4%) underlying bad debts as a percentage of average lease
EBITDA margin 29.5% 28.4% receivables continuing at less than 0.50% in FY19
EBIT 3.5 3.6 (4.0%) ■ Existing facilities in Australia and New Zealand have
approximately $60m of additional capacity and both facilities
EBIT margin 28.6% 27.2%
have maturity dates in April 2021
Closing receivables ($m) 229.3 251.9 (9.0%)
■ Improve efficiency through automation of the approval process,
Underlying PBT 4.3 4.8 (12.5%) that has been rolled out in Customer Hub Guided Selling
Underlying ROE 53% 55% ■ New head of Treasury and Leasing appointed in October 2018,
Bad debtConfidential and Preliminary Draft: For Discussion Purposes Only
CSG – Business Technology Made Easy
STRATEGIC INITIATIVES
UNDERPINNING GROWTHCSG 2021 Transformation Program CSG - Business Technology Made Easy 15
Cultural change program underway
                                      ■   Following the completion of the FY18 strategic review, the
                                          need to re-invigorate our culture and better engage with our
                                          staff was identified

                                      ■   A series of “Head” and “Heart” programs have been launched

                                      ■   Executive Chairman, CEO and CFO undertook a strategy and
                                          culture roadshow of all major branches in Australia and New
                                          Zealand

                                      ■   ~100 employees attended 2 group workshops to develop and
                                          own the CSG strategy, vision, mission and values

                                      ■   Key strategic initiatives action plan implemented with 14
                                          major projects currently underway

                                      ■   “CSG Champions” and “CSG Gurus” to lead and maintain
                                          cultural change

                                      ■   Workshops being delivered in H2 FY19 on mission and values by
                                          CSG Champions

CSG - Business Technology Made Easy                                                               16
Key strategic initiatives
1. DEFEND 2. EXPAND 3. EXTEND
Through growth of
Through cross sell technology Through new business solutions
KEY HIGHLIGHTS
Print and Finance
1.1 Increase market share & 2.1 Initiate territory sales 3.1 Develop security practice 1.1 Target geographies for market
growth in Australia and New planning with print sales share growth finalised
Strategic growth pillars
Zealand through customer teams 3.2 Build or acquire new adjacent
acquisition programs with key practices (e.g. professional 2.1 Team business plans
vendors 2.2 Improve sales productivity of services and/or CRM) completed
technology sales team
1.2 Defend existing customer base 3.3 Grow Alibaba practice 3.1 Security practice project
through increasing customer 2.3 Continue to source world class initiated
stickiness by cross selling vendor relationships
technology 4.1 Go live of Customer Hub
1.3 Increase service revenue and
4.2 Culture Champions trained
margin through key initiatives
and spreading the message
1.4 Increase business process
automation software sales 4.3 Customer data project
and implementation initiated
Enablers
4.1 Systems & processes (Customer Hub) – Implement and adopt best in class systems and processes
4.2 Culture – Define and embed an improved culture to bring our vision, strategy and values to life
4.3 Customer Data Project
4.4 Brand Evolution
CSG - Business Technology Made Easy 17Confidential and Preliminary Draft: For Discussion Purposes Only
CSG – Business Technology Made Easy
OUTLOOKKey priorities for H2 FY19
■ Continue to invest in the Technology practice:
Grow revenue by promoting cross-sell into print customer base with unified geography based plans across the print and technology
sales force
Leverage key industry partnerships like Alibaba
■ Increase New Zealand print equipment performance through the addition of high performing sales heads
■ Continue to develop Customer Hub platform to deliver premium customer service and operational efficiencies
■ Maintain CSG 2021 momentum:
Continue our cultural change journey
Execute our 14 strategic initiatives
■ Finalise customer data survey and leverage insights to better align products and sales strategies
■ Deliver FY19 cost savings of $7.7m
■ Deliver FY19 working capital benefit through $10m inventory reduction
■ Appoint new Head of People and Culture and make further key appointments across the business
CSG - Business Technology Made Easy 19FY19 guidance reaffirmed
■ Reaffirmed FY19 underlying EBITDA guidance of $17.0m to $20.0m
■ Other initiatives on track:
$7.7m cost saving initiative
$10m inventory reduction
$22.5m to $25.5m net movement in cash (including equity raising proceeds)
CSG - Business Technology Made Easy 20CSG – Business Technology Made Easy
QUESTIONS
2
1CSG – Business Technology Made Easy
APPENDICESC S G ’ s Technology as a Subscription solution suite is unique and
first-to-market
Print & Display Finance Technology
$
Multifunction Equipment Total Office Desktop as a
Devices Managed Finance Laptop, Microsoft Office Subscription
Print, copy, scan Print In-house equipment
software, storage, phone handset, Laptop, Microsoft Office software&
(including on cloud communications and storage and service & operational
financing for print and
going service) operational support support
technology
Video
Conferencing
Zoom software
Digital Interactive Boardroom as a Cloud Telephony
Displays Whiteboard Subscription Unified communications solutions
Print, copy, scan Zoom conferencingsoftware includingnational and international
call through 8x8
C S G PartnersAustralia and New Zealand
Print & Display Technology Finance
• Over 39,000 devices under management • Leading provider of technology as a subscription • Enabler of the Print and Technology Strategy
to the SME sector
• ~15,000 customers • Lease receivables currently at $229m
• • 24,617 high value technology subscriptions
One of the largest non-OEM fleets in the world • ~95% of all Print and Technology transactions
• National presence in Australia (~4% market share)
• Partnering with leading global vendors, e.g. HP, financed by CSG finance company
Samsung, Alibaba, Zoom
and New Zealand (~25% market share) • White label finance provider for partners
------------------- ------------------- -------------------
• Maintain print service decline at current levels (~-6%) • Contribute 50% of Revenue and EBITDA • Continue to support growth in technology and print
equipment sales
• Acquire new customers by developing new sales • Sustainable annuity revenue
channels
• Improve Cross-selling to existing customers
• Improve print equipment performance in New
Zealand by increasing sales productivity
• EBITDA Margins to increase with leverage of
sales forceImportant Notice and Disclaimer This presentation has been prepared by CSG Limited (ABN 64 123 989 631). Presentation is a summary only The information contained in this presentation is in summary form only, and is subject to, and should be read in conjunction with, the financial accounts. No reliance on this presentation Neither CSG Limited, nor its officers, employees, agents, contractors, advisors or any other associated person (collectively “Associated Persons”), represents or warrants, in any way, that this presentation is accurate, complete or up-to-date (including in relation to any projections, forecasts, estimates, prospects and returns, or any omissions from this presentation). CSG Limited is not required to keep any information contained in this presentation updated. This presentation is for information purposes only and is not investment advice or a recommendation, nor does it consider any individual’s objectives or circumstances. Any information or opinions expressed in this presentation are subject to change without notice. Investors are encouraged to make an independent assessment of CSG Limited. No liability This presentation was prepared with reasonable care and in good faith. To the maximum extent permitted by law, CSG Limited and its Associated Persons each expressly disclaims and excludes all liability that may arise from, or is connected to, this presentation, or the use of this presentation, or any other written or oral information provided by or on behalf of CSG Limited. Forward-looking statements Certain statements in this presentation are forward-looking statements (“Statements”) based on information available to CSG Limited at the date of this presentation, relating to the future. The Statements are not historical facts, and are based on current views, estimates and projections of CSG Limited. The Statements involve risks, uncertainties and factors which are beyond CSG Limited’s control, and may cause the actual results of CSG Limited to be materially different from future results implied by the Statements. The Statements are not guarantees or predictions of future performance. Neither CSG Limited nor its Associated Persons make any representation, assurance or guarantee that any events, expressed or implied, in the Statements will actually occur, unless otherwise required by law. CSG Limited is not required to update the Statements to reflect any change in circumstances that arise after release of this presentation. Past performance is not an indicator of future performance, and CSG Limited shareholders are cautioned against relying on any such Statements. Non-IRFS Financial Information This presentation includes certain non-IFRS financial information including “underlying EBITDA”, “underlying NPAT”, “excluding LTIP” and “excluding customer contracts and goodwill”. This information is used internally by management and the Board to assess the performance of the business, make decisions on the allocation of resources and assess operational management. The non-IFRS financial information has not been subject to audit or review. Not an offer of securities None of the information contained in this presentation constitutes an offer of, or a proposal or an invitation to make an offer of, any security. CSG - Business Technology Made Easy 25
You can also read