HALF YEAR REPORT - NEW OPPORTUNITIES ON THE HORIZON THE ART OF COMMON SENSE

Page created by Virgil Flores
 
CONTINUE READING
HALF YEAR REPORT - NEW OPPORTUNITIES ON THE HORIZON THE ART OF COMMON SENSE
HALF YEAR REPORT

                          THE ART
                        OF COMMON
                           SENSE

      NEW OPPORTUNITIES ON THE HORIZON
                   JULY 2015 | www.skagenfunds.com
HALF YEAR REPORT - NEW OPPORTUNITIES ON THE HORIZON THE ART OF COMMON SENSE
LEADER

    Patience and
    lessons learned                                                                                                NEW EQUITY
                                                                                                                     FUND

In an increasingly globalised world, there is more    is true, however, and this can give rise to a period   I would like to highlight the
pressure than ever on fund managers to react to       of reflection and soul searching, also in SKAGEN.      successful launch of our new
events and quickly turn around their investment           Our recently appointed Investment Director,        global equity fund in the
portfolios.                                           Ole Søeberg, has spent some time this spring           quarter. SKAGEN Focus is a
    The alternatives seem to be either to chase       looking at the investment process and has made         high concentration fund with
the current events or simply to give up and buy       a few refinements that will strengthen the internal    around 35 core holdings. The
an index fund. In our view, however, chasing the      processes. In the long run, however, it is still the   portfolio managers apply the
best markets, such as China, or giving up will        operations in a company and how much one pays          same investment policy as
not allow you create the best returns over time.      for these that create the value and cause the          our other funds, investing in
    The well-known value investor, Warren Buf-        share price of the company to increase. That is        undervalued, under-resear-
fett, once observed that: “The stock market is a      an important point to remember now as we enter         ched and unpopular compa-
device for transferring wealth from the impatient     the second half of 2015.                               nies. They have a bottom-up
to the patient”. His words seem to hold true more         The rest of the year may well be an exciting       perspective and concentrate
than ever now that the markets have entered a         period with a potential interest rate hike in the      on specific companies and
period in which value and company focus is in         US and new economic developments in many               their intrinsic value. Being
such short supply.                                    emerging markets and Europe, amongst other             benchmark-agnostic, their
    In a recent report on active and passive inves-   things. In the short term, the return of all our       investment decisions will be
ting, the fund research company Morningstar           equity funds may be influenced more by fluctu-         made independently of the
concluded that value management has a greater         ations than what the companies actually deliver.       benchmark index, with the aim
chance of long-term success than other types              The valuation of many emerging market com-         of generating superior returns
of active management. We are in no doubt that         panies is now attractive compared with those in        over time.
common sense; coupled with an applied value           developed markets and an improvement in global            The portfolio may have a
focus and stock picking form the best premise         economic growth should improve earnings pro-           relative bias towards mid-sized
for creating excess returns over time, as it has      spects for companies in many of these countries.       companies, given the portfo-
in the past.                                              We wish you a pleasant summer.                     lio managers´ experience of
    At times, it may seem as though the opposite                                                             finding attractive investment
                                                                                                             opportunities among such
                                                                                                             companies. You can find out
                                                                                                             more at www.skagenfunds.
                                                                                                             com/focus and read the port-
                                                                                                             folio managers´ first report
                                                                                                             on the fund on page 27 of this
                                                                                                             report.

                                                                                                                           – Leif Ola Rød
                                                                                                                                      CEO

2    SKAGEN F UNDS HALF Y EA R REPORT | 2015
HALF YEAR REPORT - NEW OPPORTUNITIES ON THE HORIZON THE ART OF COMMON SENSE
CONTENT

                                                               27
                                                               Portfolio managers Filip Weintraub and Jonas Edholm of the newly launched SKAGEN Focus that makes its debut in the
                                                               Market Report

                                                                                                                                                                                            Photos: Bloomberg
 10                                                             34
                                                               Corporate bond fund SKAGEN Credit has bought bonds in INEOS, one of the world’s largest petrochemical companies.
Bonheur/Ganger Rolf must now be seen more as a company
                                                               Pictured here are granules manufactured at their facility in Cologne.
within renewable energy that also has an option on a future
improvement in the rig market.

  LEADER                                                      EQUITY FUNDS                                                  FINANCIAL
  Patience and lessons learned
  Leif Ola Rød
                                                      >2      SKAGEN Vekst
                                                              Slight improvement
                                                                                                              > 10          STATEMENT
                                                                                                                            Half year accounts                                       > 36
                                                              SKAGEN Global                                   > 14
  PORTFOLIO                                                   Uphill struggle                                               Return and risk measurements                             > 39

  MANAGERS´ REPORT                                            SKAGEN Kon-Tiki                                 > 18
                                                              Staying the course

                                                              SKAGEN m²                                       > 23
  INTRODUCTION                                                Rainy quarter
                                                                                                                            SKAGEN seeks to the best of its ability to ensure
                                                                                                                            thatall information given in this report is correct,
  How to spend it?                                    >5                                                                    however, makes reservations regarding possible
  Corporate cash piles have                                   SKAGEN Focus                     > 27                         errorsand omissions. Statements in the report re-
  increased significantly in the                              Hunting for exceptional investments                           flect theportfolio managers’ viewpoint at a given
                                                                                                                            time, andthis viewpoint may be changed without
  past five years, but what should                                                                                          notice.
  management do with the money?
                                                                                                                            The report should not be perceived as an offer
                                                              FIXED INCOME                                                  orrecommendation to buy or sell financial in-
                                                                                                                            struments. SKAGEN does not assume respon-
                                                              FUNDS                                                         sibility for direct or indirect loss or expenses
                                                                                                                            incurredthrough use or understanding of the re-
                                                              Fixed income comment                            > 31          port. SKAGEN recommends that anyone wishing
                                                              Long-term interest rates:                                     to invest in our funds contacts a qualified custo-
                                                              up, sideways or down?                                         mer adviser by telephone on +47 51 80 37 09 or
                                                                                                                            by email at contact@skagenfunds.com.

                                                              SKAGEN Tellus                                   > 32
                                                              Headwinds

                                                              SKAGEN Credit                                   > 34
                                                              Unrest creates opportunities

                                                                                                                             S K A G E N F U N DS H A LF Y E A R RE PORT | 2 0 1 5
                                                                                                                                                                                      3
HALF YEAR REPORT - NEW OPPORTUNITIES ON THE HORIZON THE ART OF COMMON SENSE
SKAGEN FUNDS

Returns
                                                                                         SKAGEN FOCUS

                                                                                         Lead manager: Filip Weintraub Start: 26 May 2015

                                                                                         Return since start*
                                                                                          10

    The following tables show the returns for SKAGEN’s                                        5

    funds versus their respective benchmarks in euro.
    The figures are updated as of 30.06.2015                                                  0

    Unless otherwise stated, all performance data in this report is in euro, relates      -5
    to class A units and is net of fees.                                                                               -4.7%

                                                                                         -10
                                                                                                       -7.6%

         Equity Fund                    Fixed Income Fund                                             SKAGEN Focus             MSCI All Country World Index

                                                                                         * Since inception on 26 May 2015

SKAGEN GLOBAL                                                                            SKAGEN VEKST

Lead manager: Knut Gezelius Start: 7 August 1997                                         Lead managers: Ole Søeberg and Geir Tjetland Start: 1 December 1993

Return past 12 months                                Average annual return since start    Return past 12 months                                     Average annual return since start
                                                                                         20                            18.8%                        20
25                        24.0%                     20

                                                                                         15                                                         15
                                                                                                                                                                   14.4%
                                                              15.2%
20                                                  15
                                                                                                                                                                               10.3%
15                                                                                       10                                                         10
                                                    10
           10.2%
10
                                                                             4.3%         5            4.4%                                             5
                                                     5

    5

                                                     0                                    0                                                             0
    0
                                                                                                      SKAGEN Vekst              MSCI Nordic/MSCI AC ex Nordic
                                                    -5
-5
       SKAGEN Global
* The benchmark index priorMSCI All Country
                           to 1/1/2010   wasWorld
                                             the Index
                                                  MSCI (Daily
                                                        WorldTraded
                                                              Index Net Total Return)*    * Effective 1/1/2014, the fund’s investment mandate changed. Read more on page 13.
                                                                                          The benchmark index prior to 1/1/2010 was the Oslo Stock Exchange Benchmark
                                                                                          Index (OSEBX).

SKAGEN KON-TIKI                                                                          SKAGEN m²

Lead managers: Kristoffer Stensrud and Knut Harald Nilsson Start: 5 April 2002           Lead managers: Michael Gobitscheck and Harald Haukås Start: 31 October

                                                                                         Return past 12 months                                Average annual return since start
    Return past 12 months                            Average annual return since start
                                                                                               25                       24.7%
                                                                                                                                                   20
    20                                                   20
                            16.5%                                                              20

    15                                                   15
                                                                  14.8%                                  16.2%                                     15                      13.7%
                                                                                               15
                                                                                                                                                   10          7.6%
    10                                                   10                    8.6%
                                                                                               10

                                                                                                                                                    5
     5                                                    5                                       5
             2.0%
                                                                                                  0                                                 0
     0                                                    0

                                                                                               -5                                                  -5
    -5                                                   -5
                                                                                                        SKAGEN m²               MSCI All Country World Index Real Estate IMI
            SKAGEN Kon-Tiki         MSCI Emerging Markets Index

SKAGEN CREDIT EUR                                                                        SKAGEN TELLUS

Lead manager: Ola Sjöstrand Start: 30 May 2014                                           Lead manager: Torgeir Høien Start: 29 September 2006
Return past 12 months                               Average annual return since start    Return
                                                                                         20     past 12 months                                Average
                                                                                                                                              20      annual return since start

    15                                        15
                                                                                         15                                                   15
                                                                                                                      13.4%
    10                                        10                                         10                                                   10
                                                                                                       7.0%
                                                                                                                                                            5.9%
    5                                          5                                          5                                                    5
                                                                                                                                                                       5.0%

                        0.1%                              -0.1%       0.1%
                                                                                          0                                                    0
    0                                          0
           -0.2%
                                                                                          -5                                                  -5
    -5                                        -5

           SKAGEN Credit EUR      3 Month EURIBOR                                                     SKAGEN Tellus           J.P.Morgan Broad Index Unhedged (EUR)*

                                                                                         * The benchmark index prior to 1/1/2013 was Barclay’s
                                                                                           Capital Global Treasury Index 3-5 years.

4        SKAGEN F UNDS HALF Y EA R REPORT | 2015
HALF YEAR REPORT - NEW OPPORTUNITIES ON THE HORIZON THE ART OF COMMON SENSE
Portfolio managers´ report

                                                                                                              Introduction
                                                                                                              > 	SKAGEN equity funds returned 3-10% in the
                                                                                                                   first of half 2015, measured in euro. Our bond
                                                                                                                   funds delivered 1.5-2.5%.

                                                                                                              > 10-year government bond yields spiked up-
                                                                                                                   wards in 2Q 2015 from abnormally low levels.

                                                                                                              >	
                                                                                                                M&A activity has been heady in 2015 and
                                                                                                                   could beat the previous annual record set
                                                                                                                   in 2007.
Photo: Bloomberg

                                                                                                              > Global equities are up 3% year to date in
                                                                                                                   USD. The Chinese stock market rose sharply
                                                                                                                   hitting a total market cap of over USD 10
                   Photo: Bloomberg

                                                                                                                   trillion (10,000bn), despite lower economic
                                                                                                                   growth, before falling back again. The US
                                                                                                                   market is USD 25 trillion and the total global
                                       USA. After 9 consecutive positive quarters, the S&P index                   market is USD 73 trillion.
                                       fell by 0.2% in the quarter. SKAGEN Global continues to be
                                       strongly underweight US equities which currently consti-
                                       tutes 36% of the fund.

                                                                                                                                                                                                                      Photo: Bloomberg

                                                                                                                                                                    Volatility. Chinese local shares
                                                                                                                                                                    stood out as a positive in the second
                                                                                                                                                                    quarter, with a 28% increase. The
                                                                                                                                                                    frothy valuations reversed somewhat
                    Photo: Bloomberg

                                                                                                                                                                    at the end of the quarter. Pictured:
                                                                                                                                                                    a display showing the Hang Seng
                                                                                                                                                                    Index figure in Hong Kong. On 8 July
                                                                                                                                                                    2015, the benchmark plunged the
                                                                                                                                                                    most since the global financial crisis
                                                                                                                                                                    rippled across Asia.
                                       Greek tragedy. Greece has failed to adapt to the new reality of prudent financial management needed in the post financial
                                       crisis era. Pictured: queues outside Bank of Greece, Athens.

                                                                                                                                                          S K A G E N F U N DS H A LF Y E A R RE PORT | 2 0 1 5
                                                                                                                                                                                                                  5
HALF YEAR REPORT - NEW OPPORTUNITIES ON THE HORIZON THE ART OF COMMON SENSE
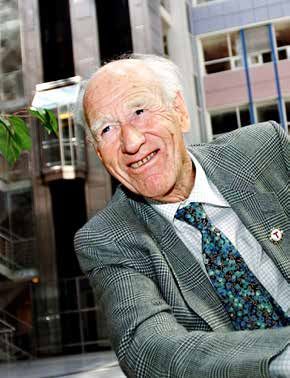
PORTFOLIO MANAGERS´ REPORT

How to spend it?
Corporate cash piles have increased significantly in the past five years,
but what should management do with the money?
– Ole Søeberg
Chief Investment Of f icer

Seven years ago, the financial crisis chang-       ving competitiveness and market share.             using the 2014 figure for US companies
ed market behaviour overnight. The hou-                Taking a global view and using the             (USD 550bn) among which buybacks are
sing bubble burst, M&A activity dried up           MSCI AC World Index as a proxy, the 2,500          most common.
and financial assets plummeted in value.           most widely followed global companies                 Once the shares have been bought,
Companies were suddenly compelled to               are on track to generate USD 32 trillion of        we would prefer that they were cancel-
rethink their liquidity and balance sheet          revenues in FY 2015, equivalent to app-            led to avoid diluting long-term share-
strategy amid a squeeze on lending. Banks          roximately 40% of global GDP, and USD 3            holders. Unfortunately some companies
too had to rebuild capital and their own           trillion of net income.                            keep them to sell later on or give them
balance sheets. Fortunately, lower global                                                             to employees who then sell them back
interest rates made it possible for many                                                              into the market.
companies to re-finance their debt on
better terms, often stabilising and even             MSCI WORLD AC INDEX                              Mergers and acquisitions (M&A)
improving cash flows.                                                                                 Company cash can also be spent on
                                                                          2009, trl $   2015, trl $
    Since then, the global economy has               Revenues                     27            32
                                                                                                      growing a business, typically by investing
chugged along at a decent, if not impres-            Net Income                  1.4           2.9    in new plants, upgrading facilities or deve-
sive, pace and companies have changed                Dividend                    0.8           1.2
                                                                                                      loping a new product or service. However,
                                                     Market Cap                   32            47
the way they use their cash. Some firms                                                               it takes time for the benefits of this invest-
and regions, such as Greece, have failed                                                              ment to materialise. So it can be quicker to
to adapt to the new reality, but broadly                                                              buy another company that seems to offer
speaking prudent financial management                                                                 the sort of transformation that is required.
has been the order of the day.                     Dividends and share buybacks                       However, any type of M&A and investment
    Since 2012, we have seen cash flows            The proportion of this net income distri-          should only be undertaken if it adds value,
that were previously used to reduce net            buted to shareholders via dividends takes          i.e. generates a higher return than the cost
debt or held in reserve being redirected           USD 1.2 trillion out of the total cash pile,       of the capital invested plus the “risk-free”
towards three main areas (or a mix of the-         excluding the impact of cross holdings.            rate (often the rate of interest from govern-
se): dividends and stock buybacks; acqui-          Company share buybacks account for a               ment bonds).
sitions (M&A) and investments into impro-          further USD 700bn, based on estimates                  Since 2012, cash has increasingly been

   6     SKAGEN F UNDS HALF Y EA R REPORT | 2015
HALF YEAR REPORT - NEW OPPORTUNITIES ON THE HORIZON THE ART OF COMMON SENSE
used to finance M&A. The previous high                             private equity players. The graph below                        competition for assets and pushes prices
was 2007 when total deal value reached                             shows global M&A activity since 2003. It                       up. In the past 10 years, IPO and secondary
USD 4.2 trillion (see Bloomberg data                               is interesting to note that the more bullish                   deal activity has been running at between
below). In the first half of 2015, the total                       periods in the stock market coincide with                      USD 0.6 and 0.9 trillion a year. Here too it
value was USD 2.5 trillion, meaning this                           periods of high M&A activity.                                  appears that 2015 is on track for a record
year is likely to reach or exceed the previous                         It is also worth noting that as private                    breaking year.
record – good news for investment bankers                          equity firms exit from companies via stock
and lawyers.                                                       market listings (known as initial public offe-                 Investing in the business
In addition to corporate bidders, we have                          rings or IPOs) they tend to recycle it back                    Share prices have increased a lot in recent
also seen activity from a large pool of                            into other M&A. This in turn creates more                      years, so it is harder to buy a company that
                                                                                                                                  can add value. Hence, you might expect
 GLOBAL M&A ACTIVITY SINCE 2003                                                                                                   investment in business and research and
  Trillion $                                                                                                       Thousands
                                                                                                                                  development (R&D) would be the prefer-
      6                                                                                                                      30   red option for enhancing a company’s
                                                                                                                                  value. This has been a lower priority for
      5                                                                                                                      25
                                                                                                                                  many companies since the financial cri-
      4                                                                                                                      20   sis, however, initially due to a need to
                                                                                                                                  strengthen their finances and later to an
      3                                                                                                                      15
                                                                                                                                  increasingly short-term attitude by the
      2                                                                                                                      10   market towards results. In our view, a good
                                                                                                                                  management team making the right invest-
      1                                                                                                                      5
                                                                                                                                  ment in organic growth typically creates
      0                                                                                                                      0    the most long-term value.
           2003     2004     2005       2006     2007    2008   2009   2010   2011   2012   2013      2014 2015*                     Given the recent increases in IPOs
               Volume      Deal count    *Year to date                                      Source: Bloomberg Finance L.P.
                                                                                                                                  and M&A, we sense a lowering of the
                                                                                                                                  caveat emptor principle (i.e. taking pro-
                                                                                                                                  per account of the risks involved) and the

                                                                                                                                     S K A G E N F U N DS H A LF Y E A R RE PORT | 2 0 1 5
                                                                                                                                                                                             7
HALF YEAR REPORT - NEW OPPORTUNITIES ON THE HORIZON THE ART OF COMMON SENSE
use of more aggressive tactics – factors                       Animal spirits                                          so the returns available from deposits and
that have historically led to an increase in                   So-called ‘animal spirits’ may be one rea-              government bonds compared to equities
overall risk. A McKinsey survey showed                         son. Human behaviour is driven by recent                would continue to favour equities. That is
that corporate M&A is most successful                          experience. After five or six years of a bull           unchanged over the last five years, but the
when executed during tough economic                            market, many investors feel they are finan-             equity advantage has reduced as stock pri-
conditions, which often coincide with                          cial geniuses, as do listed companies that              ces have increased.
bear markets and inexpensive asset pri-                        have seen their stock multiply.                             Nonetheless, we continue to find pock-
ces, as you might expect. Why then do                             In this sort of environment, we prefer               ets of value among businesses that have
those engaged in corporate activity not                        to stand back from the noise and take a                 been overlooked. These sorts of companies
learn from past experience and tread with                      long-term view. The pace of global economic             tend to stick to their knitting and let others
caution in years such as 2007 and 2015?                        growth and inflation levels suggest that                do M&A at frothy valuations. They also tend
                                                               interest rates will remain relatively modest,           to apply common sense when considering
                                                                                                                       how best to invest their cash. Given the cost
 INVESTMENT HARDER-HIT BY THE CRISIS THAN GDP IN OECD                                                                  of financing is likely to remain lower for long-
                                                                                                                       er, we could start to see more spending on
     %                                                                                                           %
    110                                                                                                          110
                                                                                                                       R&D and infrastructure. This in turn would
                                                                                                                       broaden economic expansion and increase
    105                                                                                                          105
                                                                                                                       global growth, rather than simply adding
    100                                                                                                          100   to share valuations, and create favourable
     95                                                                                                          95    conditions for many of our holdings.

     90                                                                                                          90

     85                                                                                                          85

     80                                                                                                          80
          2000        2002           2004        2006   2008      2010          2012            2014
             Total real investment    Real GDP                       Source: OECD Economic Outlook 97 database

8         SKAGEN F UNDS HALF Y EA R REPORT | 2015
HALF YEAR REPORT - NEW OPPORTUNITIES ON THE HORIZON THE ART OF COMMON SENSE
SKAGEN portfolio managers always strive to achieve the best possible absolute and risk-adjusted
      returns. However, since summer 2014, when the US dollar started to strengthen and a few weeks
      later the oil price began to fall, our equity funds have lagged their benchmark indices. This has been
      mostly due to their lower exposure to US dollar assets and higher exposure to emerging markets that
      tend to be more driven by commodity prices. Although we are disappointed by this relative underper-
      formance, as long term investors, we feel it is crucial not to fall into the trap of chasing shorter term
      macro movements in financial markets.

      Instead, we prefer to adhere to our proven investment philosophy and common sense approach,
      which has generated substantial returns over time, while also taking steps to review everything we
      do and making sure we improve where we can. The result of this review has been a honing of our
      investment process in order to optimise each step. We believe this greater focus on methodology
      and the lessons learned from past investment decisions (positive and negative) will lead to superior
      performance in future.

second quarter pit stop
– more or less as planned
Global equities were flat in the period in USD and the year-to-date performance is 3%. We           Long term bond yields have incre-
began 2015 with an 8%-10% expectation for annual equity returns, so things are going                ased by 40 to 70 basis points, but
more or less as planned.                                                                            nevertheless remain at levels that
                                                                                                    should continue to support econo-
Germany has stood out as a negative with a 9% decline in euro terms as a stronger cur-              mic activity
rency has led to a decrease in competitiveness and a market correction, following a 20%
rally in the first quarter.                                                                         Energy prices have rebounded by
    Chinese local shares have stood out as a positive, with a 14% increase in the second            15%-20%, but other commodities
quarter. The valuations of many Chinese companies now appear frothy and we have                     have fallen slightly
already seen some reversal.
    In the West, stock valuations continue to offer 6.0% earnings yield, but we note that           Global economic growth is on
10-year bond rates have moved upwards. In order for bonds to compete with equities in               track to reach 3.5% and the direc-
yield terms we need to see 10-year bond rates move closer to 3.0%. The current level is             tion of travel is similar to that in
0.9% in Germany, 2.3% in US and 0.4% in Japan.                                                      first quarter: America and Asia
    Emerging markets are valued 2 percentage points higher with an earnings yield of                have been slightly weaker and
8.2% and therefore offer a fairly rich risk premium to developed markets.                           Europe slightly stronger

                                                                                            S K A G E N F U N DS H A LF Y E A R RE PORT | 2 0 1 5
                                                                                                                                                    9
HALF YEAR REPORT - NEW OPPORTUNITIES ON THE HORIZON THE ART OF COMMON SENSE
SKAGEN Vekst
 Exploring the narrow path to
 prosperity

 > B
    etter developments in the
   US and Japan than Europe

                                                                                                                                                                                      Photo: Bloomberg
 > C
    ontinuing to
   concentrate the portfolio
 > S
    everal investments                                          Bonheur/Ganger Rolf must now be seen more as a company within renewable energy that also has an option on a future
                                                                 improvement in the rig market.
   reached price
   target and were sold
    1        2          3      4      RISK          6      7
                                                                 Slight improvement
 Fund start date                        1 December 1993          SKAGEN Vekst beat its benchmark index in the second quarter.
 Return since start                             1 713,51%

 AUM                                      EUR 938 million        SKAGEN Vekst lost 2.4% while the benchmark index fell 3.8%, measured in euro. Year
 Number of unitholders                                  72 165   to date SKAGEN Vekst has gained 6.6% versus the index which is up 13.2%. In general
                                                                 the European markets performed fairly poorly in the quarter while Japan, Hong Kong
                                                                 and the US performed somewhat better. In Scandinavia, Sweden and Finland were
 PERFORMANCE IN EUR                     2Q 15*          12 M*    weak while Denmark and Norway were more or less flat.
                                                                    During the quarter the fund exited Nokian Tyres, Toto, Novo Nordisk, Stolt Nielsen
 SKAGEN Vekst                            -2,4 %          4,4%
                                                                 and Sparebanken Øst. We reached our price target in all of these companies and see
 MSCI Nordic/MSCI AC                     -3,8 %         18,8%    better return potential in other companies going forward. We also exited Toshiba after
 ex. Nordic
                                                                 the Japanese company announced accounting irregularities (see separate section
 * As of 30 June 2015                                            below). The remainder of Bank Norwegian was also sold out of the portfolio in the
                                                                 second quarter. In total we earned 7.5 times our initial investment bought just before
                                                                 the global financial crisis. In hindsight, we started to reduce the position slightly pre-
                                                                 maturely, but are satisfied with the final result. We sold a large part of our position in
                                                                 Royal Unibrew as we prefer the pricing of our other Danish brewer, Carlsberg.
                                                                    There are several newcomers in the portfolio, the largest being Credit Suisse (see
                                                                 details below). We also bought smaller positions in Danish companies Solar and H
                                                                 Lundbeck AS as well as Swedish Elekta. The bulk shipping company, Golden Ocean
                                                                 Group, is also new following a spin-off from Frontline 2012. In general we have con-
                                                                 tinued to concentrate the portfolio and the proceeds from this have largely gone into
                                                                 increasing the size of the fund’s largest holdings. The 10 and 35 largest holdings now
                                                                 account for 52% and 91% of the portfolio, respectively.
                                                                    At the end of the first half year, the 35 largest positions in the SKAGEN Vekst port-
                                                                 folio are priced at 11 times this year’s underlying earnings versus 15 times for the
 PORTFOLIO MANAGERS
                                                                 benchmark. Measured in book value, the portfolio also trades at a substantial discount
                                                                 to the benchmark index. We should therefore be well positioned for the rest of 2015
 Geir Tjetland, Ole Søeberg, Erik Bergöö and
                                                                 despite the potential disruption to markets from macroeconomic factors.
 Alexander Stensrud*
 * Junior manager

Beach cyclists. 1894. Detail. By Einar Hein, one
of the Skagen painters. This image belongs to the
Skagens Museum (cropped).

     10 SKAGEN F UNDS HALF Y EA R REPORT | 2015
Increased profitability
                                                                                                                                           Credit Suisse is a newcomer in the portfo-
                                                                                                                                           lio. The bank, which is the second largest
                                                                                                                                           in Switzerland, has long struggled with
                                                                                                                                           poor profitability and is among the worst
                                                                                                                                           in Europe measured by cost/income ratio.
                                                                                                                                           The bank has hired a new CEO, Tidjane Thi-
                                                                                                                                           am, who started in June. We believe that
                                                                                                                                           Thiam will launch a cost cutting initiative
                                                                                                                                           that will substantially improve the bank’s
ON THE ONE HAND ...                                                                                                                        profitability. A reduction in the cost/inco-
                                                                                                                                           me ratio from the current 85% to a more
Best despite strike                                                                                                                        moderate 65% should be attainable and in
Norwegian was by far the best contributor to the fund in Q2. At the start of the quarter                                                   turn increase the return on net capital from
there was a great deal of commotion due to the strike in late winter. The company pro-                                                     7-8% to 15-20%. When this happens –
ved yet again that they are capable of dealing with any fallout and passengers quickly                                                     some time over the coming years – the
returned after the turbulence. Our earlier doubts about Norwegian’s long-haul initiatives                                                  bank should be priced at 1.5-2 times book
are being laid to rest. It now appears as though the long-haul part of the company will                                                    value which would double the current sha-
account for much of the future growth. Norwegian has its operations in order, but some                                                     re price to CHF 45-50.
political obstacles continue to impede developments. The company recently announced
that it is starting up routes from three US cities to the Caribbean. This will bring the
number of Norwegian’s direct routes from the US up to 31 (of which seven depart from
New York), making it the largest foreign airline company operating out of New York
measured by the number of destinations. We like the company’s operational ambitions
and await the value creation that will arise from the leasing company’s activities.

 HISTORICAL PRICE DEVELOPMENT SKAGEN VEKST
  2 40                                                                                                                        2 40

  1 60                                                                                                                        1 60
                                                                                                                                           Continued upside
                                                  SKAGEN Vekst
                                                                                                                                           Lundin Petroleum has so far been an
   80                                                                                                                          80
                                                                                                                                           extremely good investment for the fund,
   40
                                                                                                                                           particularly given the fall in oil price that
                                                                                                                               40
                                                                                                                                           has taken place while we have held the
   20                                                                                                                          20          position. The company recently announced
                                                                   MSCI Nordic/MSCI AC ex. Nordic*                                         that their long-standing CEO, Ashley Hep-
   10                                                                                                                          10
         94   95   96   97   98   99   00   01   02   03    04    05   06   07    08    09   10      11   12   13   14   15                penstall, will step down but will continue
                                                                                                                                           to sit on the company’s board. The new
  SKAGEN VEKST 2Q 2015 (MILL NOK)
                                                                                                                                           man at the helm, Alex Schneiter, has been
                                                                                                                                           in the Lundin system since 1993. Schneiter
   5 largest contributors                                               5 largest purchases                                                was the favourite to take the reins from
   Norwegian Air Shuttle ASA                               133          Credit Suisse Group AG                                       134
   Lundin Petroleum AB                                      44          Kinnevik Investment AB-B                                      66
                                                                                                                                           Heppenstall and we do not anticipate any
   Danske Bank A/S                                          30          Carlsberg AS-B                                                50   change in direction for the company. We
   Carlsberg AS-B                                           22          Kia Motors Corporation                                        45   are primarily invested in Lundin Petroleum
   Golar LNG Ltd                                            20          Elekta AB - B shs                                             43
                                                                                                                                           due to its 22% stake in the Johan Sverdrup
   5 largest detractors                                                 5 largest sales
                                                                        Toshiba Corp                                             -159
                                                                                                                                           field. We calculate a price per Sverdrup
   Norsk Hydro ASA                                         -118
   Samsung Electronics Co Ltd Pref                          -86         Nokian Renkaat OYJ                                        -80      barrel of USD 9 and therefore see signifi-
   Toshiba Corp                                             -62         Toto Ltd                                                  -72      cant upside for the share.
   AirAsia Bhd                                              -52         Novo Nordisk A/S-B                                        -65
   Casino Guichard Perrachon SA                             -30         Norwegian Finans Holding ASA                              -46

                                                                                                                                             S K A G E N F U N DS H A LF Y E A R RE PORT | 2 0 1 5
                                                                                                                                                                                                     11
SKAGEN VEKST

ON THE OTHER HAND ...

New assessment
Our investments in Bonheur/Ganger Rolf
have disappointed in the last couple of
years. We underestimated the collapse

                                                                                                                                                                         Photo: Bloomberg
in the rig market, which had a significant
impact on Fred Olsen Energy, which used
to be the companies’ main asset. The
discount to NAV in this holding company
has been huge though, and is the main
                                               Toshiba’s CEO Hisao Tanaka at a press conference where he announced that the company has set up a committee to investi-
reason why we kept it in the portfolio. An     gate allegations of improper accounting.
announcement made in late June, however,
is a game changer when it comes to the         Irregularities found
valuation of the companies: TRIG (The          At the start of April, Toshiba announced that they had discovered improper accounting
Renewables Infrastructure Group Limited)       on infrastructure projects from 2013. In May the company announced that, as a result
acquired 49% of Fred Olsen Wind Limi-          of this, they would withdraw the financial statement for the previous year and not
ted (50/50 owned by BON/GRO). TRIG is          pay a year-end dividend. A committee was assigned to further investigate the case. It
buying into a company with 433 MW of           appears as though these accounting irregularities may also apply to divisions other
installed windmill capacity. In this trans-    than infrastructure and operations accounting for more than 10% of Toshiba’s turnover
action FOWL is priced at NOK 9.3bn, and        are impacted. We chose to exit the position on these announcements and realised a
Bonheur alone will receive NOK 2.2bn in        total negative return of NOK 16 million. The outcome remains to be seen, but our fear
cash, corresponding to NOK 50 per share        is that the problem is more widespread than it first appears.
versus today’s share price of approximate-
ly NOK 60. In addition, they get substantial      SKAGEN VEKST KEY NUMBERS FOR THE LARGEST HOLDINGS (AS OF 30-06-2015)
value in the form of renewable energy,
                                                 Company                             Holding size         Price P/E 2015E    P/E 2016E        P/BV last   Price target
offshore, cruise and property, amongst
                                                 Samsung Electronics                       7,0%       993 000          5,8          5,9            0,9    1 500 000
other things. This is perhaps proof that the     Norwegian Air Shuttle                     6,2%           325         10,5          8,6             5,4          340
stock market is not efficient, since all the     Continental AG                            6,1%           213         13,7        11,9             4,0           275
focus has been on a lamentable rig market        Norsk Hydro                               5,8%          33,1          9,4          8,3            0,9           57,5
                                                 Citigroup                                 5,2%            55          9,2          8,0             0,8            75
while all the other values in the company
                                                 Teliasonera AB                            5,0%            49         12,4        12,2             1,9             70
have been overlooked. Bonheur/Ganger             Danske Bank A/S                           4,8%           197         11,7        11,5              1,3          205
Rolf must now be seen more as a company          Carlsberg                                 4,5%           608         16,0        13,5              1,8          750
within renewable energy which also has an        ABB                                       4,2%           174         14,4        12,4              3,1          250
                                                 Kia Motors                                3,6%         45300          6,3          6,1            0,8        75000
option on the future improvement in the rig
                                                 Weighted top 10                           52 %                        9,7          8,9             1,4         37 %
market. It may also be time for the stock        Weighted top 35                           91 %                       10,8          9,3             1,3         47 %
market to revise its view that the Olsen         Benchmark index                                                      15,2        13,8              2,3
family does not create long-term value.
                                                   P/E may deviate from other sources when based on SKAGEN estimates.

                                               Accounting woes                                               each associate, both of which are planned
                                               Air Asia´s share price was sent into a                        to be listed in 2017.
                                               tailspin after an extremely negative ana-                        We do not see any difference between
                                               lyst report from GMT Research. The report                     the current situation and a similar situation
                                               accuses Air Asia of milking transactions                      when they established Air Asia Thailand a
                                               with its money-losing associates in the                       few years ago. At that time net gearing was
                                               Philippines and Indonesia, such as plane                      more than 4 versus the current 2.5. Air Asia
                                               leasing and maintenance deals, to boost the                   is confident it can bring net gearing down
                                               parent company’s operating cash flow. As                      to 2 by year end.
                                               the associates are currently unable to pay                        If it turns out that the above-mentioned
                                               their bills to the parent company, Air Asia                   associates are not in a position to pay their
                                               is extending significant capital to them –                    bills, however, and Air Asia has to do a full
                                               essentially gearing up – and funding its                      impairment of total receivables, the company
                                               own profit and operating cash flow, the                       will still have value in the form of 128 owned
                                               report said.                                                  planes which will exceed the net debt by a
                                                  Air Asia states that both associates will                  considerable margin. We choose to maintain
                                               be able to pay their bills during the course                  our position in the company and see a consi-
                                               of the year. The company is also working                      derable upside when the associates in Indo-
                                               to raise new capital of USD 100 million for                   nesia and the Philippines turn profitable.

 12 SKAGEN F UNDS HALF Y EA R REPORT | 2015
See the portolio in its entirety at
   SECURITIES PORTFOLIO SKAGEN VEKST AS OF 30 JUNE 2015                                                                         www.skagenfunds.com/vekst-portfolio

                                                                                                                                SECTOR DISTRIBUTION
                                                  Acquistion      Market-   Unrealised     Share of          Stock
Security                               Number    value NOK *   value NOK*   gain/loss *       fund        exchange              Health 3,9%                              Telecom 7,3%
Lundin Petroleum AB                  1 800 000     177 336      243 572        66 236       2,96%        Stockholm              Cash 1,1%
Ganger Rolf ASA                      1 213 817     124 262       78 898       -45 364       0,96%         Oslo Børs             Industrials                              Raw materials
Bonheur ASA                          1 192 594      88 117       76 326       -11 791       0,93%         Oslo Børs             21,4%                                           7,3%
Solstad Offshore ASA                 2 052 746     102 753       71 230       -31 523       0,87%         Oslo Børs
                                                                                                                                                                          Energy 8,0%
GCL-Poly Energy Holdings Ltd        30 000 000      59 320       54 307        -5 013       0,66%        Hong Kong
Rec Silicon ASA                     32 000 000      47 398       53 888         6 490       0,65%         Oslo Børs             Finance                                         Consumer
                                                                                                                                16,9%                                             staples
DOF ASA                              5 762 213     110 022       34 573       -75 448       0,42%         Oslo Børs
Minor items                                        256 220       41 807      -214 413       0,51%                                                                                   9,8%
Total Energy                                       965 429      654 602      -310 827       7,96%                               Consumer
                                                                                                                                discretionary
Norsk Hydro ASA                     14 542 679     373 563      480 636       107 072       5,84%         Oslo Børs             13,4%
Kemira OYJ                             850 000      81 883       76 473        -5 411       0,93%          Helsinki                                                              IT 11,0%
OCI Co Ltd                              39 000      33 003       24 618        -8 384       0,30%            Seoul
Minor items                                         20 776       18 601        -2 175       0,23%
                                                                                                                                GEOGRAPHICAL DISTRIBUTION
Total Raw materials                                509 225      600 327        91 102       7,30%
                                                                                                                                EMEA 1,3%                                      Japan 2,0%
Norwegian Air Shuttle ASA            1 561 410      124 109      507 302      383 193      6,17%          Oslo Børs
ABB Ltd                              2 070 000      289 197      343 206       54 010      4,17%         Stockholm              Cash 1,1%                         Peripeheral EU 3,9%
Koninklijke Philips NV               1 379 643      279 529      277 282       -2 248      3,37%        Amsterdam                                                  North America 6,8%
Wilh. Wilhelmsen Holding ASA           874 858       62 479      149 163       86 685      1,81%          Oslo Børs             Nordic 55,4%
FLSmidth & Co A/S                      311 000      104 468      117 743       13 275      1,43%       Copenhagen                                                                 Asia ex
                                                                                                                                                                                   Japan
AirAsia Bhd                         27 960 000      142 496       89 467      -53 030      1,09%      Kuala Lumpur
                                                                                                                                                                                  13,3%
Golar LNG Ltd                          190 000       58 722       70 327       11 605      0,85%           NASDAQ
Solar AS - B Shs                       104 000       40 099       44 557        4 458      0,54%       Copenhagen
Frontline 2012 Ltd                   1 000 000       41 502       41 000         -502      0,50%           Unlisted
                                                                                                                                                                                Eurozone
Danieli & Officine Meccaniche SpA      312 962       41 406       37 515       -3 891      0,46%               Italy
                                                                                                                                                                                   16,3%
YIT Oyj                                550 125       32 137       31 114       -1 023      0,38%           Helsinki
Goodtech ASA                         2 055 949       46 750       25 288      -21 462      0,31%          Oslo Børs
Minor items                                          61 826       28 590      -33 237      0,35%
Total Industrials                                 1 324 721    1 762 554      437 833     21,42%
                                                                                                                                Effective 1/1/2014, the fund’s investment manda-
Continental AG                         269 250     149 278       502 657      353 379      6,11%           Frankfurt            te changed from investing a minimum of 50% of its
Kia Motors Corporation                 932 000     285 845       296 120       10 275      3,60%              Seoul             assets in Norway to investing a minimum of 50% of
Volvo AB                             2 590 000     219 106       253 325       34 219      3,08%         Stockholm              its assets in the Nordic countries. This means that
Nippon Seiki Co Ltd                    273 000      28 148        42 617       14 470      0,52%              Tokyo             returns prior to the change were achieved under dif-
                                                                                                                                ferent circumstances than they are today. The fund’s
Minor items                                         33 138         9 057      -24 080      0,11%
                                                                                                                                benchmark index prior to 1/1/2014 was an evenly
Total Consumer discretionary                       715 513     1 103 776      388 263     13,42%
                                                                                                                                composed benchmark index consisting of the Oslo
Carlsberg AS-B                        518 000      323 926      369 576        45 650       4,49%      Copenhagen               Stock Exchange Benchmark Index (OSEBX) and the
Casino Guichard Perrachon SA          352 100      240 762      211 246       -29 516       2,57%              Paris            MSCI All Country World. The benchmark index prior
Oriflame Cosmetics AG                 828 912      107 386      103 902        -3 484       1,26%        Stockholm              to 1/1/2010 was the Oslo Stock Exchange Bench-
                                                                                                                                mark Index (OSEBX).
Sodastream International Ltd          365 000       82 946       61 472       -21 474       0,75%          NASDAQ
Yazicilar Holding AS                  689 169       23 544       41 583        18 039       0,51%          Istanbul
Minor items                                         15 631       17 590         1 959       0,21%
Total Consumer staples                             794 196      805 370        11 174       9,79%
Roche Holding AG-Genusschein            80 198     173 752      177 914         4 162       2,16%            Zürich
Medi-Stim ASA                        1 465 625      18 313       56 133        37 820       0,68%         Oslo Børs
Elekta AB - B shs                      800 000      42 984       39 731        -3 253       0,48%        Stockholm
Photocure ASA                          626 466      25 235       22 803        -2 432       0,28%         Oslo Børs
Minor items                                         22 672       20 501        -2 170       0,25%
Total Health                                       282 956      317 083        34 127       3,85%
Citigroup Inc                          983 800      352 249      425 054       72 805      5,17%          New York
Danske Bank A/S                      1 710 000      198 532      395 756      197 224      4,81%       Copenhagen
Credit Suisse Group AG                 638 556      131 314      138 754        7 440      1,69%             Zürich
SBI Holdings Inc                     1 139 000       96 634      123 164       26 530      1,50%             Tokyo
Tribona AB                           2 851 004       94 342      103 419        9 078      1,26%         Stockholm
Sberbank of Russia Pref              9 620 000      139 234       64 980      -74 254      0,79%           Moscow
Hitecvision AS                         793 668        7 193       53 176       45 982      0,65%           Unlisted
Korean Reinsurance Co                  600 000       20 468       51 762       31 293      0,63%             Seoul
Raiffeisen Bank International AG       305 054       68 721       35 042      -33 679      0,43%            Vienna
Total Finance                                     1 108 688    1 391 107      282 418     16,91%
Samsung Electronics Co Ltd Pref         82 850     494 978      577 026        82 047      7,01%             Seoul
SAP SE                                 497 100     212 798      274 048        61 251      3,33%          Frankfurt
PSI Group ASA                        3 796 612      43 431       32 081       -11 349      0,39%          Oslo Børs
Minor items                                         22 682       20 099        -2 583      0,24%
Total IT                                           773 889      903 255       129 366     10,98%
Teliasonera AB                       8 900 000     408 471      413 952         5 481       5,03%        Stockholm
Kinnevik Investment AB-B               736 009     169 794      184 164        14 370       2,24%        Stockholm
Total Telecom                                      578 265      598 115        19 851       7,27%
Total equity portfolio*                           7 052 882    8 136 190    1 083 308      98,89%
Disposable liquidity                                              91 298                    1,11%
Total share capital                                            8 227 489                  100,00%

Base price as of 30-06-2015                      1 948,6041
* Figures in 1 000 NOK.

                                                                                                                       S K A G E N F U N DS H A LF Y E A R RE PORT | 2 0 1 5
                                                                                                                                                                               13
Uphill struggle for
                                                                   emerging markets and
SKAGEN Global
A world of opportunities
                                                                   commodities
                                                                   The negative return in the second quarter was mainly due to the weak
> P
   erformance hurt by weak                                        performance of several of the fund’s emerging markets companies as
  emerging markets and                                             well as headwinds for the commodities segment. On the other hand,
  headwinds for Samsung                                            several of the holdings within the financial sector contributed positively.
  Electronics and
  commodities                                                      This bodes well for the future as the fund has a relatively high, but well-diversified
                                                                   exposure to global companies within the banking, insurance and real estate sector.
> C
   itigroup and AIG among                                            On a macro level, the stock exchange climate in the US was dominated by speculation
  the best contributors                                            around the next interest rate hike by the Federal Reserve. After nine consecutive quarters
                                                                   of positive returns, the broad-based S&P 500 market index fell by 0.2% in the quarter.
> T he portfolio trades at                                        Weak economic data for the first quarter was attributed to an unusually hard winter.
   an attractive discount                                          Despite better employment figures from the US in the second quarter, the strength of the
                                                                   economic recovery remains unclear. Our view remains that the US stock market appears
   to the world index                                              relatively fully valued, and the fund has maintained its underweight in the US, which
                                                                   currently amounts to 19% of the fund.
  1         2         3         4       RISK       6           7
                                                                      Following the stock exchange jubilation in the first quarter, the red return figures spread
Fund start date                                7 August 1997       to the European SXXP index, which declined 4.0% in the second quarter. An unexpec-
                                                                   ted rise in interest rates from record lows in Germany in addition to renewed concerns
Return since start                                 1154,25%
                                                                   around the possibility of a Greek default at the end of June dampened the enthusiasm.
AUM                                       EUR 4 018 million

Number of unitholders                                   87 385     The best and the worst
                                                                   The fund’s holdings in the US financial giants, Citigroup and AIG, were among the top
                                                                   positive contributors in the quarter. The market is finally starting to open its eyes to
PERFORMANCE IN EUR                       2Q 15*         12 M*      the operational improvements that we have long since predicted. In addition, the huge
                                                                   potential for capital repayment via buybacks and dividends – another of our price-driving
SKAGEN Global                              -3,7%        10,2%
                                                                   arguments – is becoming increasingly clear to other market participants.
MSCI ACWI                                  -3,5%        24,0%         Samsung Electronics fell by 10% and was clearly the largest detractor from the
* As of 30 June 2015.                                              fund’s performance in the quarter. The market disregarded the improvement in profits
                                                                   from mobile phones and semiconductors since the previous quarter, as expectations
                                                                   had dislocated from reality. We believe that the long-term outlook is still good and the
                                                                   valuation is particularly attractive at present. Another company that is once again on the
                                                                   losing side is Norsk Hydro which has declined around 30% since the peak in winter due
                                                                   to a downturn in the aluminium market. We believe that the market has overreacted in
                                                                   this case and, thanks to a strong balance sheet, we think there is a good possibility for

                                                                     SKAGEN GLOBAL 2Q 2015 (MILL NOK)
PORTFOLIO MANAGERS
Knut Gezelius, Søren Milo Christensen and                             5 largest contributors                        5 largest purchases
                                                                      American International Group Inc     198      Google Inc CLASS C                    474
Chris-Tommy Simonsen                                                  Cheung Kong Property Holdings Ltd    152      Tyson Foods Inc                       393
                                                                      Citigroup Inc                        134      Carlsberg AS-B                        314
                                                                      General Electric Co                   94      Haci Omer Sabanci Holding AS          203
From the moor north of Skagen, 1885. Detail. By P.S. Krøyer,
                                                                      Lundin Petroleum AB                   71      CK Hutchison Holdings Ltd             180
one of the Skagen painters (cropped).
                                                                      5 largest detractors                          5 largest sales
                                                                      Samsung Electronics Co Ltd Pref      -317     Citigroup Inc                        -626
                                                                      General Motors Co                    -138     American International Group Inc     -280
                                                                      Norsk Hydro ASA                      -132     Lenovo Group Ltd                     -276
                                                                      Tyco International Plc                -97     Technip SA                           -259
                                                                      Tata Motors Ltd-A- DVR                -94     Volvo AB                             -239

    14 SKAGEN F UNDS HALF Y EA R REPORT | 2015
Photo: iStockphoto
Photo: Bloomberg

                                                                                                                   The average American drinks over 160 litres of soda a year,
                                                                                                                   but chicken consumption per capita has actually increased by
                                                                                                                   10% over the past three years and is estimated to be 41kg in
                                                                                                                   2015. Against this background, it is possible that the market
                                                                                                                   undervalues the long-term earnings potential of Tyson Foods.

                   higher dividends to shareholders.               and less volatile cash flows. Food manu-        Sabanci Holding
                      The fund bought three new companies          facturers specialised in pre-packaged food      We have followed the adage “buy low,
                   and exited four in the quarter, bringing        therefore enjoy twice as high P/E multiples     sell high” and brought the Turkish cong-
                   the number of holdings in the portfolio to      as protein manufacturers.                       lomerate Sabanci Holding back into the
                   59. The new companies are Tyson Foods,             We think that the P/E of the stock will      SKAGEN Global portfolio. Regular readers
                   Sabanci Holding and Cheung Kong Property        be revised upwards as Tyson Foods makes         may recollect that SKAGEN Global divested
                   Holding.                                        the transition from protein manufacturer        Sabanci Holding in the fourth quarter of
                                                                   to food producer. The market has not yet        2014. Since then the share price has fallen
                   From protein to pre-packaged food               priced in a multiple expansion. We cannot       by 15% and the total return has lagged
                   US Tyson Foods, established in 1935 and         predict precisely when this will happen, but    the index by around 25%, mainly due to
                   with a market capitalisation of USD 17 bil-     we consider it likely that it will happen in    market turbulence related to the Turkish
                   lion, is one of the world’s largest producers   the next couple of years. As long-term inve-    elections. The fall in share price has given
                   of chicken and beef. Under the leadership       stors we have the opportunity to buy at an      us an opportunity to buy into the company
                   of CEO Donnie Smith, Tyson Foods acqui-         attractive price and get paid dividends whi-    again at an attractive valuation.
                   red food producer Hillshire Brands for USD      le we wait for the appreciation. In addition,      The family-controlled conglomerate has
                   eight billion last year. The purpose of the     the impending structural shift in American      historically been good at allocating capi-
                   acquisition was to strategically reposition     eating habits will be favourable for Tyson      tal, as illustrated by an average return on
                   Tyson Foods, from being a cyclical protein      Foods. The obesity epidemic in the US has       equity of 16% for the underlying assets
                   manufacturer to a stable food producer,         reached alarming levels and has prompted        (with the exception of the energy segment).
                   whereby pre-packaged food represents            the government to publish new consumer          The assets include banking and insuran-
                   a larger share of sales. We estimate that       directives explicitly recommending more         ce, in addition to energy and engineering
                   pre-packaged food will constitute nearly        protein and less sugar in food.                 in 12 Turkish companies. Our price target
                   40% of the profits by as early as 2017, a          With this in mind, it is possible that the   indicates a 40% upside based on organic
                   marked increase from 15% in 2014. Meat          market also underestimates the company’s        growth in the underlying assets, a possible
                   production is a cyclical market with relati-    long-term earnings potential. Time will tell    IPO of the energy segment and increased
                   vely small margins, which means that pure       whether Tyson Foods will be a feather in        dividends from today’s relatively low 1.3%
                   meat producers trade at a P/E of around         SKAGEN Global’s cap.                            dividend yield.
                   10. Pre-packaged food has higher margins

                                                                                                                       S K A G E N F U N DS H A LF Y E A R RE PORT | 2 0 1 5
                                                                                                                                                                               15
SKAGEN GLOBAL

                                                                                                                                                             No longer undervalued
                                                                                                                                                             In May, portfolio company Cheung Kong
                                                                                                                                                             Hutchison Holding spun off its property
                                                                                                                                                             division to shareholders under the name
During the quarter we raised our stake in Google to about 2.5% of the portfolio. With USD 60bn in cash and strong cash flow,                                 Cheung Kong Property Holding. The market
we see a limited downside and an upside of 30% from today’s levels. Pictured: An attendee at Google’s Annual Developers
Conference on 28 May 2015 shows off his mobile device with an Android Pay icon, Google’s newly unveiled payment services.                                    valuation of Cheung Kong Property Holding
                                                                                                                                                             proved to be high and in our opinion the
                                                                                                                                                             share is not undervalued at the listed price
                                                                                                                                                             so we sold the position.
Google                                                                           ket is far too short-sighted and that the                                      In the second quarter we sold our posi-
During the quarter we increased our expo-                                        shares do not price in the earnings growth                                  tions in Technip, Talanx and Raiffeisen
sure to the US search engine giant, Google,                                      that lower capital costs will generate from                                 Bank. Despite the sharp fall in oil prices,
to around 2.5% of the portfolio. In absolute                                     2017-18 onwards. With net cash of USD 60                                    the French oil services company Technip
terms, Google’s share price has remained                                         billion and strong growth in free cash flow,                                has surprised the market positively so
relatively stable over the past 12 months.                                       Google has limited downside and at least                                    far this year. We sold our last shares after
We believe that in Google’s case, the mar-                                       30% upside from current levels.                                             the price rose by around 30% and thus
                                                                                                                                                             reached our target price.
                                                                                                                                                                The German insurer Talanx has gene-
  HISTORICAL PRICE DEVELOPMENT SKAGEN GLOBAL
                                                                                                                                                             rated an annual return of 25% since SKA-
    100                                                                                                                                 100
                                                                                                                                                             GEN participated in the IPO in November
     80                                 SKAGEN Global                                                                                   80
                                                                                                                                                             2012. After the share price increased by
                                                                                                                                                             60%, we believe that the company is no
     40                                                                                                                                 40
                                                                                                                                                             longer undervalued relative to its current
     20                                                                                                                                 20
                                                                                                                                                             strategy. We also sold our position in Raif-
                                                                                                                                                             feisen Bank in favour of more attractive
     10                                                              MSCI World AC Index                                                10
                                                                                                                                                             investment opportunities elsewhere in
          1998   1999   2000   2001   2002   2003   2004   2005   2006   2007   2008   2009    2010   2011   2012    2013   2014 2015
                                                                                                                                                             the portfolio.

   SKAGEN GLOBAL KEY NUMBERS FOR THE LARGEST HOLDINGS (AS OF 30-06-2015)
                                                                                                                                                             Well positioned
  Company                                       Holding size               Price P/E 2015E            P/E 2016E              P/BV last        Price target   The portfolio reflects SKAGEN’s value-ba-
  CitiGroup                                                6,5%                 55            10,0             9,3                 0,8                 75    sed investment philosophy and trades at
  Samsung Electronics                                      6,1%     993 000,0                  6,5             6,0                 0,9         1 500 000
                                                                                                                                                             an attractive discount to the world index.
  AIG                                                      5,3%                 62            12,6           11,0                  0,8                 90
  General Electric                                         4,9%            26,6               19,7           16,7                  2,5                 34    Our 35 largest holdings have an average
  Nordea                                                   3,5%           103,4               12,1           11,9                  1,6               150     2016 P/E ratio of 10.6 compared with 14.6
  Roche                                                    3,1%           262,0               18,4           16,9                 11,4               380     for the index, in other words a discount of
  LG Corp                                                  2,8%          61 800               10,7             9,5                 0,9            72 000
  State Bank of india                                      2,6%             263                9,8             8,0                 1,2               400
                                                                                                                                                             27%. Overall, SKAGEN Global has genera-
  DSM                                                      2,5%            52,0               20,1           17,4                  1,5                 65    ted 10.2% return in the first six months of
  Microsoft                                                2,5%            44,2               17,2           16,0                  4,0                 58    the year and the fund is well positioned to
  Weighted top 10                                          40 %                               11,3           10,2                  1,2              39 %     achieve its goal of a return of at least 15%
  Weighted top 35                                          81 %                               11,9           10,6                  1,2              34 %
  Benchmark index                                                                             16,4           14,6                  2,1
                                                                                                                                                             annually in absolute terms.

    P/E may deviate from other sources when based on SKAGEN estimates.

16 SKAGEN F UNDS HALF Y EA R REPORT | 2015
See the portolio in its entirety at
   SECURITIES PORTFOLIO SKAGEN GLOBAL AS OF 30 JUNE 2015                                                                              www.skagenfunds.com/global-portfolio

                                                                                                                                      SECTOR DISTRIBUTION
                                                       Acquistion       Market-    Unrealised     Share of         Stock
Security                                    Number    value NOK *    value NOK*    gain/loss *       fund       exchange                                                           Consumer
                                                                                                                                      Energy 3,2%                               staples 3,7%
Lundin Petroleum AB                       3 293 160      367 913       445 497        77 585       1,26%      Stockholm
                                                                                                                                      Cash 1,1%                                Telecom 4,3%
Kazmunaigas Exploration GDR               3 529 139      415 879       274 890      -140 990       0,78%      London Int
BP Plc                                    4 269 875      213 135       223 364        10 229       0,63%         London               Finance                                           Health
BP Plc ADR                                  598 207      174 952       188 193        13 241       0,53%       New York               26,3%                                              7,8%
Total Energy                                           1 171 879     1 131 944       -39 935       3,21%

Koninklijke DSM NV                        1 955 246      810 782       895 526        84 744      2,54%       Amsterdam                                                                IT 12,0%
Heidelbergcement AG                       1 176 994      389 487       739 813       350 326      2,10%          Frankfurt
                                                                                                                                      Industrials
Norsk Hydro ASA                          16 945 242      474 549       560 040        85 491      1,59%         Oslo Børs
                                                                                                                                      16,0%
Akzo Nobel NV                               892 610      292 845       515 296       222 451      1,46%       Amsterdam                                                             Consumer
UPM-Kymmene Oyj                           3 099 638      291 644       433 019       141 375      1,23%           Helsinki                                                       discretionary
                                                                                                                                      Raw                                              12,8%
Lundin Mining Corp                       12 338 063      366 915       396 892        29 978      1,13%            Toronto
                                                                                                                                      materials 12,9%
OCI Co Ltd                                  434 153      385 027       275 138      -109 889      0,78%              Seoul
Mayr-Melnhof Karton AG                      303 520      140 593       274 254       133 661      0,78%             Vienna
Ternium SA ADR                            1 994 417      298 074       272 565       -25 509      0,77%         New York              GEOGRAPHICAL DISTRIBUTION
Lundin Mining Corp SDR                    5 327 379      147 971       171 207        23 236      0,49%        Stockholm
Total Raw materials                                    3 597 887     4 533 750       935 863     12,87%                               Frontier Markets 2,0%              South America 2,0%
                                                                                                                                      Japan 1,0%                                     EMEA 2,1%
General Electric Co                       8 170 740    1 616 001     1 719 970       103 969      4,88%         New York
LG Corp                                   2 304 821      645 552     1 002 977       357 424      2,85%            Seoul              Cash 1,1%                                Peripheral EU
CK Hutchison Holdings Ltd                 6 515 098      539 504       753 052       213 549      2,14%        Hong Kong                                                               5,8%
Koninklijke Philips NV                    2 825 548      526 915       568 444        41 528      1,61%       Amsterdam               North                                             Nordic
                                                                                                                                      America                                           13,9%
Tyco International Plc                    1 751 162      198 083       531 204       333 121      1,51%         New York
                                                                                                                                      35,7%
Valmet Corp                               3 106 627      212 961       273 629        60 668      0,78%          Helsinki
Prosegur Cia de Seguridad Sa              6 238 240      202 461       270 082        67 621      0,77%           Madrid                                                              Eurozone
Autoliv Inc                                 258 314       88 438       237 990       149 553      0,68%         New York                                                                 14,2%
China Communications Services Corp Ltd   41 861 881      150 954       166 527        15 573      0,47%       Hong Kong
                                                                                                                                      Asia ex
Autoliv Inc SDR                             130 595       45 327       120 338        75 010      0,34%        Stockholm              Japan 22,3%
Total Industrials                                      4 226 197     5 644 213     1 418 016     16,02%

General Motors Co                         3 315 380      473 410       867 059       393 650      2,46%        New York
Gap Inc/The                               1 775 497      435 590       533 906        98 317      1,52%        New York
Kingfisher Plc                           12 302 903      410 292       531 032       120 739      1,51%          London
Volvo AB                                  5 250 655      407 180       512 695       105 515      1,46%       Stockholm
Comcast Corp                              1 077 693      147 207       506 456       359 249      1,44%         NASDAQ
Hyundai Motor Co Pref (2pb)                 670 632      257 703       495 837       238 134      1,41%            Seoul
Tata Motors Ltd-A- DVR                   11 563 913      231 336       372 642       141 306      1,06%         Bombay
Toyota Industries Corp                      785 972      140 281       352 552       212 271      1,00%            Tokyo
Minor items                                 191 412      347 489       323 684       -23 804      0,90%
Total Consumer discretionary                           2 850 487     4 495 864     1 645 377     12,76%

Tyson Foods Inc                           1 314 961     393 017        448 546        55 529       1,27%        New York
Carlsberg AS-B                              460 833     314 302        328 892        14 590       0,93%     Copenhagen
Unilever NV-Cva                             911 620     191 767        300 127       108 359       0,85%      Amsterdam
Yazicilar Holding AS                      3 577 860      86 656        218 002       131 346       0,62%         Istanbul
Total Consumer staples                                  985 742      1 295 567       309 824       3,68%
Roche Holding AG-Genusschein                495 108      597 625     1 101 354       503 728       3,13%          Zürich
Sanofi                                      964 732      601 027       754 694       153 667       2,14%           Paris
Teva Pharmaceutical-Sp ADR                1 074 283      331 351       499 446       168 095       1,42%        NASDAQ
Varian Medical Systems Inc                  613 370      313 599       406 533        92 933       1,15%        New York
Total Health                                           1 843 603     2 762 026       918 423       7,84%
Citigroup Inc                             5 233 467    1 198 400     2 272 502     1 074 102      6,45%         New York
American International Group Inc          3 816 021    1 013 636     1 855 769       842 133      5,27%         New York
Nordea Bank AB                           12 398 133      870 977     1 222 357       351 380      3,47%        Stockholm
State Bank of India                      22 526 330      573 039       731 609       158 570      2,08%             India
Goldman Sachs Group Inc                     439 836      391 585       724 709       333 123      2,06%         New York
NN Group NV                               3 052 161      549 926       677 162       127 237      1,92%       Amsterdam
Storebrand ASA                           13 625 168      468 375       440 638       -27 737      1,25%         Oslo Børs
EFG-Hermes Holding SAE                   18 826 600      238 806       268 365        29 559      0,76%             Cairo
Columbia Property Trust Inc               1 297 237      254 227       251 180        -3 046      0,71%         New York
Irsa Sa ADR                               1 763 696      146 619       248 250       101 630      0,70%         New York
Minor items                               7 416 393      489 179       585 226        96 048      1,66%
Total Finance                                          6 194 769     9 277 768     3 082 999     26,33%
Samsung Electronics Co Ltd Pref             251 657      609 537     1 759 638     1 150 101      4,99%           Seoul
Microsoft Corp                            2 505 570      437 371       870 543       433 172      2,47%         NASDAQ
Google Inc CLASS C                          162 112      563 208       668 231       105 023      1,90%         NASDAQ
Lenovo Group Ltd                         29 495 300      221 697       321 468        99 771      0,91%       Hong Kong
Samsung Electronics Co Ltd                   35 003      316 100       312 529        -3 572      0,89%           Seoul
Google Inc CLASS A                           45 315       79 242       193 197       113 955      0,55%         NASDAQ
Minor items                                               24 968        86 209        61 241      0,24%
Total IT                                               2 252 123     4 211 813     1 959 690     11,95%
China Unicom Hong Kong Ltd               39 506 972      374 491       489 118       114 627       1,39%      Hong Kong
Vimpelcom Ltd-Spon ADR                    7 361 234      539 474       285 820      -253 654       0,81%        New York
First Pacific Co Ltd                     42 834 923      270 660       284 286        13 626       0,81%      Hong Kong
Indosat Tbk PT                           65 422 055      226 138       154 134       -72 003       0,44%       Indonesia
China Unicom Hong Kong Ltd ADR            1 144 875      105 570       141 601        36 030       0,40%        New York
Minor items                                              149 379       147 306        -2 073       0,41%
Total Telecom                                          1 665 712     1 502 266      -163 446       4,26%
Total equity portfolio*                               24 788 398    34 855 211    10 066 812      98,93%
Disposable liquidity                                                   376 173                     1,07%
Total share capital                                                 35 231 383                   100,00%

Base price as of 30-06-2015                           1 374,8063
* Figues in 1 000 NOK.

                                                                                                                             S K A G E N F U N DS H A LF Y E A R RE PORT | 2 0 1 5
                                                                                                                                                                                     17
SKAGEN Kon-Tiki
Leading the way in new waters

                                                                                                                                                                                                Photo: Bloomberg
> O
   ur contrarian bet in un-
  popular Petrobras paid off.

> Three of our largest holdings                                   A new position in the fund, Sberbank, is best in class among Russian banks. Pictured here, a customer sits in the reception
                                                                  of a Sberbank branch in Almaty, Kazakhstan.
  were a drag on performance.

> W
   orking to refine the sell
  discipline in the fund.
                                                                  Staying the course
   1        2          3       4         5       RISK      7      SKAGEN Kon-Tiki fell 4.9% during Q2, compared with a decline of 3.2%
Fund start date                                   5 April 2002    for the emerging markets (EM) index, measured in EUR. Year-to-date
Return since start                                      518,92%   the fund is up 5.8%, lagging the index by 5.9%.
Assets under management                      EUR 4 985 million

Number of unitholders                                    70 785
                                                                  Three of our largest holdings, Great Wall                        and undervalued stocks will lead to satis-
                                                                  Motor, Hyundai Motor and Samsung                                 factory returns in the long run. The portfo-
                                                                  Electronics—accounting for a combined                            lio consists of good companies trading at
PERFORMANCE IN EUR                           2Q 15*      12 M*
                                                                  21% of the portfolio at the beginning of                         a solid discount to the market, and to our
SKAGEN Kon-Tiki                              -4,9 %       2,0%    the quarter—were a drag on performance                           estimate of intrinsic value. While we cannot
MSCI Emerging Markets                        -3,2 %      16,5%    in the second quarter. On the positive side,                     predict the investing crowd’s short-term
* As of 30 June 2015
                                                                  our contrarian bet in Brazilian oil major                        preferences, we are confident that in the
                                                                  Petrobras paid off handsomely. Hong Kong                         long run company fundamentals will be
                                                                  based asset manager Value Partners, and                          more important than fleeting popularity.
                                                                  Brazilian meat producer Marfrig also per-                            That being said, we are constantly look-
                                                                  formed well.                                                     ing for ways to improve our investment
                                                                      We are certainly not satisfied with                          process.
                                                                  recent performance, but continue to
                                                                  believe that our time tested approach of
                                                                  identifying unpopular, under-researched

                                                                     SKAGEN KON-TIKI KEY NUMBERS FOR THE LARGEST HOLDINGS (AS OF 30-06-2015)

                                                                    Company                               Holding size        Price   P/E 2014    P/E 2015E         P/BV last   Price target
                                                                    Samsung Electronics                         8,0%       993 000          6,4           6,0             0,9    1 500 000
                                                                    Hyundai Motor                               7,7%       102 000          3,6           3,9             0,4       200000
PORTFOLIO MANAGERS                                                  State Bank of India                         4,1%         262,8         11,5           8,0             1,2           450
Kristoffer Stensrud, Knut Harald Nilsson,                           Mahindra & Mahindra                         4,1%         1 282         24,1         12,8              2,9         2000
                                                                    Sabanci Holding                             3,8%            10          9,9           8,4             1,1            14
Cathrine Gether, Erik Landgraff and
                                                                    Bharti Airtel                               3,5%           420         32,4         21,0              2,7           450
Hilde Jenssen                                                       ABB                                         3,2%         175,1         21,1         14,6              2,9           250
                                                                    Naspers                                     2,7%         1 895         68,1         37,9             10,0         2250
                                                                    Great Wall Motor                            2,6%            38         11,5           7,8             3,0            60
Skagen reef’s lightship, 1892. Detail. By Carl Locher,
one of the Skagen painters. The picture is owned by                 Richter Gedeon                              2,4%       4 200,0         31,7         15,3              1,4         7500
the Skagens Museum. (Cropped)                                       SBI Holdings                                1,9%         1 686          8,0         13,0              1,0         3 000
                                                                    Hitachi                                     1,9%         806,8         16,1           9,5             1,3         1200
                                                                    Weighted top 12                             46 %                        8,7           7,8             1,0         57 %
                                                                    Weighted top 35                             75 %                       11,6          8,4              1,1         57 %
                                                                    Benchmark index                                                        13,8         12,3              1,6

                                                                     P/E may deviate from other sources when based on SKAGEN estimates.

         18     SKAGEN F UNDS HALF Y EA R REPORT | 2015
SKAGEN KON-TIKI

SPRING CLEANING                                                                                                 NEW POSITIONS:

One area of improvement that we are addressing is selling discipline. When to sell is                           While we exited a large number of posi-
a notoriously difficult question, pitching your adherence to a set target price against                         tions in the quarter, we are always on
the dangers of selling your winners and keeping the losers. For SKAGEN Kon-Tiki,                                the lookout for the next great investment
there are three major reasons for selling a stock.                                                              opportunity. We entered three new posi-
                                                                                                                tions, namely Sberbank, China Shipping
First, in those cases where expectations                  serve us, and if we are consistent in updating        Development and Eros International
collide with reality in unexpected ways.                  our target prices they should be adhered to.          Media.
Experience has taught us that when our                    Challenges such as these are part of what
investment thesis does not play out, the                  makes investing such a fascinating disci-             Sberbank is best in class among Russi-
stock should be sold even if it has a lower               pline, and why it is arguably more art than           an banks and could benefit as inflation
valuation than when we first bought it.                   science.                                              decelerates and the Russian economy sta-
   A good example is Aveng, the South Afri-                   To further complicate the picture, deci-          bilises. We bought the preference shares
can construction company. Despite realising               sion-making can be impacted by flows. In              when index funds were forced to sell as
that our investment thesis was not playing                particular, we have found that maintaining            a result of MSCI index exclusion and the
out as expected, we have been dragging                    selling discipline during periods of large            preference shares traded at a historical
our feet due to low valuation and hopes of                inflows is crucial to avoid delays in dispo-          discount to the ordinary shares.
a reversal in the company’s fortunes. Not a               sing of lower conviction ideas.                           China Shipping Development is a
recipe for investment success.                                Putting your money where our mouth is,            Shanghai-based shipping company focu-
   Second, if we find better investment                   we have focused on exiting smaller positions          sed on Dry Bulk and Tank. Its shares are
opportunities elsewhere, capital should                   where conviction—rather than size or liquidi-         both A- and H-share listed, with the latter
be redeployed to companies with a higher                  ty constraints—explains the sizing. We sold           selling at a big discount (P/B 0.75x vs.
risk-adjusted upside.                                     out of Siem Offshore, Exxaro, Yingli and MRV          1.8x). We believe current valuation only
   Third—and this is the most difficult                   because of adverse developments relative              factors in tanker improvement, despite
one—we should sell when the stock app-                    to our investment case.                               signs that Dry Cargo is close to the bot-
roaches our target price. Sounds easy,                        On a more positive note, Value Partners,          tom. With no fleet growth this year or next,
but the difficulty arises when you sell                   Skyworth, Harbin Electric and Kiwoom                  and Chinese coal and iron ore inventories
great companies because of a run-up in                    reached their price targets, resulting in our         at record lows, earnings could surprise on
price. Factor in transaction costs, and                   exit. As a result, we have reduced the num-           the upside. In the medium-to-long-term
selling within a few points of our tar-                   ber of positions in the portfolio from 93 to          we think that state-owned enterprise
get price is not always the right answer.                 88 during the quarter.                                (SOE) reform and thus improved gover-
On the other hand, the market is there to                                                                       nance will be important drivers of higher
                                                                                                                returns.
 HISTORICAL PRICE DEVELOPMENT SKAGEN KON-TIKI
                                                                                                                    Eros International Media is a leading
                                                                                                                co-producer, acquirer and distributor of
   80                                         SKAGEN Kon-Tiki                                              80

   60                                                                                                      60
                                                                                                                Indian language films. The company has
   40                                                                                                      40
                                                                                                                a strong position in a growing industry,
                                                                                                                and is led by an experienced team. Trading
   20                                                                                                      20   at 14x next year’s earnings at the time of
                                                                      MSCI EM Index
                                                                                                                our purchase, we did not pay much for our
    1                                                                                                      10   favourable expectations.

        2003   2004   2005   2006   2007   2008    2009     2010   2011    2012       2013   2014   2015

                                                                                                                  S K A G E N F U N DS H A LF Y E A R RE PORT | 2 0 1 5
                                                                                                                                                                          19
You can also read