HARYANA THE BREADBASKET OF INDIA - SHEIKH CHILLI TOMB IN KURUKSHETRA, HARYANA
←
→
Page content transcription
If your browser does not render page correctly, please read the page content below
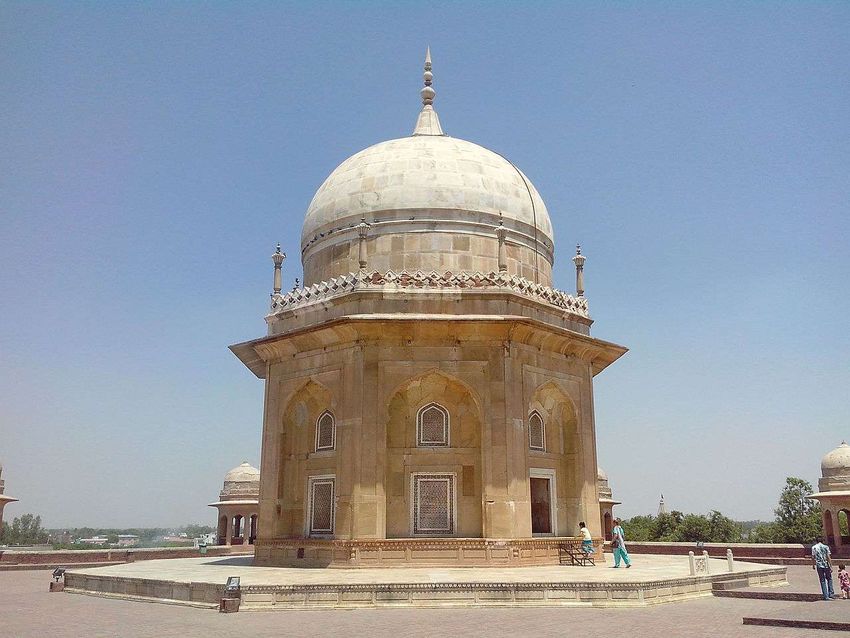
SHEIKH CHILLI TOMB IN KURUKSHETRA, HARYANA

 HARYANA
 THE BREADBASKET OF INDIA

For updated information, please visit www.ibef.org                                  March 2020
Table of Content

  Executive Summary .…………….…….…....3

  Introduction ……..………………………...….4

  Economic Snapshot ……………….….…….9

  Physical Infrastructure ………..……...........15

  Social Infrastructure …..……..……….........22

  Industrial Infrastructure ……..……….........25

  Key Sectors ………….……….………..…...29

  Key Procedures & Policies………………...37

  Annexure.………….……..….......................47
EXECUTIVE SUMMARY
With an area covering 1.3 per cent of the country, Haryana contributed near 3.63 per cent to India’s GDP in
Strong economic growth
2017-18. Between 2011-12 and 2019-20, the GSDP (in Rs) grew at a CAGR of 14.86 per cent.
Haryana is home to Maruti Udyog Ltd, India’s largest passenger car manufacturer & Hero MotoCorp Ltd,
Leading manufacturing
world's largest manufacturer of two wheelers. Under ‘Make in India’ project, Manesar-Bawal Investment
hub Region has been identified by the Government to be a manufacturing hub.
Haryana is the second largest contributor of food grains to India’s central pool.
The state accounted for 7.28 per cent of India’s agricultural exports in 2018-19. In 2018-19, the state exported
Leading food producer
major agricultural products worth US$ 1,366.95 million and reached US$ 807.78 million during April-December
2019.
Haryana is the third-largest exporter of software and one of the preferred destinations for IT/ITeS facilities in
Growing IT sector
India. The software and IT export for the FY18 is expected to be US$ 8.0 billion from Haryana.
The state has invested in the development of world class infrastructure facilities such as special economic
zones (SEZs), Kundli-Manesar-Palwal (KMP) global corridor and Delhi-Mumbai Industrial Corridor (DMIC).
Haryana enjoys a location advantage, with nearly one-third of the state’s area under the National Capital
Infrastructure support
Region (NCR), a prominent trade and consumption centre.
Haryana was ranked third best state in the country ease of doing business in the Business Reforms Action
Plan 2017.
Note: GSDP – Gross State Domestic Product, 2018-19
Source: Directorate of Economics & Statistics of Haryana, Central Statistics Office, Economic Survey of Haryana 2017-18, APEDA
3 HARYANA For updated information, please visit www.ibef.org
HARYANA

INTRODUCTION
FACT FILE
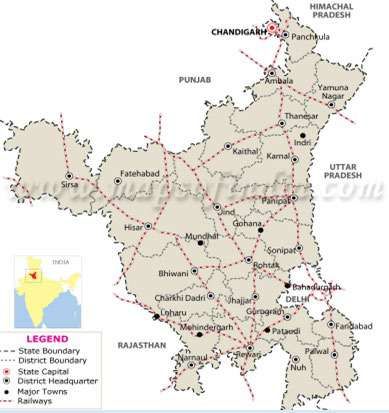
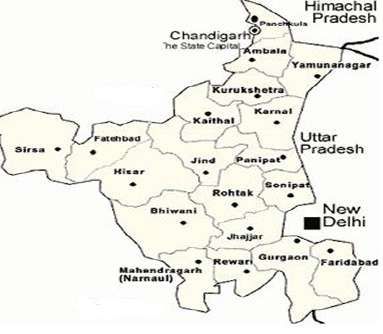
Haryana is surrounded by Uttar Pradesh in the east, Punjab in the
west, Himachal Pradesh in the north and Rajasthan in the south. The
state surrounds the national capital city, New Delhi, from three sides.
The most commonly spoken languages are Hindi and Punjabi.
English is the medium of education in most schools.
Gurgaon, Faridabad, Karnal, Ambala, Panipat & Kurukshetra are
some of the key districts of the state.
The state has three major seasons, viz. summer (April-June),
monsoon (July-September) and winter (October-March). Parameters Haryana
Capital Chandigarh
Geographical area (sq km) 44,212
Administrative districts (No) 22
Population density (persons per sq km) 573
Total population (million) 25.4
Male population (million) 13.5
Female population (million) 11.9
Sex ratio (females per 1,000 males) 879
Literacy rate (%) 75.5
Source: Economic Survey of Haryana, Census 2011
5 HARYANA For updated information, please visit www.ibef.org
STATE ADVANTAGE
Leading business hub Attractive investment avenues
Haryana is one of the leading states in terms of industrial Haryana has emerged as a manufacturing hub, with
production, especially passenger cars, two-wheelers, mobile immense scope for development of micro, small &
cranes & tractors. The Gurgaon-Manesar-Bawal belt is the medium enterprises (MSMEs) sector. The state adopted a
auto hub of India. cluster-based development approach to promote
Haryana has emerged as a base for the knowledge industry, industries such as IT, textiles, food & handloom.
including IT & biotechnology. Many large Indian & The state’s real estate market is attractive and it is a
multinational companies have set up offices in the state due preferred automotive hub. Of the total 250 large & medium
to its high-quality infrastructure and proximity to Delhi. OEMs, about 50 are located in Haryana.
Advantage
Haryana
Rich labour pool Policy & infrastructure support
Haryana has a large base of skilled labour, making it an ideal With a stable political environment, successive
destination for knowledge-based & manufacturing sectors. It governments have been committed to creating a
also has a large pool for support services. progressive environment.
The state has set up various national level institutions such as The state offers a wide range of fiscal & policy incentives
Indian Institute of Management (IIM), Indian Institute of for businesses under the Industrial & Investment Policy,
Corporate Affairs (IICA), Central Institute for Plastics 2011. It also has sector-specific policies, particularly for IT
Engineering & Technology (CIPET) & National Institute of & tourism.
Food Technology & Entrepreneurship & Management It has well developed infrastructure like power, roads and
(NIFTEM). railways. For trade promotion, the state has planned
several projects.
Note: GSDP – Gross State Domestic Product, exchange rate used is average of 2017-18 i.e. USD = INR 64.45, OEM – Original Equipment Manufacturer
6 HARYANA For updated information, please visit www.ibef.org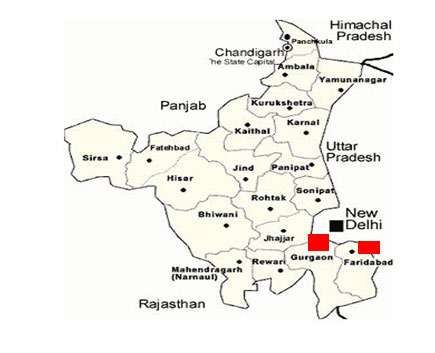
STATE VISION
Develop IMTs, industrial parks &
expand industrial estates
Contain revenue & fiscal deficit.
Create E-biz portal to ensure ease of
Commencement of mining & e-taxation doing business.
projects would reduce revenue deficit.
Address needs of MSMEs in areas of R&D
and technology; develop rail connectivity
to airports, etc.
Manage surface water resources
efficiently. Ensure availability of affordable
Improve water availability by pursuing housing for all.
Economy Infrastructure
upstream storage dams. Provide financial assistance for
Implement schemes for remodelling, construction.
rehabilitate water courses, flood Irrigation Housing Offer loans at reasonable terms
control. to BPL families.
Vision
2030
Timely availability of quality feedstock Agriculture Tourism
at subsidised rates. Fully utilise nature’s endowment
Modernise irrigation systems. Create network of business and
Pursue crop diversification & introduce Welfare Education tourism facilities.
modern technologies.
Schemes to develop SC, BC and other Improve quality of education and
vulnerable sections of society. access to schools.
Healthcare for women and children. Expand college and university
network.
Modernise police department.
Enhance sports education and
infrastructure to prepare people for
competing at international &
Source: Government of Haryana national events.
7 HARYANA For updated information, please visit www.ibef.orgHARYANA IN FIGURES
Haryana’s Contribution to Indian Economy (2018-19) Physical Infrastructure in Haryana
Parameter Haryana India Parameter Haryana India
GSDP as a percentage of all Installed power capacity
3.32 100.0
states’ GSDP (MW) (as of February 12,500.44 369,427.97
2020)
GSDP growth rate (%) 12.59 12.3
Wireless subscribers (No)
Per capita GSDP (US$)* 2,975.29 1,750.29 27.85 1,151.43
(as of Dec 2019)
Social Indicators Internet subscribers (Mn)
16.02 687.62
(as of September 2019)
Parameter Haryana India
National highway length
Literacy rate (%) 75.6 74.0 3,166 132,499
(km) (November 2019)
Birth rate (per 1,000
20.7 20.4 Major and minor ports
population) (2017) 1 13+187
(No)
Industrial Infrastructure Investments (US$ billion)
Parameter Haryana India Parameter Haryana India
Operational PPP projects (No)
28 1824 Cumulative FDI equity inflows
1
(as of December 2019)
89.68 436.47
between April 2000-June 2019
Exporting SEZs (November
7 238
2019)
Note: GSDP, per capita GSDP figures are for 2018-19 taken at current prices, exchange rates used is average of 2018-19 i.e. 72.15, For source refer to Annexure, 1Includes Delhi, part of
UP, * Per capita GSDP data is for 2017-18
Source: Economic Survey of Haryana 2018-19
8 HARYANA For updated information, please visit www.ibef.orgHARYANA ECONOMIC SNAPSHOT
ECONOMIC SNAPSHOT – GSDP
GSDP of Haryana at Current Prices Per Capita GSDP of Haryana at Current Prices
160 10 3,500 250000
CAGR (in Rs) 13.63% CAGR (in Rs) 11.39%
140 9
9.40
8 3,000
200000
134.46
120
8.32
2,975.29
7 2,500
199,612
2,741.09
118.99
2,683.19
7.34
100
2,519.02
179,432
6
2,458.69
2,427.69
150000
6.50
101.76
100.79
164,077
80 5 2,000
152,401
5.62
83.71
133,875
4.96
4 1,500
75.70
60
71.49
100000
4.37
116,408
65.99
3.99
63.73
3
62.05
3.47
40 1,000
2.98
2
20 50000
1 500
0 0
0 0
2011-12
2012-13
2013-14
2014-15
2015-16
2017-18
2016-17P
2018-19Q
2019-20A
2020-21A
2011-12
2012-13
2013-14
2014-15
2015-16
2016-17
US$ billion Rs trillion US$ Rs
At current prices, the total GSDP of Haryana reached Rs 7.85 The state’s per capita GSDP in 2016-17 (P) was Rs 199,612
trillion (US$ 112.31 billion) in 2019-20. (US$ 2,975.29).
The state’s GSDP increased at a Compound Annual Growth The per capita GSDP (in Rs) increased at a CAGR of 11.39
Rate (CAGR) (in Rs) of 12.16 per cent between 2011-12 and per cent between 2011-12 and 2016-17.
2018-19(A).
Note: exchange rates used are averages of each year, P- provisional, Q – quick estimates, A – advanced estimates,
Source: Directorate of Economics & Statistics of Haryana, MOSPI, Economic Survey of Haryana 2018-19
10 HARYANA For updated information, please visit www.ibef.orgECONOMIC SNAPSHOT – NSDP
NSDP of Haryana at Current Prices NSDP per capita of Haryana at Constant Prices*
CAGR (in Rs) 12.75% CAGR 11.45%
80 6 3,500 250000
70 3,000
73.65
226,644
5
3,141.29
200000
3,056.35
66.93
60
4.94
2,500
64.74
196,982
2,666.42
60
4
178,890
4.38
2,472.17
57.73
2,409.04
56.55
50 2,000 150000
2,277.19
161,828
3.96
2,227.16
2,212.41
147,313
3.64
40 3
137,770
1,500
3.14
121,269
100000
30
2.71
106,085
2 1,000
20 50000
1 500
10
0 0 0 0
2011-12
2012-13
2013-14
2014-15
2015-16
2016-17P
2017-18Q
2018-19A
2011-12
2012-13
2013-14
2014-15
2015-16
2016-17
US$ billion Rs trillion US$ Rs
At current prices, the Net State Domestic Product (NSDP) of The state’s per capita NSDP in 2018-19 (A) reached Rs
Haryana was about Rs 4.94 trillion (US$ 73.65 billion) in 2016- 2,26,644 (US$ 3,141.29), one of the highest in all Indian
17. states.
The state’s NSDP (in Rs) expanded at a CAGR of 12.75 per Per capita NSDP (in Rs) increased at an average rate of 11.45
cent between 2011-12 and 2016-17. per cent between 2011-12 and 2018-19 (A).
Note: exchange rates used are averages of each year, P- provisional, Q – quick estimates, A – advanced estimates, updated data expected in 2019, * - Since current prices estimates is
not available we have taken the constant prices
Source: Directorate of Economics & Statistics of Haryana, MOSPI, Economic Survey of Haryana 2018-19
11 HARYANA For updated information, please visit www.ibef.orgECONOMIC SNAPSHOT – PERCENTAGE
DISTRIBUTION OF GSVA
Services sector at constant (2011-12) prices, was the largest GSVA Composition by Sector at Current (2011-12) Prices
contributor to Haryana’s Gross State Value Added (GSVA) in 2018-
19 (A) with a share of 50.17 per cent. The sector has grown at a 100%
44.85% CAGR 50.17%
CAGR of 9.51 per cent between 2011-12 and 2018-19 (A).
90%
Industry sector contributed 32.31 per cent to the state’s GSVA in 80% 9.51%
2018-19 (A) at constant (2011-12) prices. The sector has grown at a
70%
CAGR of 8.12 per cent between 2011-12 and 2018-19 (A).
60%
The agriculture & allied sector contributed 17.52 per cent to the
50% 31.60% 8.12%
GSVA in 2018-19 at constant (2011-12) prices and grew at a CAGR 32.31%
of 3.32 per cent between 2011-12 and 2018-19 (A). 40%
30%
20% 23.55%
3.32% 17.52%
10%
0%
2011-12 2018-19
Agriculture & Allied Sectors Industry Services
Note: A – advanced estimates
Source: Economic Survey of Haryana 2018-19
12 HARYANA For updated information, please visit www.ibef.orgECONOMIC SNAPSHOT – FDI INFLOWS &
INVESTMENTS
FDI Inflows in Haryana1 in April 2000-September 2019 (US$ Proposed Investments
billion)
Proposed investments
90 8.9 84.6 Year IEMs filed
80 7.7 (in US$ million)
5.9 5.0
70 12.7
60 2015 75 434.13
6.9
50 6.2
40 3.2 2016 58 326
8.0
30 25.1
20 2017 44 381.37
10
0 2018 75 356.70
FY12
FY13
FY14
FY15
FY16
FY17
FY18
FY19
FY20
FY01-11
FY01-19
2019 82 1185.15
According to the Department for Promotion of Industry and Internal Trade (DPIIT), cumulative foreign direct investment (FDI) inflows in Haryana
from April 2000 to June 2019 stood at US$ 89.6 billion.
The services sector accounted for a major share in FDI followed by real estate & electricity.
In May 2018, Government of Haryana signed 10 memoranda of understanding (MoUs) with UK for various projects requiring investment of around
Rs 1,500 crore (US$ 232.74 million).
Between FY15-18, Haryana has witnessed investments of around Rs 80,000 crore (US$ 11.93 billion)(up to December 2018).
Note: 1Includes Delhi, part of UP, IEM - Industrial Entrepreneurs' Memorandum
Source: Department Of Industrial Policy & Promotion, *Minister of Industries and Commerce, Haryana
13 HARYANA For updated information, please visit www.ibef.orgECONOMIC SNAPSHOT – EXPORTS
Merchandise Exports from Haryana (US$ billion) Major Commodities Exported in FY19
16.0 Basmati Rice
14.0
Electric Machinery and
13.83 10.6% Equipment
12.0 13.26
10.2% Ready Made Garments
10.0 11.30
10.34 10.69 of Cotton
8.0 8.91 4.4% Auto Components
3.4%
6.0
64.7% Motor Vehicles
3.4%
4.0
3.3% Ready Made Garments
2.0 of Manmade Fibres
0.0 Others
FY15 FY16 FY17 FY18 FY19 FY20#
The setting up of SEZs in sectors like IT/ITeS, biotechnology, handicrafts, etc. has helped increase exports in the state.
Merchandise exports from Haryana reached US$ 13.83 billion in FY19 and US$ 8.91 billion during April-December 2019. The software and IT
export for the FY18 is expected to be US$ 8 billion from Haryana.
Haryana is amongst the biggest producers of food grains in India. More than 60 percent export of Basmati Rice from India is taking place from
Haryana alone.
Note: #- till December 2019
Source: DGCIS Analytics, Economic Survey of Haryana 2018-19
14 HARYANA For updated information, please visit www.ibef.orgHARYANA PHYSICAL INFRASTRUCTURE
PHYSICAL INFRASTRUCTURE – ROADS
Road Network in Haryana as of March 2019
National highway length completed (km)
Type Length (km)
400.00
350.00 368.90 National Highways 3,166
300.00
250.00 291.00
State Highways 1,801
200.00
150.00 169.80 168.00
100.00 Major District Roads 1,395
50.00 86.10
0.00 Other District Roads 20,700
2014-15 2015-16 2016-17 2017-18 2018-19
A new National Highway, NH-152D, with a length of 230 km will be constructed from Kurukshetra district to Mahendragarh district in Haryana at a
cost of Rs 5,108 crore (US$ 707.97 billion).
As of November 2018, the state had a road network of 26,431 km. During 2018-19, 168 km of national highways were constructed in the state.
Haryana is among the states having almost 100 per cent connectivity to rural areas with metalled roads. Haryana Roadways, with its fleet of
nearly 4,215 buses, is one of India’s biggest state road transport undertakings which operate across 12.70 lakh km everyday.
Under State Budget 2018-19, 4.73 per cent of the total expenditure was allocated to roads & bridges. The Kundli-Manesar-Palwal (KMP)
Expressway was inaugurated in November 2018.
Source: Economic Survey of Haryana 2018-19, Ministry of Road Transport & Highways, Government of India, News articles, NHAI, Lok sabha
16 HARYANA For updated information, please visit www.ibef.orgPHYSICAL INFRASTRUCTURE – RAILWAYS
Rail network across the state
Haryana has a 1,710.49 km long rail route. Kalka, Kurukshetra,
Rohtak, Jind, Hisar, Ambala, Panipat, Gurgaon & Jakhal are some
of the important railway stations. There is a railway workshop at
Jagadhari.
Government of Haryana has formed a joint venture with the Indian
Railways named ‘Haryana Rail Infrastructure Development
Corporation Limited (HRIDC)’ to undertake railway projects in the
state.
As per State Budget 2018-19, work on elevation of Rohtak-Gohana-
Panipat line and Rohtak-Meham-Hansi railway lines are in progress.
A new high speed rail network between Delhi and Haryana was
approved in June 2018 with work on it expected to be started by
March 2019. The Escorts Mujesar-Ballabgarh section of the Violet
Line Metro was launched in November 2018, further improving the
rapid transport connectivity in the state.
Source: Economic Survey of Haryana, State Budget 2018-19, 2017-18, Maps of India
17 HARYANA For updated information, please visit www.ibef.orgPHYSICAL INFRASTRUCTURE – AIRPORTS
There is a domestic airport at Chandigarh and civil aerodromes at Hisar civil aerodrome will be upgraded into an international airport.
Pinjore, Karnal, Hissar, Bhiwani and Narnaul. The state has a total Under the first phase of construction, the aerodome would be
of eight airports, which includes both operational and non- converted into a domestic airport. The airport will also be covered
operational airports. under the regional connectivity scheme of UDAAN. Domestic flights
from the Hisar airport are expected to begin from November 2018.
In September 2015, a new terminal at Chandigarh airport was
inaugurated. The terminal is capable of handling both domestic and Under State Budget 2018-19, Rs 201.27 crore (US$ 31.23 million)
international flights. The cost incurred in the construction of the was allocated for civil aviation.
airport by AAI is US$ 155.77 million. A stake of 51 per cent was
The Chandigarh airport handled 2,137,739 passengers, 5,650 metric
taken by the AAI and shares of 24.5 per cent each were held by the
tonnes of freight and saw 18,715 aircraft movements in 2017-18.
state’s of Punjab and Haryana.
Domestic
Passengers Aircraft movement Freight (MT)
airport
2017-18 2018-19 2019-20* 2017-18 2018-19 2019-20* 2017-18 2018-19 2019-20*
Chandigarh 2,137,739 2,097,698 20,47,447 18,715 17,003 15,103 5,650 5,051 7,812
Note: *- Till January 2020
Source: Airports Authority of India, State Budget 2018-19, 2017-18, 2016-17
18 HARYANA For updated information, please visit www.ibef.orgPHYSICAL INFRASTRUCTURE – POWER
Installed Power Capacity (MW) Classification of Installed Power Capacity* (MW)
531.30 100.94
14,000
12,000
Thermal
12,500
11,272
11,242
10,000
11,056
2,312.02
8,000 Hydro
8,788
8,754
8,665
8,114
6,000
6,882
5,985
Renewable
5,071.00
4,000
4,630
2,000
Nuclear
0 9,556.18
FY09
FY10
FY11
FY12
FY13
FY14
FY15
FY16
FY17
FY18
FY19
FY20*
As of February 2020, Haryana had a total installed power generation capacity of 12,500.44 MW; of which, 5557.78 MW by the private sector,
3,139.30 MW was contributed by the state and 3803.36 MW by the central sector.
Energy requirement in Haryana in Apr-Sept 2019 was 37,036 million units.
Peak demand in the state for 2019-20 (up to Sept 2019) reached 11,001 MW.
Under State Budget 2019-20, Rs 12,988.61 crore (US$ 1.86 billion) for Power Department and Rs 475.91 crore (US$ 68 million) for Department of
New and Renewable Energy.
Between 2015-17, 73 sub-stations have been established to strengthen the transmission and distribution system in the state.
Note: GWH – Giga Watt Hours, *- Till February 2020
Source: Central Electricity Authority, Annual Budget 2019-20, Economic Survey of Haryana 2018-19
19 HARYANA For updated information, please visit www.ibef.orgPHYSICAL INFRASTRUCTURE – TELECOM
Telecom Infrastructure (As of December 2019) Performance of Bharat Net
Wireless subscribers 27,795,354
Optical Fiber Cable laid (up to December
12,013
02, 2018)
Wireline subscribers 272,306
Internet subscribers(as of Sept 2019) (mn) 16.02
Service Ready GPs (as of November 11,
6,188
2019)
Tele density (%) 96.99
According to the Telecom Regulatory Authority of India (TRAI), Haryana had 27.79 million wireless subscribers and 272,306 wireline subscribers,
as of December 2019. The number of internet subscribers in the state as of September 2019 stood at 16.02 million.
By the end of December 2019, 16.97 million subscribers had submitted requests for mobile number portability in Haryana.
The state of Haryana had a tele-density of 96.99 per cent as of December 2019.
In consultation with telecom power companies, Haryana government has rolled out a new Communication and Connectivity Policy to provide a
major push to telecom and communication infrastructure in the state.
As of of November 11, 2019, there were 6,188 service ready gram panchayats in the state, connected through optical fibre under the Bharat Net.
Note: GP-Gram Panchayat
Source: Telecom Regulatory Authority of India; Department of Telecommunications- Ministry of Communications & Information Technology, India Post
20 HARYANA For updated information, please visit www.ibef.orgPHYSICAL INFRASTRUCTURE – URBAN
The state government has provided an impetus & would continue to Smart cities in Haryana
the financial status of urban local bodies & pr;ovide adequate funds
for improving civic amenities in urban areas. There are 77 urban local Cities Population Area (sq. km) Literacy rate
bodies in the state, consisting of 9 municipal corporations, 19
municipal councils & 50 municipal committees. Faridabad 1,809,733 741 81.70%
Under State-Budget 2019-20, Rs 3,994.95 crore (US$ 571.61 million) Karnal 1,505,324 1,967 74.73%
has been allocated for urban development.
Under the State-Budget 2019-20, government has allocated Rs 400
crore (US$ 57.23 million) for the development of smart cities and
AMRUT missions.
Swachh Bharat Mission (Urban) has been implemented in all 80 Karnal
statutory towns & cities in Haryana. The state has been declared
Open Defecation Free.
The Haryana Roadways had 3,944 buses operational as of November
2018, servicing 105 bus stops in the state.
The state’s 20 cities & towns are included in the AMRUT Mission. As Faridabad
of January 2019, Rs 2,565.74 crore (US$ 398.1 million) has been
allocated to cities in Haryana under the AMRUT scheme.
Source: JNNURM, Ministry of Urban Development, Directorate of Urban Local Bodies-Haryana, Economic Survey, Transport Department, Economic Survey of Haryana 2018-19
21 HARYANA For updated information, please visit www.ibef.orgHARYANA SOCIAL INFRASTRUCTURE
SOCIAL INFRASTRUCTURE – EDUCATION
Higher Education Statistics (2018-19) School Education Statistics
Universities 48 Primary Schools (Government + Private) 8,747 + 1,214
Middle Schools (Government + Private) 2,433 + 3,095
Colleges 1038
High Schools (Government + Private) 1,215 + 2,007
Gross Enrolment Ratio 28.7 Senior Secondary Schools (Government +
2,056 + 2,730
Private)
Pupil teacher Ratio 26 Pupil Teacher Ratio* 18
The state has a strong primary education infrastructure, with a primary school located within a 1.03 km radius of each village and a middle school
within a 1.07 km radius.
Under the State Budget 2019-20, Rs 6,101 crore (US$ 872.9 million) and Rs 3,389 crore (US$ 484.90 million) has been allocated by government
for the growth of government primary and secondary schools.
As of October 2018, Haryana had 9,961 primary schools, 5,528 middle schools, 3,222 high schools and 4,786 senior secondary schools in
operation.
For higher education, there are 48 universities and 1038 colleges operational in the state as per All India Survey on Higher Education 2018-19.
Note: * 2016-17
Source: Haryana at A Glance, Unified District Information System for Education, AISHE 2018-189, Saksham Haryana Education Portal
23 HARYANA For updated information, please visit www.ibef.orgSOCIAL INFRASTRUCTURE – HEALTH
Allocation under National Health Mission (US$ million)(up to Health indicators (2017)
December 2017,)
90.00 1
80.00 Birth rate 20.5
70.00 76.53 79.13
60.00 67.99
50.00
1
40.00 Death rate 5.9
30.00 35.18
20.00
10.00
3
- Infant mortality rate 33
2014-15 2015-16 2016-17 2017-18
As per state’s Economic Survey 2017-18, the state government is providing services through 60 hospitals, 124 Community Health Centres, 500
Primary Health Centres and 2,630 Sub-Health Centres.
According to the State Budget 2019-20, for the development of hospitals and dispensaries government has allocated Rs 1,094 crore (US$ 156.53
million) and Rs 995 crore (US$ 142.36 million) for primary health centres in rural areas.
Under ‘Mukhya Mantri Muft Ilaj Yojana’ seven types of medical services are being provided for free in Haryana.
Further, the state government has also decided to set up an AYUSH University as well as AYUSH Cell across every PHC of the state.
Note: 1Per thousand persons, 2Per thousand live births, Exchange rate used is average of 2017-18 i.e. USD = INR 64.45
Source: Annual Budget, Sample Registration System (SRS) Bulletin,Haryana
24 HARYANA For updated information, please visit www.ibef.orgHARYANA INDUSTRIAL INFRASTRUCTURE
INDUSTRIAL INFRASTRUCTURE… (1/3)
Historically an agrarian state, Haryana today is a well-developed Mega-projects of Haryana
industrial state. HSIIDC is the state’s premier industrial promotion
Kundli-Manesar-Palwal (KMP) Expressway on Build-Operate-Transfer
agency. It is responsible for providing reliable and efficient facilities to (BOT) basis
entrepreneurs investing in the state.
Delhi-Mumbai Industrial Corridor (DMIC) Project
HSIIDC has developed a number of industrial estates, industrial Manesar Bawal Investment Region (MBIR)
model townships and specialised parks for industrial cluster Early Bird Projects (Global City Project, Integrated Multimodal Logistics
development. Hub (IMLH), Mass Rapid Transit System Between Gurgaon-Manesar-
Bawal (MRTS)
As of November 2019, the state had seven exporting Special
Economic Zones.
The government is developing sector specific theme parks and sub-
cities along the Kundli-Manesar-Palwal (KMP) expressway. The 135-
km KMP expressway will act as a Delhi bypass and provide
seamless connectivity across NH-1, NH-2, NH-8 and NH-10. Total
cost of the project is US$ 414.73 million.
Source: Ministry of Commerce & Industry, Government of India, HSIIDC
26 HARYANA For updated information, please visit www.ibef.orgINDUSTRIAL INFRASTRUCTURE… (2/3) – INDUSTRIAL
ESTATES
Estate/location Brief Description
IMT Manesar Located at a distance of 50 km from Delhi on NH-8 & about 32 km from the IGI Airport.
(Phase I is complete, Phases II, III, IV and V Focus on hi-tech and hi-precision non-polluting units such as automotive, readymade garments,
are undergoing development) ITeS and packaging.
Located on NH-10, about 250 km from New Delhi.
IIDC, Saha (Status- Planned & Developed)
HSIIDC acquired around 76 acres of land for setting up IIDC in Saha.
Located on NH-8, about 8 km from IGI.
Focus on IT/ITeS, electronics, electrical goods, pharmaceuticals, light engineering, auto parts and
Udyog Vihar, Gurgaon
components and readymade garment sectors.
Maruti Udyog, a leading car manufacturer of India, has its base in Udyog Vihar.
Kundli
Phases I, II, IV, EPIP and Electronic Located on NH-1 on the Delhi-Haryana border, about 20 km from Delhi.
Hardware Technology Park (Status - Has industrial units from general engineering, cycle parts, dairy products & agro-based sectors.
Planned & Developed)
Located about 35 km from New Delhi, on the Delhi-Mathura highway.
Faridabad
Has industrial units for the light engineering sector.
Located about 50 km from New Delhi, on NH-1.
Murthal
Has industrial units from general engineering, malt, chemicals & cycle parts sectors.
Located about 89 km from New Delhi, on NH-1.
Panipat (Status - Fully Developed) It covers 922 acres of area and is a well-equipped facility with an internal road network & electric
distribution system.
Source: HSIIDC website
27 HARYANA For updated information, please visit www.ibef.orgINDUSTRIAL INFRASTRUCTURE… (3/3) – INDUSTRIAL
ESTATES
Estate/location Brief Description
Located about 200 km from New Delhi, on NH-1.
Has industrial units from scientific instruments, electronic and light engineering sectors.
Ambala
It also has a United Nations Development Programme (UNDP) assisted instrument design and
development centre.
Located about 200 km from New Delhi.
Tohana (Status- Planned & Developed)
Has industrial units from agriculture implements, foundry and light engineering sectors.
Located about 120 km from New Delhi.
Jind
Has agro-based industries, leather based products and chemical industries.
Located about 70 km from New Delhi on NH-1.
Samalkha (Status- Planned & Developed)
Has light engineering and foundry units.
Located about 35 km from New Delhi on NH-1.
Rai (Status- Planned & Developed)
A food park and a technology park have been developed here.
Barwala (Phase-l Completed and Phase-ll Located at about 240 km from New Delhi, Panchkula-Saha State Highway, in District Panchkula
under-construction) Has industrial units of plywood, pharmaceuticals units and light engineering works.
Other industrial estates under implementation are ancillary estates at Panchkula, Kalka, Murthal, integrated infrastructure development centre at
Sirsa, built-up sheds near Sohna, and estates at Manakpur in Yamuna Nagar.
Source: HSIIDC website
28 HARYANA For updated information, please visit www.ibef.orgHARYANA KEY SECTORS Agriculture and Allied Industries Automotives IT & ITeS Textiles
KEY SECTOR – AGRICULTURAL AND ALLIED
INDUSTRIES… (1/2)
Agricultural Production (2018-19*)
Haryana’s Total Horticulture Production (‘000 MT)
Area (‘000 Yield Annual production
Crop
hectares) (kgs/hectare) (‘000 Tonnes)
9,000
8,000 Rice 1,422 3,432 4,299.3^^
8,092
8030.38
8,016
7,000
6,000 6,819 Kharif Pulses 20 739 15
6,337
6,286
5,000
5,676
4,000 Wheat 2,526 4,624 11,162.4^
3,000
2,000 Rabi Pules 10 1,200 12
1,000
Sugarcane 114 76,359 10,893.5^^
0
2012-13
2013-14
2014-15
2015-16
2016-17
2017-18
2018-19**
Cotton (lint) 669 413 1,626
Oilseeds 605 1,626 13.0^^
Agriculture is one of the biggest employment generators in rural Haryana, with strong potential in value addition & exports. Haryana is self-
sufficient in food production and the second largest contributor of food grains to the central pool. The Department of Horticulture encourages a
cluster approach for the development of fruit cultivation. Wheat, sugarcane, rice, cotton, rapeseed and mustard are key agricultural products of
the state. In 2018-19, the state exported major agricultural products worth US$ 1.3 billion and worth US$ 807.76 million between Apr-Dec 2019.
Krishi Kiosk online service for farmers was launched in June’19 which will provide information about government current and upcoming schemes
also help them to file claim under the Pradhan Mantri Fasal Yojana.
Under its’ ‘Horticulture Vision’ the state government aims to double the area of under horticulture from 7.5 per cent to 15 per cent and triple the
horticulture production by 2030. The state government has also notified the Haryana Agri-Business and Food Processing Policy 2018.
Total foodgrain production in Haryana in 2017-18 was 16.58^ million tonnes. Foodgrain and horticulture production in the state reached 5.30
million tonnes and 10.41 million tonnes, respectively, during 2018-19**
Note: ** - 3rd advance estimates, ^^- 1st advance estimates (Kharif only), ^ - As per 4th Advance Estimates, Data for Wheat is as per 2017-18*
Source: Economic Survey of Haryana, Ministry of Agriculture- Department of Agriculture & Cooperation, Government of India, State Budget 2019-20, 2017-18
30 HARYANA For updated information, please visit www.ibef.orgKEY SECTOR – AGRICULTURAL AND ALLIED
INDUSTRIES… (2/2)
Key players
Nestle India Ltd Nestle India is a subsidiary of Nestle SA, Switzerland. Its Indian headquarter is in Gurgaon, Haryana. Its
famous brands in India include Nescafé, Maggi, Milkybar, Milo, Kit Kat, Bar-One, Milkmaid, Nestea, Nestle
Milk, Nestle Fresh 'n' Natural Dahi and Nestle Jeera Raita.
The company has a factory at Samalkha, Panipat, which was commissioned in 1993, to manufacture milk
products.
GlaxoSmithKline GlaxoSmithKline Consumer Healthcare Ltd (GSKCH) is an Indian group company/associate of
Consumer Healthcare
GlaxoSmithKline UK and one of the largest players in the health food & drink industry in India.
Ltd (GSK)
GSK has a factory at village Khewra, Sonipat, with a capacity of 26,100 tonnes per annum for its brand
Horlicks.
Haldiram’s Foods Haldiram's started in Bikaner and is one of India's largest sweets and snacks manufacturers. The company
International Ltd sells packaged food and snacks, which are not only consumed in domestic markets but also exported to
various countries viz., Pakistan, Canada, Australia, Sri Lanka, Singapore, Malaysia, South Africa,
Indonesia, Qatar, Hong Kong, Japan, Kenya, Libya and South Korea. Haldiram’s also has its own outlets
where it sells sweets and eatables.
In Haryana, Haldiram Manufacturing Co Pvt Ltd is located in village Kherki Daula on the Delhi-Jaipur
highway.
PepsiCo India
PepsiCo established its business operations in India in 1989. The company has a diverse range of
products including carbonated drinks and potato chips. It employs 6,400 people and provides indirect
employment to almost 200,000 people. It has 38 beverage bottling plants and three food plants in the
country.
Its corporate office is in Gurugram.
31 HARYANA For updated information, please visit www.ibef.orgKEY SECTOR – AUTOMOBILES… (1/2)
Automotive clusters in Haryana
Haryana is a preferred destination for auto majors and auto-
component manufacturers. The state is host to many large
automotive players.
The state produces two-thirds of passenger cars, 50 per cent of
tractors and 60 per cent of motorcycles manufactured in the country.
A significant percentage of the state’s workforce is engaged in the
automotive industry; Gurgaon & Faridabad are important automobile
centres.
The International Centre for Automotive Technology (ICAT) has been
set up at Manesar as a part of the National Automotive Testing &
Research & Development (R&D) Infrastructure Project (NATRiP). It
provides testing & R&D services to the industry.
Automobiles and auto component exports from Haryana were around
US$ 945 million in FY19 and have reached US$ 835.04 million
between 2019-20 (till December 2019).
Source: Haryana Economic Survey 2017-18, NSDC & KPMG – Human Resources and Skill Requirements in Auto and Auto Components Sector, DGCIS Analytics
32 HARYANA For updated information, please visit www.ibef.orgKEY SECTOR – AUTOMOTIVES… (2/2)
Key players
Maruti Suzuki India Ltd Maruti Suzuki India had a market share of around 40 cent in the Indian passenger car market at the end of March
2012. Its Gurgaon facility has three integrated plants, with an installed capacity of around 900,000 units; the fourth
plant is located at Manesar. The Gurgaon plant would eventually serve as a base for engine assembly and
machining, while automobile assembly is done at the Manesar plant.
The company had a 50 per cent share in Indian passenger car market in 2017-18. The company had an annual
production capacity of 1.56 million units in Haryana and produced 1.62 million units in 2017-18.
Escorts Group Escorts is a leading engineering conglomerate in the high growth sectors of agri-machinery, construction and
material handling equipment, railway equipment and auto components. Its corporate headquarters and
manufacturing facilities for tractor assembly, transmission and engines, crankshaft and hydraulics is located in
Faridabad.
Yamaha Motor Pvt Ltd Yamaha Motors is a 100 per cent subsidiary of Yamaha Motor Company Ltd, Japan. The company has more than
2,000 employees in India, and a countrywide network of over 400 dealers. It has a manufacturing plant in
Faridabad, which supplies bikes to the domestic as well as overseas market.
33 HARYANA For updated information, please visit www.ibef.orgKEY SECTOR – IT & ESDM… (1/2)
Exports of Electric Machinery & Equipment from Haryana (US$ IT & ITeS Cluster in Gurugram
million)
1,800
Global BPM workforce 5%
1,600
1,664.6
1,400
1,200 1,405.7
India’s BPM Workforce 13%
1,000
800
600 261.6 Contribution to Haryana’s GDP 10%
400 503.2
200 293.3 247.8
0 Contribution to Haryana’s Exports 54%
FY15 FY16 FY17 FY18 FY19 FY20*
Gurugram has emerged as a preferred destination for the IT industry in North India. As per Haryana’s economic survey 2017-18, licenses of 49 IT
parks have been granted while there are six IT/ITeS SEZs operational in the state.
Haryana is among the leading states in terms of IT exports.The software and IT export for the FY18 is expected to be US$ 8 billion from Haryana.
Exports of electric machinery and equipment for Haryana reached US$ 1.41 billion in FY19 and US$ 261.56 million in 2019-20 (till December
2019).
The state government has notified following policies for creating an ecosystem to take Haryana on the path of digital revolution:
• IT & ESDM Policy 2017
• Entrepreneur & Start up Policy 2017
• Communication & Connectivity Infrastructure Policy 2017
• Cyber Security Policy 2017
Note: ESDM - Electronics System Design & Manufacturing, *- till December 2019
Source: Haryana Economic Survey 2017-18, State Budget 2018-19, Government of Haryana, DGCIS Analytics
34 HARYANA For updated information, please visit www.ibef.orgKEY SECTOR – IT & ESDM… (2/2)
Key players
IBM Global Process IBM Global Process Services (formerly IBM Daksh) is a leading provider of business process solutions,
Services with its corporate office in Gurgaon. The company has 23 service delivery centres at nine locations in India
and Philippines and employs more than 100,000 persons, making it one of the largest Business Process
Outsourcing (BPO) vendors in India in terms of headcount. Haryana was awarded the software centre of
excellence by IBM.
Tata Consultancy
Services (TCS)
TCS is among the largest providers of IT and BPO services in India. The company’s clients are in BFSI,
healthcare & life sciences, insurance, manufacturing, media, entertainment, transportation, travel &
hospitality, retail, utilities and energy resources sectors. It commenced operations in Gurgaon in 1995.
Microsoft Corporation Microsoft entered India in 1990 and works closely with the Indian government, IT industry, academia and
the local developer community.
In India, Microsoft employs about 5,800 people and has six business units representing the complete
Microsoft product lifecycle. The company has two offices in Haryana, both at Gurgaon.
Google, a web based search engine, is the flagship product owned by Google, Inc. It offers special
Google
features such as synonyms, weather forecasts, time zones, stock quotes, maps, earthquake data, movie-
show times, airports, home listings and sports scores.
Google has a sales office in Gurgaon. It is a direct sales organisation and helps the world's biggest
advertisers to enjoy immediate and accountable communication with the consumer. The sales teams here
are structured according to industry verticals.
35 HARYANA For updated information, please visit www.ibef.orgKEY SECTOR – TEXTILES
Haryana’s Export of Ready Made Garments* of Cotton (US$
Cotton (Lint) Production in Haryana (‘000 bales of 170 Kg)
million)
1,000.00 3,000
900.00
800.00 880.2 887.6 2,500 2,638
846.7
700.00 2,000
600.00 2,027 1,939 2,041
500.00 607.5 1,500
567.4 1,626
400.00 476.8
1,000
300.00 993
200.00 500
100.00
- -
FY15 FY16 FY17 FY18 FY19 FY20** 2013-14 2014-15 2015-16 2016-17 2017-18 2018-19^
Haryana is the fourth largest producer of cotton in India and contributes around 6 per cent of the country’s total production. Easy availability of raw
material provides the state with competitive advantage in the textiles sector, which provides employment to around one million people in Haryana.
Districts such as Panipat, Gurugram, Faridabad, Hisar and Sonepat have developed into robust textile centers in Haryana.
Readymade garments of cotton are one of the major exports of Haryana, with their export reaching US$ 607.52 million in FY19 and US$ 567.37
million in 2019-20 (till December 2019).
The state government also notified a new Textile Policy 2018 to promote the development of the sector in the state.
Note: *including accessories, ^ - As per 1st Advance Estimates, **- till December 2019
Source: DGCIS Analytics, Haryana Textile Policy 2018, Invest India, Agriculture Department of Haryana
36 HARYANA For updated information, please visit www.ibef.orgHARYANA KEY PROCEDURES & POLICIES
SINGLE-WINDOW CLEARANCE MECHANISM
Single-window clearance mechanism was established under the Haryana Industrial Promotion Act, 2005. It has a three-tier structure to grant
exemption/relaxation from any of the provisions/rules of the Act.
The Investment Promotion Centres (IPC) located in New Delhi and Chandigarh and District Industries Centres (DIC) at the district level serve as
nodal agencies and provide support to the committees.
Investment Under the Nodal
handled Chairmanship of agencies
High-
Greater Powered Principal
Investment
than US$ Clearance Secretary to
Promotion
6.5 million Committee Chief Minister
Centre (IPC)
– State Level
US$ 1.09 State-Level District
Principal
to US$ 6.5 Clearance Industries
Secretary
million Committee Centre (DIC)
Industries
– District
Level
Less than District-Level
Deputy
US$ 1.09 Clearance
Commissioner
million Committee
38 HARYANA For updated information, please visit www.ibef.orgKEY INVESTMENT PROMOTION OFFICES
Agency Description
Focusses on the development of medium- and large-scale industries.
Haryana State Industrial and Infrastructure
Development Corporation Ltd (HSIIDC) Provides financial assistance by way of term loans, equipment re-finance, equipment leasing
and working capital.
Engaged in trading activities such as sale of seeds, fertilisers, pesticides, tractors and other
Haryana Agro Industries Corporation Ltd (HAIC)
agricultural machinery at economical prices to the farming community.
Haryana State Electronics Development Nodal agency of the Government of Haryana for promoting electronics and IT industries.
Corporation Ltd (HARTRON) It offers expertise in infrastructure development as well as promotion of projects.
Responsible for promoting and securing development of urban areas; activities include land
Haryana Urban Development Authority (HUDA) acquisition, development and sale of property for residential, industrial and commercial
purposes.
Haryana Finance Corporation (HFC) Meets the credit needs of small- and medium-scale industrial units by advancing term loans.
39 HARYANA For updated information, please visit www.ibef.orgCONTACT LIST
Agency Contact information
Plot No C-13-14, Sector 6,
Panchkula-134109
Haryana State Industrial and Infrastructure Development Corporation Ltd Phone: 91-172-2590 481
(HSIIDC) Fax: 91-172-2590 474
E-mail: info@hsiidc.org
Website: www.hsiidc.org
C-3, Sector-6,
Panchkula
Haryana Urban Development Authority (HUDA) Phone: 91-172-2567 857
E-mail: huda@hry.nic.in
Website: www.huda.gov.in
Bays 17-18-19, Sector 17-A,
Chandigarh-160017
Phone: 91-172-2702 755-57
Haryana Finance Corporation (HFC) Fax: 91-172-2702 666
E-mail: mdhfc@airtelmail.in
Website: www.hfcindia.org
SCO-109-110, Sector 17-B,
Chandigarh -160017
Haryana State Electronics Development Corporation Ltd (HARTRON) E-mail: hartron@hartron.org
Website: www.hartron.org.in
40 HARYANA For updated information, please visit www.ibef.orgKEY APPROVALS REQUIRED
Approvals and clearances required Department Estimated time
Site and/or environment clearance: 60 days
Department of Environment/Haryana No-objection certificate to establish: 7 days
Site clearances and No-objection Certificate
Pollution Control Board No-objection certificate to operate: 30 days
Renewal of consent: 21 days
Change of land use in industrial zone: 30 days
Approval, No-objection Certificate Department of Town and Country No objection certificate for establishment of industrial unit
and change of industrial land Planning under the Urban Area Act: 15 days
Approval of building plan: 30 days
Approval of factory plan under the Factories Act, 1948
Labour Department/ Chief Inspector of
Approval and licence (Act 63 of 1948): 90 days
Factories
Licence for running factory: 15 days
Load up to 20 KW: 21 days
Uttar Haryana Bijli Vitran
Load up to 70 KW: 45 days
Release of power connection Nigam/Dakshin Haryana Bijli Vitran
Load above 250 KW: 60 days
Nigam
Load above 1 MW: 60 days
Sales tax Excise and Taxation Sales tax registration: 15 days
41 HARYANA For updated information, please visit www.ibef.orgCOST OF DOING BUSINESS IN HARYANA
Cost parameter Cost estimate Source
Industrial land (per sq m) US$ 28.7-67 Industry sources
Gurgaon: US 31 cents to US 74 cents
Office space rent (per sq ft) Industry sources
per month
Residential rent (2,000 sq ft) US$ 287 to US$ 478 per month Industry sources
Five-star hotel room rent US$ 80.4 per room per night Leading hotels in the state
Power (per kWh) Commercial & Industrial: US 9.6 cents Industry sources
Water (per 1,000 litres) Commercial & Industrial: US 9.6 cents Water Supply and Sanitation Department
As per the World Bank and Department of Industrial Policy and Promotion (DIPP) report - Assessment of State Implementation of Business
Reforms 2017, the state ranked 3rd in the Ease of Doing Business Index.
42 HARYANA For updated information, please visit www.ibef.orgSTATE ACTS AND POLICIES …(1/3)
Objectives
Haryana Agri-Business Make the state a preferred investment destination for food processing sector
and
Promote start-ups in agri-business space in Haryana
Food Processing Policy
2018 Increase farmers’ income through new agro-marketing reforms Read more
To generate 50,000 new jobs in the textile sector
Textile Policy 2019 To boost textile export by CAGR of 20 per cent during the policy period
To achieve balanced regional growth especially promoting growth in the regions that are lagging in development
Read more
Attract US$ 2.79 billion as investments in IT & EDSM sector in the next five years
IT & ESDM Policy 2017 Provide employment to 120,000 people in the sector.
Increase IT & EDSM sector’s contribution to the state’s GDP from 9.4% to 15%. Read more
Attract orders for at least 15% of all offset obligations discharged by companies in India by leveraging the existing
Aerospace & Defence ancillary base and promoting new MSMEs dedicatedly for A&D sector
Policy 2016
To attract investment of over Rs 25,000 crore throughout the value-chain including research, design, development,
manufacturing, maintenance, quality control and training
Read more
The policy aims at two themes, namely - Sports for All and Excellence in Sports
Haryana Sports and
The policy covers five major goals such as - introduction to sports, recreational sports, competitive sports, high
Physical Fitness Policy
performance sports and sports for development. Read more
2015
43 HARYANA For updated information, please visit www.ibef.orgSTATE ACTS AND POLICIES …(2/3)
Objectives
Enterprise Promotion The major objectives of this policy is to facilitate ease of doing business in the state, reduction in cost of doing
Policy, 2015 business in order to attract more number of players, and have an increased focus on MSMEs
Read more
To develop hyper & high potential urban complexes in the state
New Integrated
Licensing Policy (NILP) To allow real estate developers in setting up projects that are less than 100 acres of
area Read more
2015
To achieve higher, sustainable and inclusive economic growth by attracting investments in a focussed and
structured manner in potential areas.
Industrial and Investment
Policy 2011 Encourage private sector investment and promote the manufacturing sector
as a key economic driver Read more
Rehabilitation and
To smoothen out the land acquisition process under the Land Pooling Scheme.
Resettlement Policy,
2010 To make fair payment of market value as compensation for land to land owners.
Read more
To increase the earnings from tourism inflow at the rate of 10.0% annually.
Haryana Tourism Policy
2008 To promote sustainable tourism by encouraging a constructive and mutually beneficial partnership between the
public and private sectors for economic development and employment generation. Read more
44 HARYANA For updated information, please visit www.ibef.orgSTATE ACTS AND POLICIES …(3/3)
Objectives
To implement labour laws for ensuring proper working conditions and labour standards.
To improve working conditions for women and eliminate all forms of child labour.
Labour Policy To train and retain employees and officers.
Read more
To acquire land for development of industrial infrastructure in a planned manner by the HSIIDC.
Land Pooling Scheme
To provide land owners with an option to become partners in the development process.
Read more
Public Private To facilitate private sector participation in upgrading, developing and expanding the state’s physical and social
Partnership Policy infrastructure.
Read more
45 HARYANA For updated information, please visit www.ibef.orgSTARTUP POLICY 2017
The policy visualises Haryana as a resourceful and innovative startup hub by supporting & assisting the new-age innovators and entrepreneurial
talents across the state.
Objectives:
• Attract investments into the incubation and startup ecosystem in Haryana during policy period
• Establish at least 10 technology /business incubators / accelerators in each of the different sectors in the state in different regions of the state
• Develop 1 million sq. ft. of incubation space
• Encourage/facilitate/incubate at least 500 startups
Haryana State Electronic Development Corporation Limited (HARTRON) introduced a start-up warehouse on 10,000 sq. ft. of land in Gurugram
under the policy.
The policy also proposed building of sector specific incubation centers which would provide facilities such as common working space, test and
demonstration facilities, mediation and network, training and coaching and business support.
Various incentives are offered to startups/entrepreneurs under the policy. Few of these are interest subsidy, lease rental subsidy and innovation
promotion subsidy.
The government also decided to create a fund of funds to support startups at the stages of seed funding and venture capital.
• Seed capital of upto US$ 4,656 shall be provided for validation of idea, prototype development and initial activities to setup the startup. A total
of 500 ideas would be supported with seed capital.
• The government would also create a fund of US$ 1.5 million dedicated to meet the funding requirement for scalability.
46 HARYANA For updated information, please visit www.ibef.orgHARYANA ANNEXURE
ANNEXURE…(1/2)- SOURCES

                          Data                                                            Sources

     GSDP (state)                                                                Economic Survey 2018-19

     Per capita GSDP figures                                                      Central Statistics Office

     GSDP (India)                                                                 Central Statistics Office

     Installed power capacity (MW)                                               Central Electricity Authority

     Wireless subscribers (No)                                             Telecom Regulatory Authority of India

     Internet subscribers (Mn)                                             Telecom Regulatory Authority of India

     National highway length (km)                                NHAI, Roads and Building Department-Government of India

     Airports (No)                                                                Airports Authority of India

     Literacy rate (%)                                                                  Census 2011

     Birth rate (per 1,000 population)                                         SRS Bulletin September 2017

     Cumulative FDI equity inflows (US$ billion)                         Department of Industrial Policy & Promotion

     Operational PPP projects (No)                                     DEA , Ministry of Finance, Government of India

     Operational SEZs (No)                         Notified as of December 2017, Ministry of Commerce & Industry, Department of Commerce

48      HARYANA                                                                             For updated information, please visit www.ibef.org
ANNEXURE…(2/2) - EXCHANGE RATES
Exchange Rates (Fiscal Year) Exchange Rates (Calendar Year)
Year INR INR Equivalent of one US$ Year INR Equivalent of one US$
2004–05 44.95 2005 44.11
2005–06 44.28 2006 45.33
2006–07 45.29 2007 41.29
2007–08 40.24 2008 43.42
2008–09 45.91
2009 48.35
2009–10 47.42
2010 45.74
2010–11 45.58
2011 46.67
2011–12 47.95
2012 53.49
2012–13 54.45
2013 58.63
2013–14 60.50
2014 61.03
2014-15 61.15
2015 64.15
2015-16 65.46
2016-17 67.09 2016 67.21
2017-18 64.45 2017 65.12
2018-19 69.89 2018 68.36
2019-20 70.49 2019 69.89
Source: Reserve Bank of India, Average for the year
49 PUNJAB For updated information, please visit www.ibef.orgDISCLAIMER
India Brand Equity Foundation (IBEF) engaged TechSci Research to prepare this presentation and the same has been prepared by TechSci
Research in consultation with IBEF.
All rights reserved. All copyright in this presentation and related works is solely and exclusively owned by IBEF. The same may not be reproduced,
wholly or in part in any material form (including photocopying or storing it in any medium by electronic means and whether or not transiently or
incidentally to some other use of this presentation), modified or in any manner communicated to any third party except with the written approval of
IBEF.
This presentation is for information purposes only. While due care has been taken during the compilation of this presentation to ensure that the
information is accurate to the best of TechSci Research and IBEF’s knowledge and belief, the content is not to be construed in any manner
whatsoever as a substitute for professional advice.
TechSci Research and IBEF neither recommend nor endorse any specific products or services that may have been mentioned in this presentation
and nor do they assume any liability or responsibility for the outcome of decisions taken as a result of any reliance placed on this presentation.
Neither TechSci Research nor IBEF shall be liable for any direct or indirect damages that may arise due to any act or omission on the part of the user
due to any reliance placed or guidance taken from any portion of this presentation.
50 HARYANA For updated information, please visit www.ibef.orgYou can also read