Hastings Park / PNE Master Plan - Phase I Inventory and Analysis: Market Review and Opportunities - City of Vancouver
←
→
Page content transcription
If your browser does not render page correctly, please read the page content below
Page 1

                                              k / PNE Master Plan
                                  Hastings Park
April 6th 2009

Phase I

                                  H
Inventory and Analysis:
Market Review and Opportunities

Hastings Park / PNE Master Plan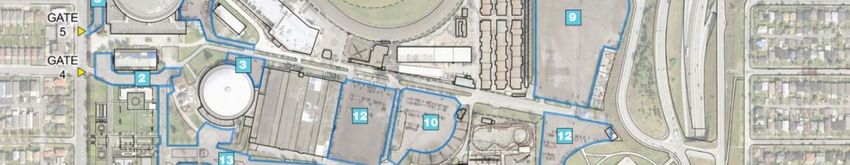
Page 2
PNE Inventory & Analysis

                                                                                                     k / PNE Master Plan
                                                                    Preliminary
                             Review
      Review local and                         Emerging
                                                    g g                    g &
                                                                     findings
                             current

                                                                                         Hastings Park
      regional market                           activity         recommendations
                           facility and
       characteristics                        opportunities          on market
                          usage trends
                                                                   opportunities

                                                                                         H
  ¾Analyze the current user group types and space requirements for non-fair users at
   PNE
  ¾R i
  ¾Review  llocall growth
                       th ffactors
                              t
  ¾Provide an overview of competitive facilities in the local and regional marketplace
  ¾Analyze emerging activity opportunities
  ¾Address preliminary recommendations and outstanding issues
  ¾Coordinate with physical planning process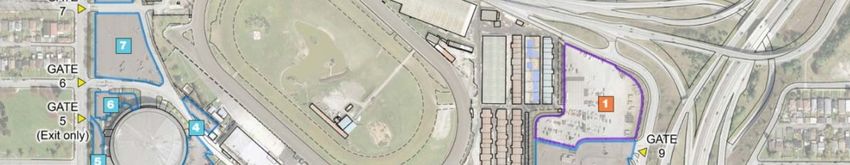
Page 3

                                                        k / PNE Master Plan
                                            Hastings Park
Hastings Park / PNE

Local and Regional Market Characteristics

                                            H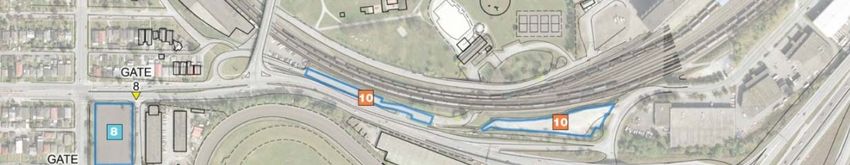
Page 4

                                               k / PNE Master Plan
Proximity Map

                                   Hastings Park
                Pacific National
                  Exhibition

                                   H
Page 5
Local Market Factors

                                                                                                                                                                   k / PNE Master Plan
Population Growth

  Population                                      2008            2011             2016        2021             2026            2031           2036
  Greater Vancouver                        2,271,224        2,414,800       2,613,500      2,808,200       2,988,800        3,151,300    3,292,100
  British Columbia                         4,381,603        4,569,500       4,890,600      5,221,500       5,533,400        5,817,200    6,070,300

                                                                                                                                                       Hastings Park
   Vancouver as a % of BC                           52%             53%            53%             54%           54%             54%            54%
                                                      Greater Vancouver                      British Columbia

                         7,000

                         6 000
                         6,000

                                                                                                                                                       H
                         5,000
          ation (000s)

                         4,000
     Popula

                         3 000
                         3,000

                         2,000

                         1,000

                           -
                                 2004   2005       2006      2007         2008      2011     2016        2021       2026      2031      2036

                                                Estimated                                                       Projected

Avg. Annual
G
Growth
     th Rates
        R t                         2008-2011      2011-2016        2016-2021        2021-2026       2026-2031         2031-2036        2008-2036
Greater Vancouver                       2.06%             1.59%            1.45%           1.25%            1.06%             0.88%            1.33%
British Columbia                        1.41%             1.37%            1.32%           1.17%            1.01%             0.86%            1.17%
Page 6
Local Market Factors

                                                                                                      k / PNE Master Plan
Population Growth

 ¾ Greater Vancouver is the most densely populated region in the province.

 ¾ The Liveable Region Strategic Plan attempts to slow the current trend of growth

                                                                                          Hastings Park
 outward toward the Valley and shift growth back into the urban core. As a result, this
 region is forecast to continue to experience strong growth.

 ¾ Net

                                                                                          H
   N t migration
        i ti has h been
                   b    highly
                        hi hl positive
                                 iti over th
                                          the llastt 20 years, and
                                                                 d it is
                                                                      i projected
                                                                           j t d that
                                                                                  th t
 this will continue to be the case over the next three decades as well.

 ¾ Average annual growth rate for the Greater Vancouver area for the forecasted years
 from 2008 to 2036 indicates positive growth of 1.33%.

 ¾ The region can expect the addition of almost 1,000,000 people in the next 30 years.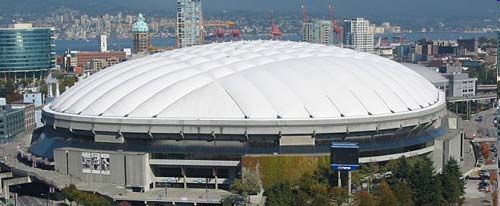
Page 7
Local Market Factors

                                                                                                                                                                                               k / PNE Master Plan
Age
                            Age Distribution
                                                                                                                            Male                     Female
               65 + years                      0 - 14 years
                  13%                              16%                                          350

                                                                                                                                                                                   Hastings Park
                                                                                                300

                                                                                                250

                                                                            Population (000s)
                                                              15-24 years                       200
                                                                 13%
 45-64 years
    27%                                                                                         150

                                                                                                                                                                                   H
                                                                                                100

                                                                                                50

                                                                                                 0
                                          25-44 years
                                             31%                                                      0 - 14 years   15 - 24 years   25 - 44 years    45 - 64 years   65 + years

  Source: BC Stats and ERA                                                                                                               Age

  ¾ The population has aged over the last twenty years, but at a slower rate than the province
  as a whole

  ¾ Between 1986 and 2007, Greater Vancouver added 5.3 years to its median age,
  compared with a provincial gain of 7.2 years

  ¾ In 2006, the largest distribution of residents within the Greater Vancouver area fell within
  the 25 to 44 year old range
Page 8
Local Market Factors
k / PNE Master Plan
Ethnicity
450
400
350
Hastings Park
ulation (000s)
300
250
200
Popu
H
150
100
50
0
2
.1
n
an
o
e
an
n
se
ab
an
k
ity
sia
in
ia
i.e
es
ac
ic
si
ne
Ar
or
re
lip
As
n.
n
Bl
tA
er
tA
Ko
in
pa
hi
Fi
Am
,
h
m
as
ity
C
es
Ja
ut
or
le
he
W
So
tin
sib
in
ut
La
m
So
vi
e
le
bl
ti p
si
Vi
ul
M
Source: Statistics Canada
1'n
n.i.e.
ie'- not included elsewhere
elsewhere. Includes respondents who reported a write
write-in
in response such as 'Guyanese
Guyanese,' 'West
West Indian
Indian,' 'Kurd
Kurd,' 'Tibetan
Tibetan,'
'Polynesian,' 'Pacific Islander,' etc.
2Includes respondents who reported more than one visible minority group by checking two or more mark-in circles, e.g., 'Black' and 'South Asian.'% of Emplloyees
C
Firms
0%
20%
40%
60%
80%
100%
on
st
ru
ct
io
n
M
an
Source: Statistics Canada
uf
ac
tu
r in
W g
ho
le
s al
e
Tr
ad
e
R
et
Tr ai
an l Tr
sp a de
.&
Local Market Factors
W
ar
e ho
Fi us
n in
R an g
ea ce
l Es &
ta In
te su
& ra
nc
Re e
n
50 to 199 Employess
Pr ta
of
es l &
Less than 20 Employees
'n Le
l, as
S ci in
en g
M tif
gm . &
t. Te
of ch
C
Firms with Employees
om .S
pa rv
Ad ni
m e s
in &
. & En
Su te
H p' r .
ea rt,
l th W
C as
ar te
e M
&
20 to 49 Employees
200 Plus Employees
So gm
ci t.
al
As
Ac s is
co ta
m nc
O .& e
th Fo
er od
Se Se
rv
's rv
ic
(e es
x.
Pu
bl
ic
Ad
m
in
.)
Hastings Park
H k / PNE Master Plan
Page 9Page 10
k / PNE Master Plan
Climate Characteristics, Vancouver, B.C.
Average Temperature Precipitation
18 18
Hastings Park
16 16
14 14
H
Precipitation (cm)
12 12
Degrees Celsius
10 10
8 8
6 6
4 4
2 2
0 0
Jan Feb Mar Apr May Jun Jul Aug Sep Oct Nov DecPage 11
Local Market Factors
k / PNE Master Plan
Origin of Overnight Visitors to Vancouver
2007 2008 % Change
¾ The largest volume of overnight
Canada 5,373,504 5,310,197 -1.2%
Western U.S.* 1,582,475 1,435,215 -9.3% visitors come primarily from Canada
Other U.S. 572,398 517,277 -9.6%
with about 61 percent visitors.
visitors
Hastings Park
Asia/Pacific 768,913 764,061 -0.6%
Europe 454,439 448,208 -1.4%
South America 87,559 92,937 6.1%
¾ Overall visitation to Vancouver has
Other Int'l 63,237 60,208 -4.8% declined somewhat by just over 3
Total 8 902 525
8,902,525 8 629 103
8,629,103 -3.1%
3 1%
H
percentt from
f 2007 tto 2008
2008.
Origin of Overnight Visitors 2008
¾ Largest decreases in volume in terms
South America
Europe
5%
1% Other Int'l of visitor origin are in the Western U.S.
1%
Asia/Pacific
9%
and Other U.S. categories.
Other U.S. ¾ Vancouver has seen an increase in
6%
visitor volume from South America by
over 6 percent.
Western U.S.* Canada
17% 61%
* Includes Washington, Oregon, California and "Other West U.S."Page 12
Local Market Factors
k / PNE Master Plan
Vancouver Visitor Volumes 2008
1,400
1,200
¾ In 2008 Vancouver had a total of
1,000
over 8.6 million visitors.
Visitor Volume (000's)
Hastings Park
800 ¾ Vancouver experiences the largest
600 influx of visitors during the months of
400 July and August with over 1 million
H
200 people in each month.
0
Jan Feb Mar Apr May Jun Jul Aug Sep Oct Nov Dec ¾ Vancouver experienced the fewest
4th Quarter 1st Quarter amount of visitors during the 1st
20% 19%
quarter.
¾ In 2008,, November had the least
amount of people visiting within this
time.
2nd Quarter
25%
3rd Quarter
36%Page 13
Local Market Factors
k / PNE Master Plan
Festivals
¾ In 2008, 46 percent of festivals within
the Greater Vancouver area took p
place in
Hastings Park
4th Q
Quarter
t
1st Quarter
11%
17% the 3rd quarter.
¾ Events taking place in the 3rd quarter
H
th t h
that have a hi
high
h volume
l off eventt d
days
include: Pacific National Exhibition Fair,
2nd
Vancouver Folk Festival, Vancouver
Quarter I t
International
ti l Jazz
J Festival,
F ti l andd
3rd 26%
Quarter Celebration of Light.
46%
¾The 4th quarter experienced the least
amount of festivals during 2008.Page 14
k / PNE Master Plan
Comparative Fairgrounds
Spaces per
2007 Parking
P ki 1 000
1,000
Hastings Park
Fair City, State Attendance Spaces Attendees Acreage Transportation and Parking
Arizona State Fair Phoenix, Arizona 1,214,442 4,000 3.3 96 Free shuttle service from the Capitol
Minnesota State Fair St. Paul, Minnesota 1,681,658 9,000 5.4 320 Local scheduled bus service at 12 locations ($5 per rider) and free shuttle service
at 34 lots
L.A. County Fair Pomona, California 1,356,026 30,000 22.1 543 Preferred and valet parking for $10 and $15, respectively
California State Fair Sacramento, California 739,380 14,357 19.4 350 Free regional
g transit buses are available everyy 15 minutes
H
Orange County Fair Costa Mesa, California 1,090,653 10,313 9.5 150 Free shuttle is available off-site
San Diego County Fair Del Mar, California 1,265,997 15,000 11.8 360 Free off-site parking at 3 lots with shuttle service every 15 minutes
Bus service during the fair that connects with the Amtrak station
Express bus service from Escondido
Calgary Stampede Calgary, Canada 1,251,105 3,403 2.7 182 Two express routes running every 10-15 minutes
Extended regular bus service to the Stampede
24-hour subway (Ctrain) service during the Stampede
Canadian National Exhibition Toronto,, Canada 1,200,000
, , 3,650
, 3.0 260 Go Train has stop p at CNE
Two off-site lots and a number of on-site lots - rates vary between $10 and $25
Pacific National Exhibition Vancouver, Canada 906,808 2,269 2.5 162 Additional bus service during exhibition Aug. 20th to Sept. 5
Parking costs are $15
Average 1,189,563 10,221 8.9 269Page 15
k / PNE Master Plan
Comparative Venues
Name Facilities Exhibit Area(s) Meeting Rooms Banquet Capacity
Arenas
Arena - 60,000 seats,
BC Place 75,000 - 247,000 SF 14 5,000
Stadium
St di - 56
56,380
380 seats
t
Hastings Park
General Motors Place Arena - 20,004 seats N/A 8 500
Kerrisdale Cyclone Taylor Arena 2,990 seats N/A 1 50
Convention Centers
Exhibit Hall 314,000 SF
Vancouver Convention & Exhibition Centre 72 6 000
6,000
H
Ballroom 72,000 SF
Performing Arts Theaters
Queen Elizabeth Theater 2,929 seats N/A N/A N/A
Orpheum Theater 2,780 seats N/A N/A N/A
Non-Profits
Stanley Theater 630 seats N/A N/A N/A
Outdoor Venues
Annual children's festival held in April/May. Large saddle tents are used to create
Vanier Park Park encosed spaces.
On the same site, the "Bard on the Beach" then continues as a Shakespeare Festival
900 seats through September.
Jericho Park Park Annual folk festival which draws some 40,000 patrons over three days.
Gastown Downtown Annual Jass Festival at a simple covered stage in a public environment.
David Lamb Park ("the Roundhouse") Park Can facilitate up to 12,000 patrons.
Houses the annual Taiwanese Cultural Festival which attracts some 15,000 over
"Plaza of Nations" venue 750 seats three days.
Vancouver Art Gallery Public Plaza Small public plaza that is not highly functional.
functional
This is a very popular location within Vancouver for a variety of activities and boasts
Granville Island 200 - 400 seats stages for theater. Access and circulation in this small space is difficult.Page 16
Comparative Facilities
k / PNE Master Plan
BC Place
• BC Place is Canada's first domed stadium and is the largest air-supported
stadium in the world.
• Completed in 1983 and can seat 60 60,000
000 in its mixture of permanent and
Hastings Park
portable seats.
• Owned by the province (PavCo), BC Place is currently undergoing pre-
and ppost-Olympics
y p upgrades,
pg , including
g a retractable roof after 2010. Pre-
H
Olympics renovations include suites, seating, washrooms, and concession
stands.
• The main floor contains approximately 154,000 square feet, which can
h t 800 10’
host 10’x10’
10’ b
booths.
th IIn th
the entire
ti flfloor, seatt annex, and
d second
d flfloor
concourse levels are combined, a total of up to 247,000 square feet can
be made available.
• The venue hosts the province’s
province s largest trade shows such as the
Vancouver International Boat Show, the BC Home and Garden Show, and
the Pacific International Auto Show. BC Place also hosts Rogers Play
Dome, an indoor carnival with 45 rides, over an 8-day period in March.
• The stadium is served by the Skytrain's Stadium-Chinatown Station. The
False Creek Ferries and Aquabus dock at the Edgewater Casino also
serves the stadium.Page 17
Comparative Facilities
k / PNE Master Plan
General Motors Place
• Generall M
G Motors
t Place
Pl i V
is Vancouver’s’ primary
i entertainment
t t i t venue ffor
concerts and will serve as the primary venue for ice hockey in the upcoming
2010 Winter Olympic Games
• The facility opened in 1995 at a cost of CD $160 million in private financing
financing.
Hastings Park
• The arena is home to the Vancouver Canucks of the NHL, and was formerly
home to the Vancouver Grizzlies of the NBA and the Vancouver Ravens of
the NLL.
H
• General Motors Place seats 18,630 for ice hockey and 19,193 for basketball
with 88 luxury suites, 12 hospitality suites, and 2,195 club seats. The arena
replaced the Pacific Coliseum as the main venue for events in Vancouver.
• The building is easily accessible by public transit and the Stadium/Chinatown
Skytrain station. Parking is also within a 15 minute walk of more than 5,000
parking spots which includes an underground parking lot.Page 18
Comparative Facilities
k / PNE Master Plan
Vancouver Convention & Exhibition Center
• Located on the waterfront, the existing VCEC currently contains approximately
150,000 square feet of flexible function space, including 91,200 square feet of flexible
exhibit space, a ballroom and 20 breakout rooms. In conjunction with BC Place, it is
operated by PavCo.
Hastings Park
• The facility opened in 1987 and first served as the Canada Pavilion for the World’s
Fair Expo in 1986.
• An expansion was recently completed immediately west of existing facility to triple the
size
s eoof tthe
e co
convention
e to a and
deexhibition
b t o ce
center
te to app
approximately
o ate y 500,000 squa
square e feet
eet
H
(approximately 46,000 square meters) of meeting space, exhibition space, ballroom,
and plenary theatre space.
• 223,000 square feet (20,700 square meters) is available for flexible exhibition space.
• Both the East and West Buildings are designed as a
series of modules allowing for simultaneous events,
each with their own separate access and function
space.
• The budget for the expansion project is $800 million
and is being funded by the Provincial and Federal
governments and Tourism Vancouver.
• j
A new adjacent 400+ room Fairmont Pacific Rim hotel
is being built that will be connected to the facility.Page 19
Vancouver Convention & Exhibition Center
k / PNE Master Plan
Event Volume by Month and Event Type
Other
3%
Consumer
Tradeshow 28%
26%
Hastings Park
H
Convention
43%
Jan Feb Mar Apr May Jun Jul Aug Sep Oct Nov Dec Total
Consumer 1 4 3 2 0 0 0 0 4 2 6 0 22
Convention 2 5 3 5 3 3 1 3 2 3 2 2 34
Tradeshow 4 6 1 3 1 1 0 1 1 1 1 0 20
Other 0 1 0 0 0 1 0 0 0 0 0 0 2
Total 7 16 7 10 4 5 1 4 7 6 9 2 78
M th Share
Monthy Sh off Annual
A l Events
E t 8 97% 20.51%
8.97% 20 51% 8 97% 12.82%
8.97% 12 82% 5 13%
5.13% 6 41%
6.41% 1 28%
1.28% 5 13%
5.13% 8 97%
8.97% 7 69% 11.54%
7.69% 11 54% 2 56%
2.56%
Source: PNE and Economics Research AssociatePage 20
Vancouver Convention & Exhibition Center
k / PNE Master Plan
Summary of Event Volume
• Conventions composed the greatest type of event, at about 44
percent of the total events, followed by consumer type events
comprising 28 percent of total events
Hastings Park
• Trade shows follow closely behind consumer shows with about 26
percent (20 events)
• Th highest
The hi h t volume
l off events
t were held
h ld in
i February,
F b with
ith about
b t
H
21 percent of the total annual events (about 16 events)
• The lowest volume of events were held in July, with 1 event
( b t1
(about 1.3
3 percentt off the
th ttotal
t l held
h ld th
thatt year))Page 21
k / PNE Master Plan
Hastings Park
Hastings Park / PNE
Current Facility Usage and Trends
HPage 22
Pacific National Exhibit (PNE) Overview
k / PNE Master Plan
¾ Only 340
340,000
000 is flat floor area and only 220
220,000
000 square feet are
usable. None of this space offers flexibility.
¾ In the recent past, approximately 200,000 square feet of building
area was removed from the site site.
Hastings Park
¾ There are 3,240 parking spaces available.
¾ The largest annual event, the PNE Fair, averages nearly 900,000
people
H
¾ With all events included, PNE has been averaging approximately
2.0 million persons annually
¾ All buildings
b ildi aside
id from
f the
th CColiseum
li are severely
l lilimited
it d iin guestt
and operational services
¾ Based on income statements, annual net income the past couple of
years has
h b been approximately
i t l b break-even
k per year (“EBITDA”)
(before depreciation)Page 23
Existing PNE Building Characteristics
k / PNE Master Plan
Venue/Name Description Square Footage Seating
15,713 in permanent seating, with provision for
Pacific Coliseum Exhibition building and sports facility 136,110
2,000 temporary seats
3,260 permanent seats and additional floor seating
Agrodome An oval floor with a polished concrete surface, sports facility 65,660
for 2,505 is available for concerts and other events
Rollerland Exhibit building or concert hall 21,250 850 banquet seating
Hastings Park
Forum Flexible exhibition building; 2 locker rooms-storage 64,900 1,250 permanent seats
Garden Auditorium Auditorium with built-in stage 20,990 1,461 permanent seats
Admin. Building Administration Building 14,390 NA
Livestock Fairtime 4H & Agriculture Programming 132,600 NA
H
455,900
Source: PNE and Economics Research Associates
¾ Pacific National Exhibition currently has 4 primary building used for exhibition space:
Pacific Coliseum
Coliseum, Agrodome
Agrodome, Rollerland and the Forum
Forum.
¾ The Agrodome and Rollerland is not as highly utilized for exhibition space as the Pacific
Coliseum and the Forum is primarily used for filming purposes.
¾ Exhibition
E hibiti space ttotals
t l tto over 266
266,000
000 square feet
f t att PNE.
PNE
¾ The Agrodome and the Pacific Coliseum are both used for sporting events. The Pacific
Coliseum is also capable of holding concerts.
¾ Overall, there is nearly 456,000 square feet of space for various types of events at the
Pacific National Exhibition.Page 24
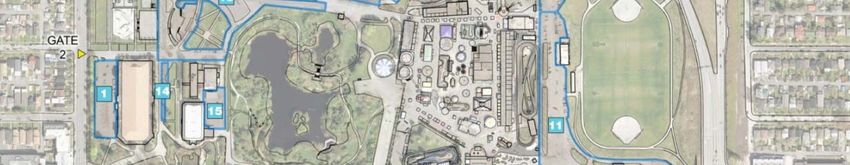
PNE Parking Inventory
k / PNE Master Plan
Lot # Parking Stalls
1 75
2 50
3 30
Hastings Park
4 60
5 40
6 48
7 310
8 250
9 660
H
10 300
11 150
12 160
12 350
13 350
14 20
15 75
16 312
Total 3,240
Source: FORRECPage 25
Fair Total Attendance
k / PNE Master Plan
1,200,000
1,100,000
1,000,000
Hastings Park
900,000
800,000
endance
700,000
600,000
Atte
H
500,000
400,000
300,000
200,000
100,000
0
1993 1994 1995 1996 1997 1998 1999 2000 2001 2002 2003 2004 2005 2006 2007 2008
Source: PNE and Economics Research Associate
¾ Annual fair attendance has averaged 956,000 persons since 1993.
¾ Overall, attendance has declined almost 2 percent from 1993 to 2008.
¾ The number of fair days has stayed at 17 the past 10 years.Page 26
k / PNE Master Plan
Playland & Fright Night Total Attendance
Playland Fright Night
450
400
Hastings Park
350
300
ance (000's)
250
H
Attenda
200
150
100
50
-
2003 2004 2005 2006 2007 2008
Source: PNE and Economics Research Associate
¾ Annual Playland attendance has averaged over 300,000 persons over the past 6 years and
almost 60,000 persons for Fright Night.
¾ Fright Night has nearly doubled in attendance from 2003 from 43,700 to 83,000 in 2008.
¾ Altogether, attendance has risen by 4.1 percent from 2003 to 2008.Page 27
k / PNE Master Plan
Fright Night Total Attendance 2007
Total Attendance Total Rides Rides per Attendee
20 000
20,000 30
Hastings Park
18,000
25
16,000
Total Attendance & Total Rides
14,000
20
H
Rides Per Attendee
e
12,000
10,000 15
8,000
10
6 000
6,000
4,000
5
2,000
- 0
1 2 3 4 5 6 7 8 9 10 11 12 13 14 15 16 17 18 19 20
Day
Source: PNE and Economics Research AssociatePage 28
Initial Findings
k / PNE Master Plan
Playland
¾ Playland is currently a successful operation during Fair and non-fair
periods.
Hastings Park
¾ Market analysis indicates potential for improved performance through a
carefully designed expansion program
¾ Byy attraction industryy standards, the market could sustain 500,000 to
H
550,000 annual attendees
¾ Obtaining this increase will require expansion, additional attraction
content and ride quality
¾ Playland improvement should consider design day needs for Fair and
non-Fair operations
¾ Initial analysis indicates roughly 20 to 25 acres under ‘green style’
concept
¾ Securityy and safety
y issues in addition to operating
p gpperformance are key
y
for enclosure / open access policyPage 29
Non-Fair Events
k / PNE Master Plan
Types of Events 2008
¾ ERA analyzed event data by type of
event and number of events and
organized it into five categories, as shown
Hastings Park
Misc.
Mi
21%
Concerts
21%
in the corresponding chart.
¾ The category with the most events at
PNE is sports with 29 percent.
H
Admissions
6% ¾ The second largest type of event that
occurs within PNE is filming, accounting
for a total of 23 percent of non-fair
Sports
events.
29%
Film
23% ¾ Concerts account for 21 percent of all
events that take place within the
exhibition.
Source: PNE and Economics Research Associates
¾ Miscellaneous events have a fairly high
amount of events but only bring in 1,280
people in attendance.Page 30
Event Utilization
k / PNE Master Plan
Year-Round Facilities 2008
¾ In terms of building utilization – the
Pacific Coliseum is most utilized with
Grounds Playland both sports uses and exhibit uses,
3% 3% accounting for 55 percent of all
Hastings Park
Lots
utilization with a total of 81 events at
21% the facility.
¾ The lots are the second most
H
Livestock
1% heavily utilized building, accounting for
Pacific 21 percent of all events
Rollerland Coliseum
3% 55%
¾ The Forum is the third most utilized
Agrodome
6%
building which accounts for 8 percent
of all events at PNE and is used for
Forum
8% exhibit space
Source: PNE and Economics Research Associates ¾ The Agrodome is the other sports
facility on the PNE grounds and holds
about 6 percent of the PNE events in
this facilityPage 31
Quarterly Event Utilization of Year-Round Facilities 2008
k / PNE Master Plan
Coliseum Forum Agrodome
Rollerland Livestock Garden Auditorium
Lots Grounds Playland
Hastings Park
35
30
H
25
20
Events
E
15
10
5
0
1st Quarter 2nd Quarter 3rd Quarter 4th Quarter
Source: PNE, FORREC & Economics Research AssociatesPage 32
Non-Fair Events
k / PNE Master Plan
Pacific Coliseum 2008
¾ The Pacific Coliseum is the largest
Year Attendance Events Event Days
building within the Hastings Park. 2004 425,428 80 124
Hastings Park
2005 507,396 81 121
¾Events such as ice shows, boxing, 2006 724,523 101 120
2007 534,434 114 97
basketball, hockey, concerts, circuses,
2008 398,543 81 89
large assemblies, and trade &
consumer shows take place in the
H
coliseum.
Attendance Event Days
¾Attendance has risen by almost
800 140
300 000 people from 2004 to 2006
300,000
700
and fell by almost the same amount 120
from 2006 to 2008. 600
100
ce (000s)
500
Eventt Days
80
¾The number of event days have
Attendanc
400
60
decreased since 2004 from 124 days 300
40
to 89 days last year. 200
100 20
¾Average attendance since 2004 is - 0
2004 2005 2006 2007 2008
just over 518,000.Page 33
Non-Fair Events
k / PNE Master Plan
Forum 2008
¾The Forum can be utilized in its
entirety or separated into two equal Year Attendence Events Event Days
2004 14,625 7 283
sections by sliding wall dividers
dividers.
Hastings Park
2005 22,738 7 92
2006 87,831 20 172
¾Large displays and trade shows 2007 22,127 15 173
as well as the demands of the 2008 17,377 11 28
film/commercial industry can be
H
accommodated in the Forum.
¾The number of event days Attendence Event Days
dramatically decreased from 283 to 100 300
28 from 2004 to 2008. 90
250
80
ce (000s)
70
¾Attendance numbers have been 200
Event Days
60
steady for the Forum over the past
Attendanc
50 150
5 years but dramatically jumped to 40
100
30
almost 88,000 attendees in 2006.
20
50
10
0 0
2004 2005 2006 2007 2008Page 34
Non-Fair Events
k / PNE Master Plan
Agrodome 2008
¾ The Agrodome features an ice
surface for minor hockey and figure Year Attendance Events Event Days
skating
g events duringg the winter 2004 12,559 697 254
Hastings Park
months. For the remainder of the 2005 31,944 700 166
2006 41,157 767 211
year, variety of events occur such 2007 36,782 588 150
as professional tennis, boxing, 2008 1,048 9 29
wrestling,
g, special
p events and flat
H
shows.
¾ Within the past five years, event Attendance Event Days
attendance reached its ppeak in 45 300
2006 and dramatically lowered last 40
250
year in 2008. 35
nce (000s)
30 200
nt Days
¾In addition,, events taking
25
g place
p 150
Attendan
Even
20
within the Agrodome significantly 15 100
decreased from 588 events in 2007 10
50
to 9 events in 2008. 5
0 0
2004 2005 2006 2007 2008Page 35
Non-Fair Events
k / PNE Master Plan
Rollerland 2008
¾ Rollerland is ideally suited for
small consumer shows and Year Attendance Events Event Days
2004 8,000 8 205
Hastings Park
b
banquets
t off up to
t 800 people.l 2005 1,350 4 127
2006 4,916 10 183
¾Rollerland has significantly 2007 250 7 81
2008 0 5 80
decreased in event attendance
H
d i th
during the pastt fifive years.
¾The number of events taken
place of the past five years have Attendance Event Days
fl t t d quite
fluctuated it a bit while
hil only
l 9,000 250
having 5 events in 2008. 8,000
7,000 200
6,000
Days
nce
150
Attendan
5 000
5,000
Event D
4,000
100
3,000
2,000 50
1,000
0 0
2004 2005 2006 2007 2008Page 36
Non-Fair Events
k / PNE Master Plan
Garden Auditorium 2008
¾Currently this building is the year-
round home to Cirkids School of Year Attendance Events Event Days
Circus Arts who have been with us 2004 2 141
2,141 4 303
Hastings Park
at the Pacific National Exhibition 2005 1,796 5 308
2006 1,679 2 212
since 2003.
2007 1,994 9 306
2008 0 0 0
¾ From
o 200400 to
o 2007,
00 , the
e Garden
Ga de
H
Auditorium has averaged just over
1,900 attendees.
Attendance Event Days
¾ The events scheduled at the 2 500
2,500 350
Garden Auditorium included high
300
volumes of event days averaging 2,000
250
around 280 event days per year
Days
ance
1,500
from 2004 to 2007. 200
Event D
Attenda
150
1,000
100
500
50
0 0
2004 2005 2006 2007 2008Page 37
Initial Findings
k / PNE Master Plan
PNE Fairgrounds
¾ Unusual variety of different non-complimentary facilities within grounds
causes lack of identity
¾ Inadequate flexible,
flexible multi
multi-purpose
purpose flat floor exhibition space to sustain
Hastings Park
year-round event activity
¾ Existing buildings and facilities are typically single use designs
H
¾ Annual PNE attendance stable at 900,000 visitors; strong performance
given site size and parking constraints
¾ Historic PNE attendance illustrates a decline in market penetration
performance reflecting physical constraints
¾ Physical constraints have inhibited fair attendance revenue performance
despite market growth
¾ For maximum growth and revenue performance, master plan options
should consider more flexible, multi-purpose building space on site to
benefit fair and year round activityPage 38
k / PNE Master Plan
Total Revenue Sources 2007
Corporate
1% ¾ Fair accounts for the largest
source of revenue ((50 percent)
p )
Hastings Park
Year Round
Y R d
25%
¾The year round events generate
approximately 25 percent of the
revenues
H
Fair
50% ¾ Playland falls closely behind the
year round events at 24 percent
with revenues of over $10.6 million
for 2007.
Playland
24%
Source: PNE and Economics Research AssociatePage 39
Annual Revenue
k / PNE Master Plan
Hastings Park
H
Source: PNE and Economics Research Associates
Notes: Conversion rates accurate as of November, 16 2009Page 40
k / PNE Master Plan
Hastings Park
Hastings Park / PNE
Emerging Activity Opportunities
HPage 41
Initial Findings
k / PNE Master Plan
Market Environment
¾ Greater Vancouver region has shown population growth and
expansion in local-source agricultural activities, creating PNE
growth opportunities.
Hastings Park
¾ Seasonal characteristics of climate call for indoor event space for
year round events and concentrated summer outdoor activity
demand.
H
¾ Hastings Park’s location is distant from the critical mass of first-tier
event activity and downtown infrastructure.
¾ Cu
Current
e t upgrade
upg ade / expansion
e pa s o of o the
t e Convention
Co e t o Ce Center
te cou
coulddo
offer
e
opportunity for second-tier consumer shows at PNE with
appropriate facilities.
¾ Current PNE facilityy limitations drive focus on local non-fair
activities but constrain access to regional market activities, both
commercial and cultural.
¾ To maximize y year-round event p performance,, the master plan
p
options need to create more flexible large indoor space for both
fairtime content and non-fair events.Page 42
Market Demand Opportunities
k / PNE Master Plan
Event Opportunities
Available event opportunities in several segments:
1. Consumer shows – dominant activity with growth potential in size
and number
Hastings Park
2. Trade shows – professional shows with flat floor exhibits –
underserved locally
- Hotel adjacency key; price flexibility need
H
3. Large equipment events – indoor/outdoor capacity requirement
4. SMERF – conference, meetings, in high quality facilities with
break o t rooms
break-out
- Will boost weekday utilization
5. Festivals & events – growth outlook strong with good
outdoor/indoor
td /i d ffacilities
iliti
6. Sports-related events – adjacency to new arena
- Liaison function
7. Entertainment Events – venue responsive
- Outdoor performances seasonallyPage 43
k / PNE Master Plan
Hastings Park
Hastings Park / PNE
Arena/Mixed Use Studies
HPage 44
Selected Regional Event Venues
k / PNE Master Plan
with Arenas
Freeman Coliseum/AT&T
Venue Kentucky Exposition Center Center Calgary Exhibition Park Reliant Park
City Louisville San Antonio Calgary Houston
State Kentucky Texas Alberta, Canada Texas
Total Population (MSA) 1,233,735 1,990,675 1,000,000 5,628,101
Hastings Park
4 Exhibit Halls (East
(East, West
West, 5 Buildings outside Coliseum
Purpose Built Exhibition Space Round-Up Centre Reliant Center
North & South Halls) ranging from 7,600-60,000 SF
Corral Arena (6,500); Royce Reliant Arena (8,000);
Cardinals Stadium (47,925);
Coliseum (12,000); AT&T Theatre (500); Grandstand Reliant Stadium (71,500);
Other Facilities (seats) Broadbent Arena (6,600);
Center (18,500) (16,000); Pengrowth Stadium Reliant Astrodome
Freedom Hall (19,169) 3
(19,989) (160,000 SF)
H
1952 (Freedom Hall & East & 1951 (arena); 1981 (center); 1962 (Astrodome); 2002
Year Built 1949/2003 (AT&T)
West Wing) 1983 stadium (Stadium & Center)
4
Facility Ownership State County Private/Non-profit County
2
Facility Management State (Fair Board) Public/Private (Joint) Private/Non-profit Private
On-site parking 19,000 10,000 3,000 26,000
College Basketball/Freedom AT& T Pengrowth
Sports Use 1 Reliant Stadium (NFL)
Hall Center/NBA/AHL/WNBA Saddledome/NHL/WHL/NLL
Sports Use Event Days 10 117 44 (NHL) 10
Seating for Primary Sports Use 19,169 18,500 19,989 71,500
Event Venue Overview
Stadium/Arena(s) Only
NSF Exhibit Space 78,000 90,000 40,000 97,000
Meeting Rooms 0 3 N/A
Facility-Wide
NSF Exhibit Space 956,500 258,700 381,000 987,213
Size of Largest 425,700 90,000 200,000 706,213
Meeting Rooms 54 3 15 72
1
The University of Louisville basketball team is relocating to a new downtown arena.
2
Freeman Coliseum is managed by the Coliseum Advisory Board
Board, a division of Bexar County; and the AT & T Center is managed by a division of the Spurs
Spurs, Community Arena Mgmt
Mgmt.
3
Adjacent Pengrowth Stadium is not technically part of Calgary Exhibition Park. It was built in 1983 for the NHL Flames who previously played in the Corral.
4
City-owned land under a long-term lease agreement; city owns the adjacent Saddledome and the Calgary Flames manage the facility.
Source: Individual facilities and Economics Research AssociatesPage 45
Kentucky Exposition Center
k / PNE Master Plan
Louisville, Kentucky
Physical and Event Characteristics
• The 400-acre facility contains approximately 885,000 SF of
Class A space, in addition to space in its two arenas. The North
Hastings Park
Wing reopened last year.
•Freedom Hall and the East and West wings were the first
facilities to be built in the 1950s. At this time, a proposal exists to
tear down Cardinals Stadium (where the university football team
played until relocating five years ago) and build an amphitheatre
in its place.
place Smaller concerts are currently being held in
H
Broadbent Arena.
•The facility is managed by the Kentucky Fair Board, which also
manages the Kentucky Convention Center (300,000 SF)
downtown, and produces three shows annually – the Kentucky
State Fair ((589,400 visitors),
) the National Farm Machineryy Show
(300,000+), and the North American International Livestock
Exhibition (210,000).
•The venue hosts over total 400 total events annually. While the
number of events each year seems to have gradually increased,
the number of attendees shows a gradual decrease for the past
few years.
years In 2006 there were 2 2.8
8 million visitors
visitors, decreasing to
2.5 million last year. This implies that each year as the number of
events increased, not only were fewer people attending each
event, but it is likely that there are a greater number of small scale
events being held at the Center’s facilities.
•There
e eaare
e nearly
ea y 13,000
3,000 hotels
ote s in cclose
ose p
proximity,
o ty, with
t se
several
ea
across the street.Page 46
Freeman Coliseum/AT&T Center
k / PNE Master Plan
San Antonio, Texas
Physical and Event Characteristics
Freeman Coliseum was built in 1949 as a regional arena with 12,000 seats (10,000 permanent) to host the
annual San Antonio Livestock Show, concerts and other events. Similar to Cal Expo, it is approximately 2.5
Hastings Park
miles from the downtown core. The facility cost an estimated $1.75 million and was paid for with revenue
bonds. There is no existing debt service on the building. The land was privately donated, and the County
owns and manages the facility.
The Coliseum generates approximately 85 events, the majority of which are flat floor consumer shows. There
are five exhibit buildings behind the venue which are seldom used outside of the Livestock Show. Most shows
H
are held
The NBA San Antonio Spurs built an 18,500-seat facility (formerly the SBC Center) on-site in 2003. At present,
an ANL and WBNA team also play at the facility. The Spurs manage the county-owned facility under a capital
lease agreement.
Under their agreement with the Spurs:
– A no-compete clause exists for ticketed events at the Coliseum (i.e. concerts) and reserve first right of
refusal. The Coliseum, however, can book flat floor shows without pre-approval.
– The Spurs have pre-committed to book a certain number of events in the Coliseum. In the event that they
are unable to do so (which varies annually since the facility opened), the Spurs pay the County a certain
pre-agreed sum.
– The Spurs vacate the AT&T Center for two weeks during the annual San Antonio Livestock Show which
uses the entire facility and hosts approximately 1.2 million persons annually.
Per management, the arrangement has worked well since most of the Coliseum events occur during the
daytime. However, parking can be problematic when two events are held in both facilities at night. This
creates ingress/egress issues in the surrounding community as well. The Spurs have full rights to all but one
of the 9 lots.Page 47
Calgary Exhibition & Stampede
k / PNE Master Plan
Calgary, Canada
The Calgary Exhibition and Stampede is a multi-purpose meetings and exhibition facility in
downtown Calgary that has an indoor arena on its east end. The Calgary Exhibition and
Stampede is a non-profit organization, and all buildings and land are leased from the City of
Hastings Park
C l
Calgary and
d manageddbby th
the C
Calgary
l St
Stampede.
d
The Calgary Stampede is a large festival, exhibition, and rodeo held in Calgary, Alberta for 10
days every summer from early to mid-July. It is one of Canada's largest annual events, and the
world's largest outdoor rodeo. Dating back to 1886, the event currently attracts approximately
1 2 million persons annually.
1.2 annually
H
The Pengrowth Saddledome was built in 1983 and was used for figure skating and hockey in the
1988 Winter Olympics. Today it is the home to the National Hockey League (NHL) Calgary
Flames, the Western Hockey League (WHL) Hitmen and the National Lacrosse League (NLL)
Calgary Roughnecks. The Flames manage the venue.
The Saddledome has approximately 20,000 seats, 74 luxury suites and 1,600 club seats.
Exhibition and conference facilities are available at the Roundup Center, which is composed of
200,000 square feet of contiguous space that is divisible into four 50,000 square foot halls and
15 meeting rooms. In 1999, the site underwent a CD$31 million expansion program that added
roughly
hl 114,000
114 000 square feet
f t off space to
t the
th existing
i ti 275,000.
275 000 P Partt off th
the renovation
ti was
designed to meet the needs of trade and consumer shows requiring additional breakout rooms
and square footage.Page 48
Reliant Park
k / PNE Master Plan
Houston, Texas
Physical
Physical and
and Event
Event Characteristics
Characteristics
This complex of buildings encompasses 350 acres (1.4 km2) of land and consists of five venues:
Hastings Park
Carruth Plaza (sculpture garden), Reliant Stadium, Reliant Center (convention center), Reliant
Arena and Reliant Astrodome. The venues are owned by Harris County and managed by SMG.
The largest annual event is the Houston Livestock Show and Rodeo, the world's largest livestock
exhibition and rodeo event. In 2007 and 2008, attendance reached more than 1.8 million.
H
R li t C
Reliant Center
t contains
t i 706
706,000
000 square ffeett off contiguous
ti exhibit
hibit space, which
hi h iis di
divisible
i ibl iinto
t 11
halls.
Reliant Stadium is a 69,500-seat retractable stadium that can be configured to utilize a 125,000
square foot space for general session, catered functions, exhibits, and concerts. It is home to the
NFL Houston Texans and was built in 20022002.
Reliant Arena contains 5,800 seats and a floor space encompassing 25,000 square feet.
The Astrodome was the first facility to be built on the complex (1965). It was the previous home to
the Houston Astros and the Houston Oilers. It has contiguous flat floor space of approximately
,
140,000 square
q feet.
The complex is served by the Reliant Park Station, a light rail station on the Red Line of the
METRORail light rail system. It also includes one of the world's largest parking lots (holding 26,000
total) and sees nearly 750 events yearly. Up until 2005, the lot also served as a parking lot for Six
Flags Astroworld, which has since closed.Page 49
New Multi-purpose Fairgrounds Facility Example
k / PNE Master Plan
Showplex @ Western Washington Fairgrounds, Puyallup
Physical and Event Characteristics
Showplex
p is an example
p of a new,, modern multi-purpose
p p event center that can be used for both
Hastings Park
concerts, consumer and trade shows. It is frequently cited by promoters as being one of the
nicer buildings on a fairgrounds in the U.S.
Showplex is a new, state-of-the-art, 122,000 SF multi-purpose event center with an exhibition
center @ 92,000 SF and an attached conference center with 3 meeting rooms and 2 foyers at
H
12 800 SF.
12,800 SF
The facility was completed in 2003 with private funding at an estimated cost of $8 million.
The Exhibition Center is multi-purpose in nature and contains three areas and a food court. The
West Bay is 23,400 SF, the East Bay is another 23,000+, and the Center Nay contains 38,300
SF.
SF
The Exhibition Center contains seating for 3,400, a wireless PA system, and exhibit areas cut in
10’ x 10’ grids.
According to management, between 40 to 45 events are held annually in the building. An
estimated 80 percent of events are consumer and/or trade shows,
shows and the remaining 20 percent
are concerts or special events.
Management estimates that 80 percent of trade shows are local (i.e. King and Pierce Counties)
and 20 percent are regional, but primarily Northwest-based.You can also read