Hawaii Energy Facts & Figures - Hawaii State Energy Office
←
→
Page content transcription
If your browser does not render page correctly, please read the page content below

JUNE   2018

     ENERGY.HAWAII.GOV

Hawaii Energy Facts & Figures

                                 HAWAII'S CLEAN ENERGY GOALS

                                   HAWAII ENERGY OVERVIEW

                                       ENERGY EFFICIENCY

                                       RENEWABLE ENERGY

                              ENERGY SYSTEMS AND PLANNING

                                    CLEAN TRANSPORTATION

        PREPARED      BY   THE

   HAWAII   STATE   ENERGY    OFFICE

DEPARTMENT   OF   BUSINESS,   ECONOMIC

   DEVELOPMENT,      AND   TOURISM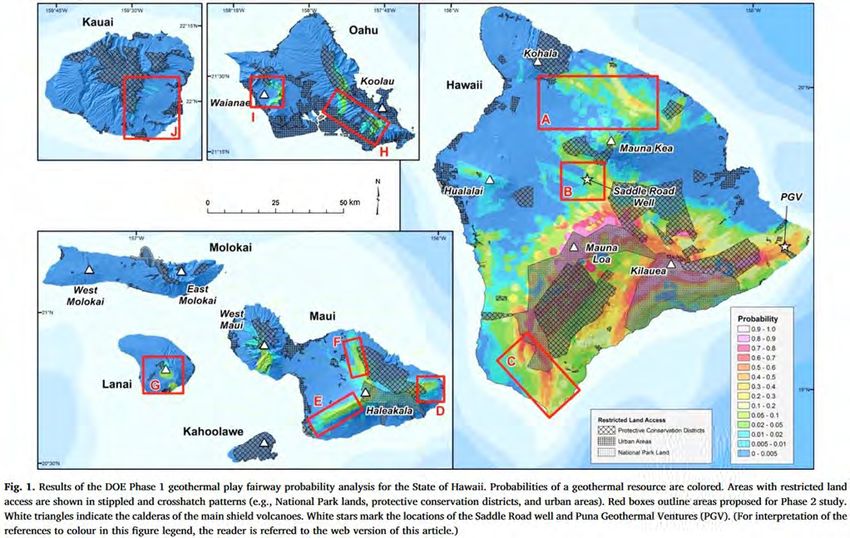
Hawaii’s Clean Energy Goals
Aiming for 100 percent renewable energy in Hawaii’s electricity sector by 2045 was big news in 2014 and Hawaii has
been putting those words into action. Achieving the state’s bold commitments will require perseverance and action –
a combination of hard work, innovative thinking, and continued collaboration that distinguishes Hawaii’s clean
energy transformation to date.
As a community of isolated islands, we drain our
economy with costly payments of billions of
dollars annually for imported fuel - dollars which
should remain in our economy to grow our
economy. We pay, yet we are richly endowed with
a wealth of natural resources. Our challenge is to
work together to accept these blessings while
balancing environmental, cultural, and economic
considerations.
At the same time, technology and innovation are
advancing at such a rapid pace that we share
another challenge: to foresee the advancements,
even on a five-year horizon. Yet, we must choose
and act with alacrity if we are to be the
beneficiaries of these advances, or else remain locked in obsolete infrastructure and mindsets. Decisions and
choices today may prove less than anticipated tomorrow, despite doing as much due diligence as possible to mitigate
less than stellar outcomes. Nevertheless, decisions must be made today, as best that we are able, given the best that
we have. When outcomes are not exactly as we anticipated, we must all continue to work together and look to the
future.
We have met our challenges head on with determination and commitment. We have many more challenges before
us. By commitment and continued collaboration, we shape our energy future.

ENERGY EFFICIENCY PORTFOLIO STANDARDS
The energy efficiency portfolio standards (HRS 269-96) mandates a 4,300-gigawatt-hour reduction in electricity use
by 2030 through efficiency and conservation measures. Hawaii surpassed its 2015 interim energy efficiency portfolio
standards target thanks in part to the robust issuance of energy performance contracts.

RENEWABLE PORTFOLIO STANDARDS
The renewable portfolio standards (HRS 269-92) mandates 100 percent renewable energy in the electricity sector by
2045. In 2017, the renewable portfolio standards stood at 27.6 percent, more than 12 percent ahead of the interim
statutory 2015 target of 15 percent.

                                                                  1| DBEDT Hawaii State Energy Office |Hawaii Energy Facts & Figures, June 2018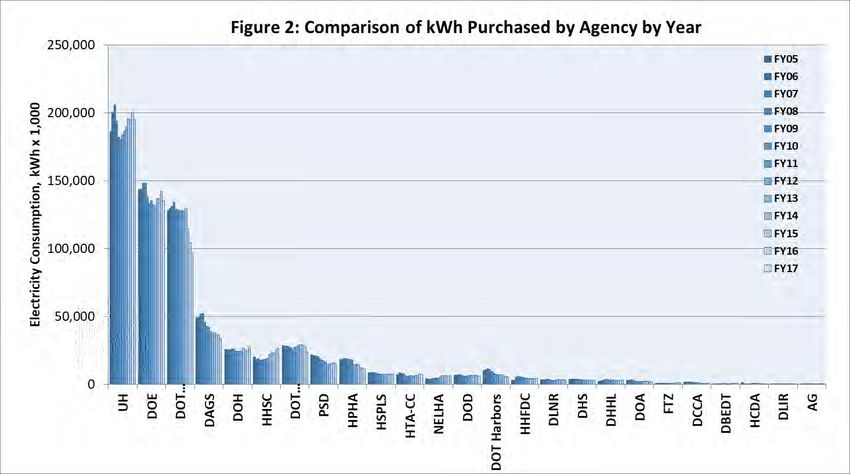
Hawaii Energy Overview
Hawaii depends more on petroleum for its energy needs than any other state. Less than 1% of electricity in the
United States is generated using oil. By contrast, Hawaii relied on oil for 67.3% and on coal for 15.1% of its electricity
generation in 2015.1
Hawaii Electricity Production by Source (2015)           U.S. Electricity Production by Source (2015)

ELECTRIC UTILITES
Hawaii’s electricity prices are more than double the U.S. average.

 In Hawaii, both electricity and gasoline prices correlate closely with the price of petroleum. This graph shows the
 prices of crude oil, gasoline, and electricity.2

                                                                     2 | DBEDT Hawaii State Energy Office |Hawaii Energy Facts & Figures, June 2018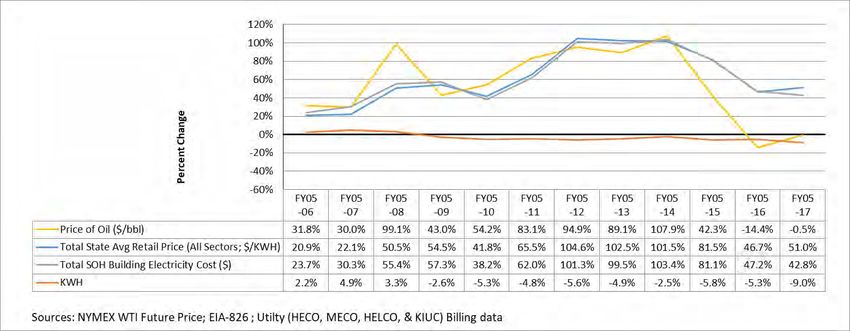
Hawaii Energy Overview
Electricity production and motor gasoline are just part of Hawaii’s fossil fuel usage. Large quantities of jet fuel are
also used in the state. In Hawaii, the air transportation sector accounts for the highest percentage of petroleum use,
followed by ground transportation and electricity production, with the remainder used for marine transportation,
commercial, industrial and residential uses.3 The figure below represents 2016 petroleum use, as reported by the U.S.
Energy Information Administration (EIA).

      2017 total foreign crude oil imports                 2017 fuel for electricity production
                                                  25.9                                                                          380
      (million barrels)4                                   (million gallons)5

      2017 total foreign petroleum imports                 2017 impacted foreign fuel for air
                                                  1,442                                                                         269
      (million gallons)6                                   transportation (i.e. jet fuel) (million gallons)7

      2017 Hawaii’s rank among 50 states for               2017 fuel for ground transportation
                                                    1                                                                           516
      energy prices8                                       (million gallons)9

                                                                   3 | DBEDT Hawaii State Energy Office |Hawaii Energy Facts & Figures, June 2018
Hawaii Energy Overview
The two primary electric utilities that service the power needs
of the state are Hawaiian Electric Industries Inc. (HEI) and Kauai
Island Utility Cooperative (KIUC).
HEI is the largest supplier of electricity in the state and serves
the majority of Hawaii’s population. Under HEI are three
electric utilities: Hawaiian Electric Company, Inc. (HECO) serves
Oahu; Maui Electric Company, Limited (MECO) serves Maui,
Molokai, and Lanai; and Hawaii Electric Light Company, Inc.
(HELCO) serves Hawaii Island.
KIUC operates as a cooperative and is not structured in the
same manner as HEI. However, both companies are committed
to the adoption and integration of renewable sources of energy in the effort to reduce the state’s dependency on oil
and both are regulated by the Public Utilities Commission (PUC).

RESIDENTIAL ELECTRICITY USE, RATES, AND MONTHLY BILLS
In general, the residential electricity use, rates, and bills have declined since 2011.
RESIDENTIAL, AVERAGE MONTHLY USE (KWH)

    Year               State Total        Oahu         Hawaii         Kauai            Lanai              Maui                Molokai

    2011                   584             609           520           473               435               612                    373

    2012                   543             561           494           465               413               574                    345

    2013                   514             523           473           464               430               557                    329

    2014                   496             501           458           464               443               545                    312

    2015                   497             504           454           474               424               541                    306

    2016                   484             488           450           478               425               517                    312

    2017                   482             486           451           491               417               510                    324
Source: State of Hawaii Data Book

RESIDENTIAL, AVERAGE RATE ($/KWH)
     Year              State Total       Oahu         Hawaii         Kauai            Lanai               Maui                Molokai
     2011                  $0.35         $0.32         $0.42         $0.43            $0.44               $0.36                 $0.43
     2012                  $0.37         $0.35         $0.42         $0.45            $0.47               $0.39                 $0.46

     2013                  $0.37         $0.35         $0.42         $0.44            $0.46               $0.38                 $0.46
     2014                  $0.37         $0.35         $0.42         $0.43            $0.46               $0.38                 $0.47
     2015                  $0.30         $0.28         $0.35         $0.34            $0.38               $0.31                 $0.38
     2016                  $0.28         $0.26         $0.32         $0.34            $0.34               $0.29                 $0.33
     2017                  $0.30         $0.28         $0.34         $0.35            $0.36               $0.31                 $0.36
Source: State of Hawaii Data Book

                                                                      4 | DBEDT Hawaii State Energy Office |Hawaii Energy Facts & Figures, June 2018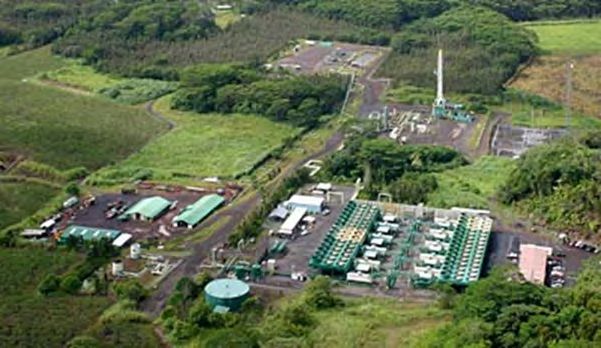
Hawaii Energy Overview

 RESIDENTIAL, AVERAGE MONTHLY BILL
      Year               State Total     Oahu        Hawaii         Kauai             Lanai              Maui                Molokai
      2011                  $202         $195         $218          $205              $192               $219                 $161
      2012                  $203         $197         $210          $209              $192               $222                 $159
      2013                  $189         $181         $199          $205              $199               $211                 $153
      2014                  $185         $178         $192          $199              $203               $206                 $147
      2015                  $149         $141         $157          $163              $159               $168                 $115
      2016                  $135         $127         $142          $163              $142               $147                 $102
      2017                  $145         $137         $154          $170              $150               $157                 $115
Source: State of Hawaii Data Book

COMPETITIVE BIDDING
 Hawaii’s electric utilities deliver electricity generated with their own units as well as power generated by
 Independent Power Producers (IPPs). If new or replacement generation is required, HECO, MECO, and HELCO are
 required to follow the “Competitive Bidding Framework” for new generation with capacities greater than 5 MW
 (Oahu) or 2.72 MW (MECO, HELCO), or receive a waiver of the competitive bidding requirements from the Hawaii
 Public Utilities Commission (PUC). As noted on HECO’s Competitive Bidding for New Generation webpage, current
 procurement activities include:
 Oahu Variable Renewable Dispatchable Generation RFP: On June 6, 2016 HECO requested that the PUC open a
 docket and appoint an Independent Observer to allow HECO to solicit proposals for new renewable energy
 generation to be in service by the end of 2020, consistent with the Five-Year Action Plan proposed in HECO’s Power
 Supply Improvement Plan (PSIP) update report filed with the PUC on April 1, 2016. PUC opened the related docket
 number 2017-0352 on October 6, 2017. Subsequently, PUC issued order 35286 approving with certain modifications
 HECO’s Proposed Final Variable Request for Proposals (RFP). HECO’s final Proposed Final Variable Request for
 Proposals were then filed with the PUC on February 27, 2018. Specifically, HECO’s RFP is soliciting for a total amount
 of variable renewable dispatchable generation of 485,000 megawatt hours (“MWh”) annually delivered to Oahu,
 over a preferred term of 20 years. Bids were due on April 30, 2018. The RFP process in ongoing.
 Hawaii Island Variable Renewable Dispatchable Generation RFP: On June 6, 2017 HELCO requested that the PUC
 open a docket and appoint an Independent Observer to allow HECO to solicit proposals for new renewable energy
 generation to be in service by the end of 2020, consistent with the Near-Term Resource Plan proposed in HELCO’s
 PSIP update report filed with the PUC in December of 2016. PUC opened the related docket number 2017-0352 on
 October 6, 2017. Subsequently, PUC issued order 35286 approving with certain modifications HELCO’s Proposed
 Final Variable Request for Proposals (RFP). HELCO’s final Proposed Final Variable Request for Proposals were then
 filed with the PUC on February 27, 2018. Specifically, HELCO’s RFP is soliciting for a total amount of variable
 renewable dispatchable generation of 95,000 megawatt hours (“MWh”) annually delivered to the Island of Hawaii,
 over a preferred term of 20 years. Bids were due on April 30, 2018. The RFP process in ongoing.
 Maui Variable Renewable Dispatchable Generation RFP: On June 6, 2017 MECO requested that the PUC open a
 docket and appoint an Independent Observer to allow HECO to solicit proposals for new renewable energy
 generation to be in service by the end of 2020, consistent with the Near-Term Resource Plan proposed in MECO’s
 PSIP update report filed with the PUC in December of 2016. PUC opened the related docket number 2017-0352 on
 October 6, 2017. Subsequently, PUC issued order 35286 approving with certain modifications MECO’s Proposed
 Final Variable Request for Proposals (RFP). MECO’s final Proposed Final Variable Request for Proposals were then
 filed with the PUC on February 27, 2018. Specifically, MECO’s RFP is soliciting for a total amount of variable
 renewable dispatchable generation of 270,000 megawatt hours (“MWh”) annually delivered to Maui, over a
 preferred term of 20 years. Bids were due on April 30, 2018. The RFP process in ongoing.

                                                                    5 | DBEDT Hawaii State Energy Office |Hawaii Energy Facts & Figures, June 2018
Hawaii Energy Overview

COMPETITIVE BIDDING (con’t)
Maui Firm Capacity Renewable Dispatchable Generation RFP: On May 5, 2016, Maui Electric Company asked the
PUC requested that the PUC open a docket to begin the process of acquiring approximately 40 megawatts (MW) of
dispatchable, firm generation - about 20 MW from renewable resources and 20 MW from fuel-flexible resources - by
2022. On October 6, 2017, the PUC issued Order No. 34856 opening docket number 2017-0352 to receive filings
related to the Hawaiian Electric Companies' (Companies) plans to proceed with competitive procurement to acquire
firm generation and new renewable generation. In accordance with Order No. 34856, on October 23, 2017, the
Companies submitted a Draft Firm Capacity Renewable Dispatchable Generation RFP, Draft Variable Renewable
Dispatchable Generation RFP, and respective supporting documentation to the commission for their review. On
January 12, 2018, the PUC issued Order No. 35224 "Providing Guidance on the Hawaiian Electric Companies'
Proposed Request for Proposals for Dispatchable and Renewable Generation." The Order appoints Independent
Observers (IO) and advises that further guidance from the PUC and IO regarding the Maui Firm Capacity Renewable
Dispatchable Generation RFP will be provided in the first quarter of 2018.

NET ENERGY METERING (NEM)
NEM is now closed to new applicants. Previously, the NEM program was available to permanent customers who own
(or lease from a third party) a solar energy generating facility, that was located on their own property, and had a
capacity of 100 kWh or less. Under the NEM program:
  • Customers receive a credit at retail rate for electricity exported to the grid.
  • If a customer uses more electricity than is exported (net-consumer), the customer is charged for that net
       amount of electricity used.
  • If a customer exports more electricity than is used (net-producer), the customer is charged a minimum bill (e.g.
       $17 for Oahu residential customers), and is allowed to carry any excess credits forward to the next month.
  • At the end of the customer’s 12-month billing cycle any excess credit are forfeited or used to reimburse any
       energy charges previously paid.

CUSTOMER GRID-SUPPLY (CGS)
When the PUC established this interim program, they established a cap for each of the HECO Companies’ service
territories: 25 MWac for HECO, 5 MWac for MECO, and 5 MWac for HELCO. These caps were established as the PUC
concluded that it was not in the public interest to allow unconstrained growth in the grid-supply option, particularly
if such growth comes at the expense of future opportunities to acquire even lower-cost renewable energy from
other sources, or prevents the HECO Companies from offering community-based renewable energy options for their
customers. By September 2016, all three HECO Companies met their designated cap limits.
Subsequently, additional capacity was added to CGS from capacity available from Net Energy Metering applications
that were cancelled or withdrawn.
 Program Capacity Remaining
 Island                       Original Capacity MWac        Added Capacity                           Total Capacity MWac*
 Hawaiian Electric            25.00                         26.31                                    51.31
 Maui Electric**              5.00                          9.12                                     14.12
 Hawaii Electric Light        5.00                          4.91                                     9.91

* As of Nov. 7, 2017, the CGS program reached the total capacity allotted.
** Includes Maui, Molokai and Lanai

                                                                   6 | DBEDT Hawaii State Energy Office |Hawaii Energy Facts & Figures, June 2018
Hawaii Energy Overview
Fixed Rates for Electricity Exported to the Grid Under the CGS Program
Island                                                          Credit***
Oahu                                                            15.07¢/kWh
Hawaii                                                          15.14¢/kWh
Maui                                                            17.16¢/kWh
Molokai                                                         24.07¢/kWh
Lanai                                                           27.88¢/kWh
***
  Export credits may only be used during the month they are generated. Excess monthly credits expire with the utility
cost reductions benefiting all customers.

CUSTOMER GRID-SUPPLY PLUS (CGS+)
The CGS+ program is the next iteration of the original CGS program. Similar to CGS program, the CGS+ program
allows customers to install private rooftop solar or other renewables that export energy to the electric grid
throughout the day. However, the CGS+ program does differ from the CGS program:
   • The CGS+ requires the use of equipment that allows the utility to manage output to maintain safe, reliable grid
     operations.
   • The CGS+ program changed the export rates to the following fixed rates through October 20, 2022:

      • The CGS+ program has capacity limits that varies by utility and will remain open until the following installed
        capacity is reached:

CUSTOMER SELF-SUPPLY (CSS)
The CSS program is intended only for private rooftop solar installations that are designed to not export any electricity
to the grid. Customers are not compensated for any export of energy.
CSS systems are also eligible for expedited review and approval of applications in areas with high levels of PV. Under
the CSS program:
   • Customers are not compensated for electricity exported to the grid.
   • Customers pay for the amount of electricity used from the grid.
   • A residential customer is charged a minimum monthly bill of $25 for residential customers.

                                                                       7 | DBEDT Hawaii State Energy Office |Hawaii Energy Facts & Figures, June 2018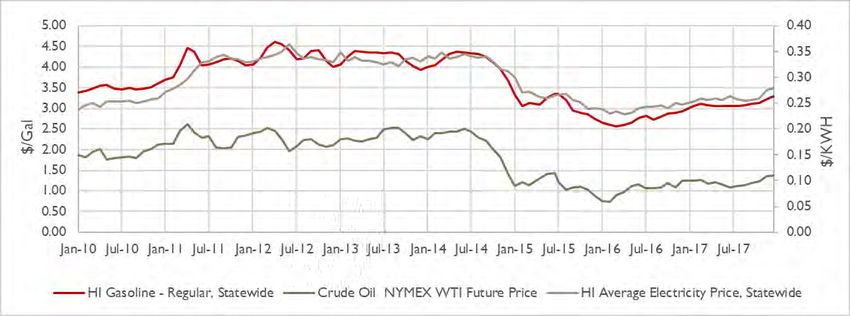
Hawaii Energy Overview
SMART EXPORT
Smart Export allows customers to install a private rooftop solar or other renewable system and a battery energy
storage system. Customers are expected to charge the battery storage system from the rooftop solar or other
renewable system during the daylight hours (9:00 a.m. – 4:00 p.m.) and use that energy to power their home in the
evening.
However, customers are able to receive a credit for any energy exported to the grid during the evening, overnight
and early morning hours. Energy exported to the grid during the daylight hours is not compensated. Under Smart
Export, customers receive a monthly bill credit for energy delivered to the grid, which helps to offset the cost of
energy pulled from the grid when the customer’s system is not producing enough energy to meet the household
demand. The export credit is fixed through October 22, 2022.

*
Export credits will be trued-up on an annual basis and any remaining credits left over at the end of the year will expire
with the utility cost reduction benefitting customers.

QUICK COMPARISON OF HECO’S EXISTING CUSTOMER RENEWABLE PROGRAMS

 *
  Standard retail rates applied for energy used when rooftop solar or other renewable system is not exporting to the grid.
 Customers on rates other than retail should contact us to verify whether those options will apply in coordination with these
 programs.
 **
    Customer Grid-Supply remains open until installed capacity is reached. New applications are placed into queue for
 processing if and when space in the program becomes available. There is no guarantee that space will become available.
 New applications may be submitted via mail and are not supported in the Customer Interconnection Tool.

STANDARD INTERCONNECTION AGREEMENT (SIA)
All permanent customers are eligible to interconnect a renewable or non-renewable energy generating facility
through the SIA program. These systems are not compensated for any power exported to the grid, and in some
cases, are restricted from exporting power. Lastly, there are no capacity restrictions for SIA systems.

                                                                       8 | DBEDT Hawaii State Energy Office |Hawaii Energy Facts & Figures, June 2018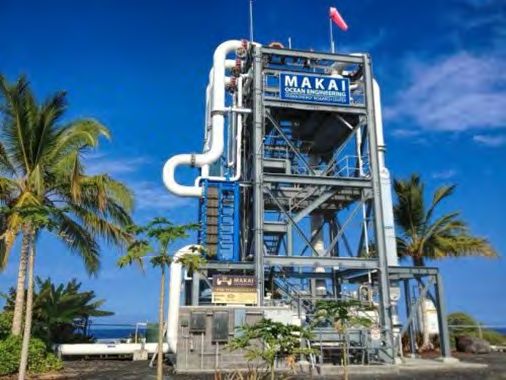
Hawaii Energy Overview

FEED-IN TARIFF (FIT)
The FIT queue is now closed. Prior to this, renewable electricity suppliers with generators smaller than 5 MW were
eligible to participate in the HECO Companies’ FIT Program, supplying as-available power to the utility at constant,
contracted rates over 20 years.
Hawaiian Electric Companies' Feed-in Tariff Rates
                                               Concentrating Solar
                     Photovoltaics (PV)                                         On-Shore Wind                      In-line Hydro
                                               Power (CSP)
Tier    Island
                     Rate (¢/                  Rate (¢/                         Rate (¢/                           Rate (¢/
                                 Size Limit                 Size Limit                           Size Limit                          Size Limit
                     kWh)                      kWh)                             kWh)                               kWh)
                         *                         *
                     21.8                      26.9
1       All              **      20 kW                      20 kW               16.1             20 kW             21.3              20 kW
                     27.4                      33.1**
          Oahu                        500 kW                      500 kW
          Maui &          18.9  *
                                                       25.4*
,2                                    250 kW                      500 kW        13.8             100 kW            18.9              100 kW
          Hawaii          23.8**                       27.5**
          Lanai &
                                      100 kW                      100 kW
          Molokai
          Oahu                        5 MW                        5 MW          12.0             5 MW              --                --
                          19.7*                        31.5*
3         Maui &          23.6**      2.72 MW          33.5**     2.72 MW       --               --                --                --
          Hawaii
*                          **
 With tax credit of 35%     With tax rebate of 24.5%
FIT aggregate limits: Oahu 60 MW; Hawaii Island 10 MW; Maui, Lanai, Molokai (combined) 10 MW
In December 2014, the PUC accepted HECO and the Independent Observer's joint plan to administer the FIT queues. Future revisions or
modifications to the FIT Program will be addressed in Docket No. 2014-0192 or 2014-0183.

                                                                              9 | DBEDT Hawaii State Energy Office |Hawaii Energy Facts & Figures, June 2018
Energy Efficiency
ENERGY EFFICIENCY PORTFOLIO STANDARDS (EEPS)
Under HRS 269-96, the EEPS statute, the Public Utilities Commission is responsible for establishing standards that will
maximize cost-effective energy-efficiency programs and technologies. The goal for EEPS is a reduction of electricity
consumption by 4,300 gigawatt-hours by 2030. To assist with the planning for the achievement of EEPS, HSEO held a
second Hawaii Clean Energy Initiative Energy Efficiency Charrette on September 26 and 27, 2017. The objective of the
charrettes is to give stakeholders a forum to discuss how we can support the achievement of greater energy efficiency
than the current programs and plans support. The second charrette built on the discussion from the previous charrette
which included an update of energy efficiency in Hawaii, insights about energy efficiency programs throughout the U.S.,
and the importance or public engagement, collaboration, and coordination to help the state achieve its energy
efficiency goals.
Hawaii Energy (HE) continues to be a major contributor to the state’s EEPS goals. Hawaii
Energy encourages and rewards smart energy decisions which will allow our state to reach
100 percent clean energy faster and cheaper through energy efficiency and conservation. As
the Public Benefit Fee Administrator, HE serves all of the islands except for Kauai. From July
1, 2017 through March 31, 2018, the program invested over $22 million to deliver more than
1.8 billion kWh in estimated lifetime customer-level energy savings at a rough cost of
one-cent per kWh. This is the equivalent to building a 92 MW solar farm, enough to power
288,000 homes for a year. In addition, this will reduce greenhouse gas emissions by nearly
1.5 million tons.
Energy Performance Contracts
Energy Performance Contracts (EPC) finance improvements that reduce energy and water use with the future savings
from the energy conservation measures (ECM) that are installed. ECM also include photovoltaic installations.
Under an EPC, the energy service company contracted to install the ECM will guarantee the savings or pay for the
shortfall. EPC allow government agencies to maximize their energy investments because they can include deferred
maintenance and performance period maintenance services under a single contract with guaranteed savings
measures. The economic impacts of performance contracts are significant, providing great value to the state.
Performance contracts allows agencies to install ECM in a timely manner. ECM can take less than one year to up to
three years to install. Therefore, energy savings occur sooner than later. Capital improvement projects can take from
six to 10 years, resulting in missed opportunities for annual energy and water use savings. State and county agencies
face increasing energy and water costs and the need to upgrade aging, inefficient, and obsolete energy- and water-
consuming equipment. Capital improvement and operating budgets have been unable to keep up with the needed
upgrades for ECM.
Hawaii surpassed the half-billion-dollar mark for investment in EPC in 2017. With $507.1 million in signed EPC to date,
Hawaii became just the seventh state nationally to eclipse the half-billion-dollar threshold for EPC investment.
“Hawaii has long been the national leader for its investment in performance contracting projects on a per capita basis.
But now they have joined a handful of states in the exclusive half-billion club for total investment in energy saving
projects,” said Jim Arwood, executive director of the Energy Services Coalition. “Other members include the states of
Washington, Ohio, Kentucky, North Carolina, Colorado and Massachusetts.”
10 | DBEDT Hawaii State Energy Office |Hawaii Energy Facts & Figures, June 2018Energy Performance Contracts
RACE TO THE TOP AWARD
For six consecutive years, Hawaii has garnered further national recognition with the Race to the
Top award from the Energy Services Coalition (ESC)*. The award is given to the national leader
with the highest per capita investment in performance contracting projects. With the Department
of Transportation, Airports Division, performance contract for nearly $209.8 million, ESC
recognizes Hawaii with the distinction of signing the single largest performance contract by a state
agency. Since 2012 through 2017 the ESC has awarded Hawaii the Race to the Top award for its
per-capita investment. In 2017 the ESC also recognized the State of Hawaii with its second Energy
Stewardship Champion award for outstanding accomplishments leveraging performance
contracting to achieve infrastructure modernization, environmental stewardship, and economic development.
“Guaranteed energy savings performance contracting (GESPC) is a financial strategy leveraging guaranteed future
energy savings to pay for energy efficiency upgrades today,” said Jim Arwood, ESC Executive Director. "Hawaii has
achieved considerable recent success in support of implementing energy efficiency projects in public buildings through
the use of a GESPC.”
Energy Services Coalition Ranking
State Population Performance Contracting Dollars per Capita
1. Hawaii 1,360,301 $507,133,904 $372.81
2. Washington 6,724,540 $1,288,925,725 $191.67
3. Kentucky 4,339,367 $750,000,000 $172.84
4. Delaware 897,934 $138,707,463 $154.47
5. Massachusetts 6,547,629 $865,349,091 $132.16
Since HSEO started the performance contracting program in 1996, state and local government agencies have signed a
total of over $507 million in performance contracts that are estimated to save in excess of $1.1 billion over the life of
the contracts. These savings are the equivalent of powering 388,210 homes for one year. The projects comprise over
112 million square feet in 295 existing buildings or facilities.
*
ESC is a national nonprofit organization of experts working together to increase energy efficiency and building upgrades through
energy performance contracting.
11 | DBEDT Hawaii State Energy Office |Hawaii Energy Facts & Figures, June 2018State of Hawaii Agencies Lead By Example
STATE AND COUNTY ENERGY PERFORMANCE CONTRACTS
The chart below illustrates the number of EPC projects conducted by state and county agencies from 1996 through
2017. In addition, over $8 million in rebate incentives have been claimed from Hawaii Energy, reducing the cost of the
energy efficiency improvements through performance contracting projects. Looking ahead, the state anticipates more
EPC investments.
Agency Year(s) Contract Amount ($) Estimated Savings Over Life
of Contract ($)
U.H. Hilo 1996-2012 $6,402,695 $14,630,066
County of Hawaii 1997-2026 $2,215,546 $8,157,880
County of Kauai 1998-2012 $525,965 $1,205,990
C&C of Honolulu 2001-2025 $11,900,205 $36,066,761
Hawaii Health Systems Corporation 2002-2022 $21,936,997 $55,766,364
Judiciary 2003-2012 $1,474,406 $9,785,036
Dept. of Accounting & General 2009-2029 $36,873,266 $72,580,767
Services Phase I
Department of Public Safety 2010-2030 $25,511,264 $57,211,112
University of Hawaii Community 2012-2032 $34,207,392 $37,000,000
Colleges
C&C Honolulu Kailua Wastewater 2013-2033 $6,054,178 $13,693,910
Treatment Plant
Dept. of Accounting and General 2013-2033 $17,400,000 $28,000,000
Services Phase II
Department of Transportation 2013-2034 $309,506,592 $795,560,746
Honolulu Board of Water Supply 2016-2036 $33,125,398 $56,846,668
Total $507,133,904 $1,186,505,300
For nearly 20 years HSEO has been leading the state’s award-winning EPC efforts with a policy offering technical
assistance to state agencies contemplating performance contracting. We’ve assisted the following entities:
• University of Hawaii at Hilo
• Hawaii Health Services Corporation
• City and County of Honolulu’s four city buildings and Kailua Wastewater Treatment Facility
• County of Hawaii
• County of Kauai
• The Judiciary
• Department of Accounting and General Services (DAGS)-Phase I-10 large office buildings
• University of Hawaii Community Colleges
• Department of Public Safety’s four large facilities
• Department of Transportation: Airports, Highways and Harbors
• DAGS Phase II - 33 buildings
• Honolulu Board of Water Supply
12 | DBEDT Hawaii State Energy Office |Hawaii Energy Facts & Figures, June 2018State of Hawaii Agencies Lead By Example
The types of technical assistance offered, pending funding, include:
1. Assisting an agency in compiling building plans and other information to use in solicitations
2. Reviewing draft solicitations
3. Evaluating proposed energy conservation measures, including renewable and water efficiency measures
4. Setting energy performance baselines
5. Reviewing methods for estimating energy savings (including formulas and simulation models); measurement and
verification
6. Reviewing investment grade energy audits
7. Reviewing draft contract documents
8. Advising on commissioning
9. Advising on how project risks can be allocated and minimized for the state agency
In 2006 legislative and executive mandates to incorporate energy and resource efficiency and conservation in
government facilities, fleets, and personnel practices gave impetus to the state’s Lead by Example (LBE) initiative to put
state agencies at the forefront of energy independence efforts. As shown in the graph below, Hawaii state agencies’
electricity purchased through 2017 has declined 9.0 percent from 2005 (the baseline year). Due to staff reductions,
HSEO will no longer provide a special report on LBE, but we will continue to track and report electricity use by state
agencies.
Comparison of State Agencies’ Electricity Purchased in kWh: FY05 to FY17
13 | DBEDT Hawaii State Energy Office |Hawaii Energy Facts & Figures, June 2018State of Hawaii Agencies Lead By Example
Comparison of kWh Purchased by Agency by Year
AG Department of the Attorney General DOT Harbors Department of Transportation/Harbors Division
DAGS Department of Accounting and General Services DOT Highways Department of Transportation/Highways Division
DBEDT Department of Business, Economic Development & Tourism FTZ Foreign-Trade Zone Division
DCCA Department of Commerce and Consumer Affairs HCDA Hawaii Community Development Authority
DHHL Department of Hawaiian Home Lands HHFDC Hawaii Housing Finance & Development Corporation
DHS Department of Human Services HHSC Hawaii Health Systems Corporation
DLIR Department of Labor and Industrial Relations HPHA Hawaii Public Housing Authority
DLNR Department of Land and Natural Resources HSPLS Hawaii State Public Library System
DOA Department of Agriculture HTA-CC Hawaii Tourism Authority – Convention Center
DOD Department of Defense NELHA Natural Energy Laboratory of Hawaii Authority
DOE Department of Education PSD Department of Public Safety
DOH Department of Health UH University of Hawaii
DOT Airports Department of Transportation/Airports Division
14 | DBEDT Hawaii State Energy Office |Hawaii Energy Facts & Figures, June 2018State of Hawaii Agencies Lead By Example
Statewide Electricity Purchased Since 2005
Percentage change in electricity purchased, from baseline (2005) and each following year. Shown are the price of oil,
the average retail price of electricity*, total statewide electricity costs and electricity purchased (kWh).
Since 1996, state agencies have received nearly $11.9 million in efficiency rebates from Hawaii Energy, the Hawaiian
Electric Company and its subsidiaries. Combined, these rebates have resulted in more than $250 million estimated
cumulative dollar savings and 1.3 billion kWh electricity savings. Over the life of the equipment, these savings would
be enough to power about 208,000 households for a year. From June 2017 through March 2018, state agencies
received $424,700 in rebates.
*
Based on U.S. Energy Information Administration‐826 reporting, dividing utility total revenues by total kWh sold, including fuel
adjustment cost.
15 | DBEDT Hawaii State Energy Office |Hawaii Energy Facts & Figures, June 2018State Energy Building Code Update
On July 14, 2015, the State Building Code Council (SBCC) unanimously
voted to adopt the International Energy Conservation Code (IECC) 2015,
with the Tropical Climate Zone Code for residential dwellings and other
amendments appropriate for Hawaii’s climate. After a public hearing
which garnered full support of IECC 2015, Gov. Ige signed and approved
IECC 2015 on March 20, 2017, to adopt Chapter 3-181.1, into Hawaii
Administrative Rules.
HSEO serves on the SBCC, which was established by statute to update
building codes. HSEO provided IECC 2015 technical assistance and staff
training for 310 private and public-sector design professionals and
county building officials. HSEO also will testify in support of IECC 2015 when the county councils hold public hearings
on their adoption.
The estimated net savings from the 2015 IECC with Hawaii amendments is 12,962 MWh in 2019, 1,083,590 MWh in
2029 (year 10), 1,991,059 MWh in 2032 and 4,702,738 MWh in 2038 (year 20). These savings could power 732,514
homes in 2038, assuming the code is adopted by all counties.
Commercial Code Savings: Commercial buildings would achieve a 35-40 percent energy saving by adopting the base
2015 IECC with references to ASHRAE 90.1-2013 (compared to 2006 HEC with references to ASHRAE 90.1-2004).
Amendments under consideration by HSEO will further increase potential energy savings.
Residential Code Savings: Fully conditioned 2015 IECC residences would achieve a 6 to 9 percent improvement in
energy efficiency.
HSEO’s website has more information on the updated energy code at energy.hawaii.gov/hawaii-energy-building-code,
including a report on the analysis of the code amendments, FAQs gathered from the various training sessions
statewide, presentation webinars, fact sheets and a report forecasting the energy savings for the updated code.
Leadership in Energy and Environment Design (LEED)
The U.S. Green Building Council (USGBC) released its State Market Briefs. The brief highlights the
number of LEED certified and registered projects in the state, as well as the gross square footage.
As of May 2018, Hawaii has 185 LEED certified projects and 245 registered projects. This totals 430
total projects for a gross square footage of over 50 million gross square feet. Utilizing less energy
and water, LEED-certified spaces save money for families, businesses and taxpayers; reduce carbon
emissions; and contribute to a healthier environment for residents, workers and the larger
community. The certified buildings included numerous private developments, as well as federal,
state, and county public buildings.
HSEO remains a member of the U.S. Green Building Council (USGBC), the non-profit entity which administers the LEED
program. In 2018, Hawaii was back among the top 10 states for LEED certified project square footage per capita. With
4.5 million LEED-certified gross square footage, Hawaii rated 4th highest state in the U.S. this year.
The state requires all new construction and major renovation to meet LEED Silver standards, to the extent possible.
HSEO continues to promote LEED training opportunities for state agency staff. Hookele Elementary School and the
Moana Surfrider, Sheraton Waikiki, and The Royal Hawaiian were recently LEED-certified.
16 | DBEDT Hawaii State Energy Office |Hawaii Energy Facts & Figures, June 2018ENERGY STAR® Buildings
To help identify energy efficiency investment priorities, agencies and private sector building owners and managers can
benchmark buildings to compare energy usage with other buildings in their portfolio or similar buildings nationally. If a
building’s performance, as reflected in its ENERGY STAR score, ranks in the top 25 percent of all buildings of its type, it
can be certified as an ENERGY STAR building.
To qualify for certification, a building must meet ENERGY STAR requirements as verified by a licensed professional
engineer or architect. The U.S. Environmental Protection Agency (EPA) then evaluates the verification submitted and, if
approved, will officially certify the applicant as an ENERGY STAR building. Since 2000, 170 Hawaii buildings have
received the ENERGY STAR certification, including 103 public and 67 private buildings. During this time, HSEO has
helped benchmark 83 state facilities. Because energy use is constant, buildings should be verified and certified as
ENERGY STAR annually to ensure optimum efficiency.
Hawaii Green Business Program
Hawaii’s businesses are also contributing to the clean energy movement by
improving their operations in an environmentally, culturally and socially
responsible manner. To help businesses implement energy and resource
efficiency practices, the state set up the Hawaii Green Business Program as a
partnership between HSEO, the Department of Health, the Board of Water
Supply and the Chamber of Commerce of Hawaii. When businesses embrace
green business practices, they don’t just enjoy utility cost savings – they also
contribute to Hawaii’s collective energy independence goals and, ultimately, a
more sustainable environment.
From 2009-2017, over 100 business and government entities have benefited from the program, including sectors such
as hospitality, commercial office, retail, restaurant, food services, grocery, venue and green events. Their savings
amounts to:
• 22.7 million kWh of energy (equivalent to powering 3,531 homes for one year in Hawaii)
• 203.2 million gallons of water
• $6.4 million in energy costs
For more information on the Hawaii Green Business Program, visit greenbusiness.hawaii.gov
17 | DBEDT Hawaii State Energy Office |Hawaii Energy Facts & Figures, June 2018Renewable Energy
As defined by Section 269-91 Hawaii Revised Statutes (HRS), “renewable energy” means energy generated or
produced using the following sources:
• Wind;
• Sun;
• Falling water;
• Biogas, including landfill and sewage-based digester gas;
• Geothermal;
• Ocean water, currents, and waves, including ocean thermal energy conversion;
• Biomass, including biomass crops, agricultural and animal residues and wastes, and municipal solid waste and
other solid waste;
• Biofuels; and
• Hydrogen produced from renewable energy sources.
18 | DBEDT Hawaii State Energy Office |Hawaii Energy Facts & Figures, June 2018Renewable Energy
RENEWABLE PORTFOLIO STANDARDS (RPS)
As required by Section 269-92 HRS, each electric utility company that sells electricity for consumption in Hawaii shall
establish a renewable portfolio standard of:
• 30% of its net electricity sales by December 31, 2020;
• 40% of its net electricity sales by December 31, 2030;
• 70% of its net electricity sales by December 31, 2040; and
• 100% of its net electricity sales by December 31, 2045.
Where “renewable portfolio standard” means the percentage of electrical energy sales that is represented by
renewable electrical energy (Sec 269-91 HRS). Beginning January 1, 2015, renewable electrical energy generated by
the utility, independent power producers, and customer-sited, grid-connected sources are counted towards their
RPS. While electrical savings from energy efficiency and solar water heating are not.
Each electric utility is also required to file an annual RPS status report to the PUC (Docket No. 2007-2008). Instead of
filing individual RPS’s for each company, the HECO Companies opt to consolidate their RPS’s.
19 | DBEDT Hawaii State Energy Office |Hawaii Energy Facts & Figures, June 2018Renewable Energy
20 | DBEDT Hawaii State Energy Office |Hawaii Energy Facts & Figures, June 2018Renewable Energy
HAWAIIAN ELECTRIC COMPANIES KEY METRICS
The Hawaiian Electric Companies provide various key performance metrics on their website, two of these metrics are
System Renewable Energy and Total Renewable Energy.
System Renewable Energy (System RE)
The System Renewable Energy metric differs from the Renewable Portfolio Standard because it estimates the
percent of total net generation that is represented by renewable energy rather than being based on sales and does
not include customer-sited renewable generation. Net generation is the amount of electricity generated and
transmitted to the utility grid from the source (i.e., power plant). Generation from independent power producers
(“IPPs”) and utility power plants is recorded at the net generation level. Sales are lower than the net generation due
to losses in transmitting the electricity from the source to the customers. Therefore, the System Renewable Energy
will result in values lower than the RPS since customer-sited renewable generation is not included and net
generation is used instead of sales. The charts below show the results for the Companies on a consolidated and
individual basis.
Total Renewable Energy (Total RE)
The Total RE metric differs from the RPS because it is based on total energy and not sales. The Total RE metric is the
total renewable generation provided by independent power producers, the utility, and estimates for customer-sited,
grid-connected renewable energy, divided by the total generation provided by independent power producers, the
utility, and estimates for customer-sited, grid-connected renewable energy.
21 | DBEDT Hawaii State Energy Office |Hawaii Energy Facts & Figures, June 2018Bioenergy
“Bioenergy” includes both electricity generation and fuel production from biomass.
Biomass is plant and animal matter, including energy crops, wood, grasses, algae, vegetable oils, and agricultural and
municipal wastes. Bioenergy production potential in Hawaii depends on the availability of land and feedstock; CO2
sources (for algae); markets and values for primary products (electricity, fuels) and by-products (animal feed); and
overall revenues compared to costs.
“Biofuel” sometimes is used interchangeably with bioenergy, however biofuels is more commonly used specifically to
describe liquid bioenergy fuels. Biofuels are a renewable energy source that can be stored and transported in a
manner similar to fossil fuels, can often be used in existing equipment and be blended with petroleum fuels. One ton
of biomass replaces approximately one barrel of oil.
Since biodiesel fuel imports for electricity production began in 2010, the relative cost of the imported biodiesel fuel
has been significantly higher than for the fossil-based fuels used for electricity generation in Hawaii.
DBEDT 2012 BIOFUEL REPORT
In December 2012, and in accordance with Act 203, Session Laws of Hawaii, 2011, the Hawaii State Department of
Business, Economic Development and Tourism (DBEDT) provided a final report to the state Legislature, Biofuels
Study. The following were taken from this report.
Hawaii’s energy systems are highly dependent on liquid fuels. Petroleum is used for electricity production; ground,
air, and marine transportation; military activities; and other needs. Each year, Hawaii uses between 1.7 and 2.2
billion gallons of liquid petroleum fuels (fuel oil, gasoline, diesel, jet fuel, bunker fuels, and others). These needs
could be met by a combination of petroleum-based and renewable fuels (i.e. biofuels).
The materials (feedstocks) that could be used for biofuel production include sugars (from plants such as sugarcane or
sweet sorghum); starch (such as from corn or cassava); fiber (from grasses, trees, husks, stalks, fibers from oilseeds,
and from waste materials such as paper, sawdust, or other organic materials); and oil (such as jatropha, kukui,
microalgae, soybean, peanut, sunflower, oil palm, or waste cooking oil).
22 | DBEDT Hawaii State Energy Office |Hawaii Energy Facts & Figures, June 2018Bioenergy
Active Bioenergy Facilities
Technology Project Name Capacity Island Location
Biofuel Kauai Algae Farm Demonstration Kauai Lihue
Honolulu International Airport
Biofuel 10 MW Oahu Honolulu
Dispatchable Standby Generation Project
Biofuel Pacific Biodiesel Honolulu Plant 1 MGY Oahu Honolulu
HECO Campbell Industrial Park Generating
Biofuel 110 MW Oahu Kapolei
Station
Pacific Biodiesel Biofuel Crop Feedstock
Biofuel Maui Central Valley
Demonstration Project Demonstration
Biofuel Cellana Algae Kona Demonstration Facility Demonstration Hawaii Kailua-Kona
Biofuel Big Island Biodiesel 5 MGY Hawaii Keaau
Biofuel Hawaii Pure Plant Oil Demonstration Hawaii Keaau
Biomass Green Energy Biomass-to-Energy Facility 6.7 MW Kauai Koloa
Biomass HC&S Co-Generation Facility 16 MW Maui Puunene
Hawaii Air National Guard Waste-to- Joint Base Pearl
Waste-to-Energy Demonstration Oahu
Energy Microgrid System Demonstration Harbor-Hickam
Kapolei (Campbell
Waste-to-Energy HPOWER 88 MW Oahu
Industrial Park)
PVT Bioconversion Feedstock Processing Feedstock
Waste-to-Energy Oahu Nanakuli
Facility Production
Source: Hawaii State Energy Office, Renewable Energy Projects Directory
Geothermal
CURRENT PRODUCTION
The State of Hawaii has one operating geothermal power plant: the 38 megawatt (MW) Puna Geothermal Venture
(PGV) facility owned and operated by Ormat Technologies and located in Pahoa on the eastside of Hawaii island. PGV
began operating in 1993 at 25 MW and was expanded in 2011 to its current capacity of 38 MW. With its latest
expansion, PGV became the world’s first integrated combined cycle power plant capable of providing both baseload
power to the grid and dispatchable power that supports the integration of other intermittent (fluctuating) renewable
energy sources on Hawaii island (wind, solar, hydropower). PGV extracts steam and hot fluids from production wells
deep beneath the earth’s surface – a mile or more – and converts the steam into energy through heat exchangers
and steam turbine generators. Reuse of the steam in a closed loop system maximizes the energy output of the
extracted steam and fluids, and minimizes plant emissions under normal operating conditions. After use, the exhaust
steam and fluids are re-injected into the ground via injection wells at similar depths as the production wells. PGV
uses air to cool its turbines, which eliminates the need to use and dispose of water for cooling purposes. In 2017,
PGV produced 322.6 gigawatt-hours (GWh), which is enough to power 55,545 average Hawaii homes a year and
constitutes 30.8% of all energy used on Hawaii island and 3.7% of all energy used throughout the state (Hawaiian
Electric Companies’ 2017 Renewable Portfolio Standard Status Report). PGV was shut down in May 2018 due to the
volcanic eruption of Kilauea. At time of this print, PGV’s future status remains unknown due to the active lava flows
in the project area.
23 | DBEDT Hawaii State Energy Office |Hawaii Energy Facts & Figures, June 2018Geothermal
Prior to PGV, the first geothermal production well in Hawaii was drilled in 1976 by the University of Hawaii in the
lower Kilauea East Rift Zone on the southeast side of Hawaii island: the Hawaii Geothermal Project – Well A (HGP-A).
In 1982, the U.S. Department of Energy developed a 3 MW experimental power plant at the site, which was shut
down in the late 1980s.
Puna Geothermal Venture Power Plant, Pahoa, Hawaii Island
STATUS OF COMPETITIVE SOLICITATION
In October 2017, Maui County’s electric utility, Maui Electric Company (MECO), submitted to the Hawaii Public
Utilities Commission (PUC) a Draft Request for Proposals for Renewable Firm Capacity and Dispatchable Energy
Resources on the island of Maui (Maui Firm RFP), which includes geothermal. In January 2018, the PUC instructed
MECO to be prepared to initiate the Maui Firm RFP following further guidance from the PUC. The status of the Maui
Firm RFP is still pending.
In May 2012, the Hawaii Electric Light Company (HELCO) initiated a competitive bidding procedure (request for
proposals) seeking 50 MW of dispatchable geothermal firm capacity generation; however, in February 2016, HELCO
notified the PUC and all other parties that power purchase agreement negotiations for this procurement had
concluded unsuccessfully (PUC Docket No. 2012-0092).
RESOURCE PLANNING AND POTENTIAL
Hawaiian Electric’s Power Supply Improvement Plan (PSIP) Update Report: December 2016 (PUC Docket No. 2014-
0183) forecasts 40 MW of new geothermal development on Maui by 2040 and an additional 40 MW of geothermal
on Hawaii island by 2030. Studies indicate the islands of Maui and Hawaii combined have a minimum potential
geothermal capacity of 525 MW, with a more likely combined capacity of 1,535 MW (GeothermEx, Inc., 2005). Other
Hawaiian islands, particularly Kauai and Oahu, do not show as much potential for geothermal development, but are
still under consideration for additional study and possible use, as are Molokai and Lanai.
24 | DBEDT Hawaii State Energy Office |Hawaii Energy Facts & Figures, June 2018Geothermal
RESOURCE EXPLORATON
Geothermal’s promise as a firm, cost-competitive source of baseload renewable energy continues to encourage
exploratory efforts to better understand Hawaii’s geothermal resource potential. Geothermal resources in Hawaii are
difficult to fully characterize without exploration and drilling because Hawaii’s high-temperature resources – some of
the world’s hottest – are generally found deep beneath the ground surface. Typical ‘non-invasive’ exploratory data
gathering techniques used in Hawaii include: literary and oral research; magnetotellurics (MT), which uses
electromagnetic signals to detect subsurface electrical conductivity; water sampling to detect chemical composition;
and, computer modeling. The Hawaii Groundwater and Geothermal Resources Center (HGGRC) catalogs much of the
completed and ongoing geothermal-related explorations in Hawaii (https://www.higp.hawaii.edu/hggrc/). Recently
completed surficial geophysical studies in the Saddle Road area of Hawaii island indicate the potential presence of
geothermal and groundwater activity in this region (Final Report: Magnetotelluric and AudioMagnetotelluric Surveys
on DHHL Lands Mauna Kea East Flank, 2016).
The ongoing Hawaii Play Fairway Project, managed by HGGRC and supported by the U.S. Department of Energy, will
provide the first statewide geothermal resource assessment conducted since the late 1970s. Phase I, completed in
2015, involved the identification, compilation, and ranking of existing geologic, groundwater, and geophysical
datasets relevant to subsurface heat, fluid, and permeability in Hawaii. Phase II, completed in 2017, involved the
collection new groundwater data in 10 locations across the State and new geophysical data on Lanai, Maui, and
central Hawaii island, modeling the typography of the areas of interest to better characterize subsurface
permeability, and the development of an updated geothermal resource probability map. Phase III, which is ongoing,
involves the collection and analysis of scientific data from existing well sites and may include drilling of a geothermal
test well (“slim hole”) at one of the high probability locations determined through Phases I and II. Results from the
Hawaii Play Fairway Project will also indicate areas warranting additional geothermal resource exploration.
Hawaii Play Fairway Project (Lautze, N., Geothermics 2017)
Finally, Ormat had expressed interest in exploring on Maui around 2012, focusing on the southwest rift zone of
Haleakala, with partial funding from the U.S. Department of Energy (USDOE), but nothing indicates Ormat is
proceeding (Ulupalakua Geothermal Mining Lease and Geothermal Resource Subzone Modification Application,
2012).
25 | DBEDT Hawaii State Energy Office |Hawaii Energy Facts & Figures, June 2018Geothermal
PRICING
Geothermal electricity is generally cheaper than energy produced from petroleum fuels and other forms of
renewable electricity in Hawaii. GeothermEx, Inc. estimates the levelized power cost of geothermal for a hypothetical
30 MW plant on Hawaii would be between 7¢ to 8.7¢ per kilowatt-hour (kWh), with operation and maintenance
costs between 4¢ to 6¢ per kWh and capital costs between $2,500 to $5,000 per installed kilowatt (Assessment of
Energy Reserves and Costs of Geothermal Resources in Hawaii, GeothermEx, Inc., 2005). PGV sells power to HELCO at
the following cost (per kWh):
• First 25 MW: 18.8¢ on-peak, 15.9¢ off-peak
• Next 5 MW: 11.8¢
• Last 8 MW: 9¢
DIRECT USE GEOTHERMAL
While currently not used in Hawaii, direct use geothermal offers promise in areas with industrial or agricultural
processing and hot groundwater at or near the surface. Direct use geothermal systems do not generate electricity,
but extract heated groundwater for direct uses, including: large-scale pool heating; space heating, cooling, and on-
demand hot water for buildings of most sizes; district heating (i.e., heat for multiple buildings in a city); heating roads
and sidewalks to melt snow; and, some industrial and agricultural processes. Because hot water for direct use is
typically close to the surface, drilling and development capital costs are relatively small compared to deeper
geothermal systems.
ENVIRONMENTAL AND HEALTH CONSIDERATONS
Geothermal energy offers some environmental benefits because it can be produced with burning a fossil fuel,
produces minimal emissions and manufactured wastes if designed and regulated properly, and provides a constant
(24 hours a day) source of reliable power at around 90% output capacity. PGV’s dispatchability also enables it to
support the grid’s integration of other sources of the renewable energy. Numerous federal, state, and county
regulations are in place to govern geothermal developments. However, if not regulated, designed, and operated
properly, geothermal exploration and production technologies have the potential to negatively impact the
surrounding environment and human populations.
In Hawaii, concerns about geothermal’s impacts to human health and the environment are well documented and
have led to more stringent local regulations in some cases (i.e., night-time drilling ban on Hawaii island within one
mile of nearest residence). One of the primary concerns in Hawaii is the release of hydrogen sulfide, a poisonous gas
that can cause acute and chronic respiratory conditions in humans and acidic environmental conditions. Air
monitoring, materials handling, and other controls are required to regulate planned and unplanned emission
releases. The noise and lighting caused by drilling and plant operations can also impact nearby communities and
often requires mitigation or avoidance measures. Also of concern is the potential risk to groundwater from the
injection or inadvertent release of used geothermal fluids being extracted or injected back into the earth. Stringent
well operations and drilling regulations, treatment of these fluids to match their extraction composition, and
injection far below groundwater tables can mitigate this risk.
Any new geothermal developments in Hawaii would require thoughtful planning, comprehensive environmental
impact analysis, and considerable community engagement prior to deciding on the viability of a given project.
CULTURAL CONSIDERATONS
The extraction and use of Hawaii’s geothermal resources, including water and volcanic materials, requires careful
consideration of the cultural values placed on those resources and their contemporary cultural uses. The native
religion of the Hawaiian people has many deities connected to Hawaii’s natural resources, including Pele, widely
known as the goddess of fire and volcanoes. Some Native Hawaiian religion practitioners have opposed geothermal
in Hawaii for religious reasons, which is documented by a lengthy history of litigation and administrative procedures.
Conversely, some Native Hawaiian religion practitioners view geothermal as a gift to the people of Hawaii. Any new
geothermal developments in Hawaii ought to include extensive consultation with Native Hawaiians and others to
identify and discuss cultural impact considerations.
26 | DBEDT Hawaii State Energy Office |Hawaii Energy Facts & Figures, June 2018Hydropower
Hydroelectricity was the first renewable energy
technology used to generate electricity in Hawaii
– plants date back to 1888. Early hydroelectric
facilities were located in Honolulu, Hilo, and on
the island of Kauai. The Puueo Hydropower facility
on Wailuku River on Hawaii Island was originally
built in 1910 and remains operational today.
During the sugarcane era, additional hydroelectric
plants were installed to help power sugar
operations and likely contributed to a significant Wailuku River Hydroelectric Power Plant, 11 MW, Hilo, Hawaii
percentage of the area population’s overall
energy needs. The technology is fully commercial
and reliable but is limited by fluctuating water levels in Hawaii’s streams and irrigation ditches. Due to Hawaii’s
geology, run-of-the-river and run-of-the-ditch systems, which have no dams, are the prevalent hydropower
technology.
CURRENT PRODUCTION
Small home-scale plants, commercial and municipal installations, and
utility-scale hydropower facilities are currently in operation in Hawaii.
Hawaii currently has about 37 megawatts (MW) of installed
hydroelectricity capacity statewide – the largest being the 11 MW Wailuku
River plant on Hawaii Island – and about 50 MW of hydroelectric projects
proposed or under development (Hawaii Renewable Energy Projects
Directory). In 2017, hydropower accounted for 0.67% of the total energy
distributed by Hawaii’s electric utilities statewide (2017 Renewable
Portfolio Standard Status Reports). In 2017, hydro represented 6.9% of the
electricity used on Kauai in 2017 and 2.8% of the electricity used on the Hawaii County Dept. of Water Supply’s 45 kW
island of Hawaii, the two islands with the most hydropower in operation. in-line hydro plant in Kona, Hawaii
Another related technology is in-line hydro, which harvests energy within
water pipelines. For example, the Hawaii County Department of Water Supply (DWS) has three small in-line hydro
power plants which each have capacities of under 100 kilowatts (kW). These facilities capture the energy in pipes
carrying water to DWS customers in West Hawaii.
PROPOSED PRODUCTION
In October 2017, the PUC approved Hawaii Electric Light Company’s (HELCO) 2016 request to spend approximately
$6,200,000 for its proposed Waiau Hydro Repowering Project to renovate and refurbish this nearly 100 year-old
facility, which could more than double its current output. HELCO is currently seeking a 65-year water lease from the
State Board of Land and Natural Resources for the project to replace its Revocable Permit renewed through 2019,
which triggers the State environmental review process and has a watershed management plan requirement. HELCO
is also seeking an easement form the Department of Hawaiian Home Lands (DHHL) for part of its diversion
infrastructure located on DHHL lands. HELCO intends to begin work to solicit proposals for work on the Waiau Hydro
Repowering Project planned to be completed by late-2020 or early-2021, but does not intend to proceed with
construction until water rights are approved.
Kauai Island Utility Cooperative (KIUC) is seeking a long-term lease from the State (Department of Land and Natural
Resources) for its existing Waiahi hydropower units. Gay & Robinson (G&R) is currently constructing a new 6 MW
hydropower expansion facility below its existing 1.3 MW hydropower plant on the Olokele River/Makaweli Stream
watershed at the former Kaumakani Sugar Mill site. The new facility would be the first new large-scale hydropower
plant on Kauai in 80 years. The Hawaii Public Utilities Commission (PUC) approved the power purchase agreement
(PPA) between G&R and KIUC in March 2016. The plant could be operational by late 2018 or early 2019 and is
estimated to increase KIUC's renewable energy generation by about 5%.
27 | DBEDT Hawaii State Energy Office |Hawaii Energy Facts & Figures, June 2018You can also read