HC2 HOLDINGS, INC. Third Quarter 2016 Conference Call - Shareholder Forum
←
→
Page content transcription
If your browser does not render page correctly, please read the page content below

HC2 HOLDINGS, INC.
                                Third Quarter 2016
                                 Conference Call

© HC2 Holdings, Inc. 2016
Safe Harbor Disclaimers

Special Note Regarding Forward-Looking Statements. Safe Harbor Statement Under the Private Securities Litigation Reform Act of 1995: This presentation contains, and certain oral statements
made by our representatives from time to time may contain, forward-looking statements. Generally, forward-looking statements include information describing actions, events, results, strategies
and expectations and are generally identifiable by use of the words “believes,” “expects,” “intends,” “anticipates,” “plans,” “seeks,” “estimates,” “projects,” “may,” “will,” “could,” “might,” or
“continues” or similar expressions. The forward-looking statements in this presentation include without limitation statements regarding our expectation regarding building shareholder value. Such
statements are based on the beliefs and assumptions of HC2's management and the management of HC2's subsidiaries. The Company believes these judgments are reasonable, but you should
understand that these statements are not guarantees of performance or results, and the Company’s actual results could differ materially from those expressed or implied in the forward-looking
statements due to a variety of important factors, both positive and negative, that may be revised or supplemented in subsequent reports on Forms 10-K, 10-Q and 8-K. Such important factors
include, without limitation, issues related to the restatement of our financial statements; the fact that we have historically identified material weaknesses in our internal control over financial
reporting, and any inability to remediate future material weaknesses; capital market conditions; the ability of HC2's subsidiaries to generate sufficient net income and cash flows to make
upstream cash distributions; volatility in the trading price of HC2 common stock; the ability of HC2 and its subsidiaries to identify any suitable future acquisition opportunities; our ability to realize
efficiencies, cost savings, income and margin improvements, growth, economies of scale and other anticipated benefits of strategic transactions; difficulties related to the integration of
financial reporting of acquired or target businesses; difficulties completing pending and future acquisitions and dispositions; effects of litigation, indemnification claims, and other contingent
liabilities; changes in regulations and tax laws; and risks that may affect the performance of the operating subsidiaries of HC2. These risks and other important factors discussed under the
caption “Risk Factors” in our most recent Annual Report on Form 10-K filed with the Securities and Exchange Commission (“SEC”), and our other reports filed with the SEC could cause actual
results to differ materially from those indicated by the forward-looking statements made in this presentation .

You should not place undue reliance on forward-looking statements. All forward-looking statements attributable to HC2 or persons acting on its behalf are expressly qualified in their entirety by
the foregoing cautionary statements. All such statements speak only as of the date made, and HC2 undertakes no obligation to update or revise publicly any forward-looking statements,
whether as a result of new information, future events or otherwise.

Non-GAAP Financial Measures

In this presentation, HC2 refers to certain financial measures that are not presented in accordance with U.S. generally accepted accounting principles (“GAAP”), including Core Operating
Subsidiary Adjusted EBITDA, Total Adjusted EBITDA (excluding Insurance) and Insurance AOI.

Management believes that Adjusted EBITDA measures provide investors with meaningful information for gaining an understanding of certain results as it is frequently used by the financial
community to provide insight into an organization’s operating trends and facilitates comparisons between peer companies, because interest, taxes, depreciation, amortization and the other
items for which adjustments are made as noted in the definition of Adjusted EBITDA below can differ greatly between organizations as a result of differing capital structures and tax strategies.
Adjusted EBITDA can also be a useful measure of a company’s ability to service debt. In addition, management uses Adjusted EBITDA measures in evaluating certain of the Company’s
segments performance because they eliminate the effects of considerable amounts of noncash depreciation and amortization and items not within the control of the Company’s operations
managers. While management believes that these non-US GAAP measurements are useful as supplemental information, such adjusted results are not intended to replace our US GAAP financial
results and should be read together with HC2’s results reported under GAAP.

Management defines Adjusted EBITDA as Net income (loss) adjusted to exclude the impact of depreciation and amortization; (gain) loss on sale or disposal of assets; lease termination costs;
(gain) loss on early extinguishment or restructuring of debt; interest expense; other (income) expense, net; foreign currency transaction (gain) loss; income tax (benefit) expense; (gain) loss from
discontinued operations; noncontrolling interest; share-based compensation expense; acquisition and nonrecurring items; and other costs. A reconciliation of Adjusted EBITDA to Net income
(loss) is included in the financial tables at the end of this release.

Management recognizes that using Adjusted EBITDA as a performance measure has inherent limitations as an analytical tool as compared to net income (loss) or other U.S. GAAP financial
measures, as these non-GAAP measures exclude certain items, including items that are recurring in nature, which may be meaningful to investors. As a result of the exclusions, Adjusted EBITDA
should not be considered in isolation and do not purport to be alternatives to net income (loss) or other U.S. GAAP financial measures as a measure of our operating performance.

Management believes that Insurance AOI measures, used frequently in the insurance industry, provide investors with meaningful information for gaining an understanding of certain results and
provides insight into an organization’s operating trends and facilitates comparisons between peer companies.

Management defines Insurance AOI as Net income (loss) for the Insurance segment adjusted to exclude the impact of net investment gains (losses), including other-than-temporary impairment
losses recognized in operations; intercompany elimination and acquisition and non-recurring items. Management believes that Insurance AOI provides a meaningful financial metric that helps
investors understand certain results and profitability. While these adjustments are an integral part of the overall performance of the Insurance segment, market conditions impacting these items
can overshadow the underlying performance of the business. Accordingly, we believe using a measure which excludes their impact is effective in analyzing the trends of our operations.

By accepting this document, each recipient agrees to and acknowledges the foregoing terms and conditions.

                                                                       © 2 0 1 6 H C 2 H OLDINGS, I NC.                                                                                                   1
Agenda

   OVERVIEW AND
                       Philip Falcone         Chairman, President and CEO
FINANCIAL HIGHLIGHTS

                       Philip Falcone         Chairman, President and CEO

                       Michael Sena           Chief Financial Officer
     Q AND A
                       Keith Hladek           Chief Operating Officer

                       Andrew Backman         Managing Director – Investor & Public Relations

                                 © 2 0 1 6 H C 2 H OLDINGS, I NC.                               2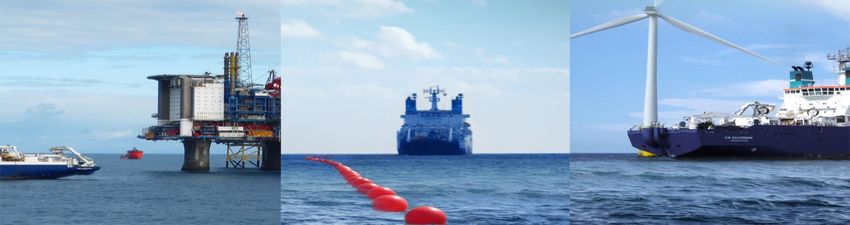
Quarterly Overview

3Q16 Highlights and Recent Developments
Results and Recent Developments
Solid third quarter results again highlight the unique value HC2 brings to
the market with our diverse holdings across a number of uncorrelated industries
– Manufacturing: Continued margin improvement; Strong backlog and deal pipeline
– Marine Services: Strong telecom and off shore power installation; Solid maintenance
performance; Joint Ventures continue to perform better than expected
– Telecommunications: Continued growth in wholesale volumes and customer expansion
– Utilities: Executing footprint expansion strategy; Increased delivery of gasoline gallon
equivalents
Adjusted EBITDA for Core Operating Subsidiaries (Manufacturing, Marine Services,
Utilities and Telecommunications segments) totaled $31.5 million in Third Quarter
– Up 16.3% from $27.1 million in second quarter 2016; Up 22.8% year-over-year
Cash and Investments as of September 30, 2016:
– $1.6 billion of consolidated cash, cash equivalents and investments, which includes the
addition of Insurance segment; essentially unchanged from prior quarter
– $93.0 million in Consolidated Cash (excluding Insurance segment)
Cumulative outstanding value of Preferred Equity reduced to $30.0 million
© 2 0 1 6 H C 2 H OLDINGS, I NC. 4
HC2 Segment Overview
Core Financial
Core Operating Subsidiaries
Services Subsidiaries
Manufacturing: Marine Services: Utilities: Telecom: Insurance:
DBM G LOBAL (SCHUFF) GMSL ANG PTG I ICS CIG
Q3 Revenue: $129.6.m Q3 Revenue: $50.7m Q3 Revenue: $1.7m Q3 Revenue: $194.4m ~$76m of statutory surplus
Q3 Adjusted EBITDA: $14.5m Q3 Adjusted EBITDA: $14.1m Q3 Adjusted EBITDA: $0.7m Q3 Adjusted EBITDA: $2.2m ~$2.1b in total GAAP assets
Backlog $318m; Over $500m Strong telecom and off shore 17 stations currently owned Continued growth in Recently began process of
inclusive of contracts power installation; Solid and / or operated wholesale traffic volumes, merging CGI and UTA into
awarded, not yet signed maintenance performance Delivered 937,000 Gasoline in part, delivered by the one legal entity; meaningful
Solid long-term pipeline Joint Ventures continue to Gallon Equivalents (GGEs) changing regulatory cost saving, lower required
perform better than in the third quarter versus environment throughout statutory capital
expected 662,000 GGEs in 3Q15 Europe, combined with Platform for growth through
religious holiday season in additional M&A
Positive long-term telecom the Middle East
installation opportunities
Early Stage and Other Holdings
Life Sciences: PANSEND Other:
BeneVir: Oncolytic viral immunotherapy for treatment of solid cancer tumors Nervve
R2 Dermatology: Medical device to brighten skin based on Mass. General Hospital technology
Genovel: Novel, patented , Mini Knee” and “Anatomical Knee” replacements
Dusenberry Martin Racing
MediBeacon: Unique non-invasive real-time monitoring of kidney function NASCAR® Heat Evolution
Triple Ring Technologies: R&D engineering company specializing in medical devices, released on
homeland security, imaging, sensors, optics, fluidics, robotics & mobile healthcare September 13, 2016
All data as of September 30, 2016
© 2 0 1 6 H C 2 H OLDINGS, I NC. 5
Segment Financial Summary

                   Adjusted EBITDA for Core Operating Subsidiaries $31.5m for Q3 2016

                                                                                          Q3 2016                            Q2 2016                           Q1 2016

                         Core Operating Subsidiaries

                              Manufacturing                                                 $14.5                              $13.2                             $11.5

                              Marine Services                                                14.1                               11.8                               0.5

                              Utilities                                                       0.7                                0.5                               0.4

                              Telecom                                                         2.2                                1.5                               0.3
       A DJUSTED
       EBITDA                 Total Core Operating                                          $31.5                              $27.1                             $12.7
         ($m)
                         Early Stage and Other Holdings

                              Life Sciences                                                  (2.9)                             (2.7)                              (2.6)

                              Other                                                          (4.8)                             (3.3)                              (4.0)

                              Total Early Stage and Other                                    (7.7)                             (6.0)                              (6.6)

                         Non-Operating Corporate                                             (5.5)                             (5.9)                              (5.7)

                         Total HC2 (excluding Insurance)                                    $18.2                              $15.2                              $0.3

      A DJUSTED          Core Financial Services
      O PERATING
       I NCOME           Insurance
         ($m)                                                                               ($1.7)                             ($4.7)                            ($2.6)
                         (2Q16 Inclusive of $5.3m non-cash tax charge)

Note: Reconciliations of Adjusted EBITDA and Adjusted Operating Income to U.S. GAAP Net Income in appendix. Table may not foot due to rounding. Adjusted Operating
Income for Q1 2016 has been adjusted to exclude certain intercompany eliminations to better reflect the results of the Insurance segment, and remain consistent with
internally reported metrics. Additional details in appendix.

                                                                     © 2 0 1 6 H C 2 H OLDINGS, I NC.                                                                     6
Manufacturing: DBM Global Inc. (Schuff)

Third Quarter Update

   Net Income: $7.0m versus $9.4m for the second quarter 2016
   Adjusted EBITDA: $14.5m versus $13.2m in the second quarter 2016
   Continued strong gross margins due to better than bid performance - Pacific region remains strong
   Backlog $318m; Over $500m inclusive of contracts awarded, not yet signed
   Announced accretive acquisitions of PDC Global Detailing and Building Information Modeling Business and BDS VirCon

Strategic Initiatives

   Proactively selecting profitable, strategic and “core competency” jobs, not all jobs
   Solid long-term pipeline of prospective projects; No shortage of transactions to evaluate
   Commercial / Stadium / Healthcare sectors remain strong
   Opportunities to add higher margin, value added services to overall product offering

The Cosmopolitan of Las Vegas             Mile High Stadium                                    U.S. Steel

                                            © 2 0 1 6 H C 2 H OLDINGS, I NC.                                            7
Marine Services: GMSL
Third Quarter Update
Net Income: $8.7m versus $6.0m for the second quarter 2016
Adjusted EBITDA: $14.1m versus $11.8m in the second quarter 2016 and $0.5m in the first quarter 2016
Strong telecom and off shore power install revenues in third quarter
Continued solid performance from maintenance business, including revenue contributions from CWind acquisition
Joint ventures continue to perform better than expected
Acquired remaining interest in CWind subsequent to quarter-end; Currently own 100% of CWind
Strategic Initiatives
Huawei Marine Networks – 49% ownership S. B. Submarine Systems (SBSS – China Telecom) – 49% ownership
– Joint Venture established in 1995 with China Telecom
Total HMN* 2015 2014
– China’s leading provider of submarine cable installation
Revenue ~$188m ~$73m – Located in Shanghai and possesses a fleet of advanced purpose-built
Profit ~$14m ~$1.2m cable ships
Cash / Equivalents ~$26m ~$16m
Source: Huawei Investment & Holding Co., Ltd – 2015 Annual Report Currency Exchange: CNY:USD 1:0.15
© 2 0 1 6 H C 2 H OLDINGS, I NC. 8
Utilities: ANG
Third Quarter Update
Net Income: $0.03m versus $0.07m for the second quarter 2016
Adjusted EBITDA: $0.73m versus $0.54m in the second quarter 2016
Delivered 937,000 Gasoline Gallon Equivalents (GGEs) in the third quarter versus 848,000 GGEs in the second
quarter of 2016 and 800,000 GGEs in the first quarter of 2015, and 662,000 in the year-ago quarter
17 stations currently owned and / or operated
Commissioned fueling stations in Saratoga Springs and Rochester, New York during third quarter
Acquired a station in Searcy, Arkansas with long-term fueling agreement during third quarter
Continue to expand fueling station footprint via organic and M&A opportunities
© 2 0 1 6 H C 2 H OLDINGS, I NC. 9Telecommunications: PTGi-ICS
Third Quarter Update
Strong quarterly results due to continued growth in wholesale traffic volumes, in part delivered by the
changing regulatory environment throughout the European market combined with the religious holidays
in the Middle East region, resulting in increased traffic and margin.
– Net Income: $1.8m versus $1.0m for the second quarter 2016
– Adjusted EBITDA continues positive trend as the overall business continues to mature post restructuring
– Adjusted EBITDA for third quarter 2016 of $2.2m vs. $1.5m in the prior quarter
– 6th consecutive quarter of positive Adjusted EBITDA
One of the key objectives: leverage the infrastructure and management expertise within PTGI-ICS
– Over 800+ wholesale interconnections globally provides HC2 the opportunity to leverage the existing cost effective
infrastructure by bolting on higher margin products and M&A opportunities
– A focused strategic initiative has been launched within PTGI-ICS to identify potential M&A opportunities
© 2 0 1 6 H C 2 H OLDINGS, I NC. 10Insurance: Continental Insurance Group
Third Quarter Update
Continental Insurance, Inc. (CII) serves as a platform for run-off LTC books of business and for acquiring
additional run-off LTC businesses
– Net Loss: ($2.2)m versus ($2.3)m for the second quarter 2016
– Adjusted Operating Income: ($1.7)m
– ~$76m of statutory surplus at end of third quarter
– ~$2.1b in total GAAP assets at September 30, 2016
– ~$20.0m premiums for third quarter 2016
CII Strategy:
– A concentrated focus on LTC and acquisitions of additional books of run-off LTC business
– A platform to provide a vehicle for multi-line insurers who do not consider LTC a core business segment to exit
the market
– Enhancing efficiency and effectiveness through scale and a concentrated focus on LTC
Note: Reconciliation of Adjusted Operating Income to U.S. GAAP Net Income in appendix.
© 2 0 1 6 H C 2 H OLDINGS, I NC. 11Pansend Life Sciences
HC2’s Life Sciences Segment Is Focused on the Development
of Innovative Healthcare Technologies and Products
80% equity ownership of company focused on immunotherapy; Oncolytic virotherapy for treatment of solid
cancer tumors
Founded by Dr. Matthew Mulvey & Dr. Ian Mohr (who co-developed T-Vec); Biovex (owner of T-Vec) acquired by
Amgen for ~$1billion
Benevir’s T-Stealth is a second generation oncolytic virus with new features and new intellectual property
BeneVir holds exclusive worldwide license to develop BV-2711 (T-Stealth)
61% equity ownership of dermatology company focused on lightening and brightening skin
Founded by Pansend in partnership with Mass. General Hospital and inventors Drs. Rox Anderson, Dieter Manstein
and Henry Chan
Over $10 billion global market
77% equity ownership in company with unique knee replacements based on technology from Dr. Peter Walker,
NYU Dept. of Orthopedic Surgery and one of the pioneers of the original Total Knee
“Mini-Knee” for early osteoarthritis of the knee
“Anatomical Knee” – A Novel Total Knee Replacement
Strong patent portfolio
35% equity ownership in company with unique technology and device for monitoring of real-time kidney function
Current standard diagnostic tests measure kidney function are often inaccurate and not real-time
MediBeacon’s Optical Renal Function Monitor will be first and only, non-invasive system to enable real-time, direct
monitoring of renal function at point-of-care
$3.5 billion potential market
Profitable technology and product development company
Areas of expertise include medical devices , homeland security, imaging systems, sensors, optics, fluidics, robotics
and mobile healthcare
Located in Silicon Valley and Boston area with over 90,000 square feet of working laboratory and incubator space
Contract R&D market growing rapidly
Customers include Fortune 500 companies and start-ups
© 2 0 1 6 H C 2 H OLDINGS, I NC. 12Other Non-Core Investments
Nervve
Provider of video and image search technology for
information extraction and powerful analytics applications
Dusenberry Martin Racing
Owns worldwide exclusive licensing rights to NASCAR®
simulation style racing titles on interactive entertainment
platforms including PlayStation 4, Xbox One, PC and mobile games
NASCAR® Heat Evolution Successfully Released on September 13, 2016
© 2 0 1 6 H C 2 H OLDINGS, I NC. 13Notable Financial Updates
Collateral Coverage Ratio at quarter end exceeded 2.0x
$93.0 million in Consolidated Cash (excluding Insurance segment)
– $29.4 million Corporate Cash
Cumulative outstanding value of Preferred Equity reduced to $30.0 million
($m) B ALANCE S HEET ( AT S EPTEMBER 30, 2016)
Market Cap(1) $161.4
Preferred Equity $42.7
Total Debt $307.0
Corporate Cash(2) $29.4
Enterprise Value(3) $481.7
(1) Market capitalization on a fully diluted basis, excluding preferred equity, using a common stock price per share of $3.86 and shares outstanding of 41.8 million on November 8, 2016
(2) Cash and cash equivalents
(3) Enterprise Value is calculated by adding market capitalization, total preferred equity and total debt amounts, less Corporate cash
© 2 0 1 6 H C 2 H OLDINGS, I NC. 14Questions and Answers
Appendix:
Reconciliations
Reconciliation of Adjusted EBITDA of HC2 to U.S. GAAP Net Income (Loss)
  Three Months Ended September 30, 2016

                                                                                                                                                                    (in thousands)

                                                                                  Three Months Ended September 30, 2016
                                                                                                                                            Non-
                                                                   Marine                                    Life         Other and       operating
                                                  Manufacturing    Services     Telecom      Utilities     Sciences      Eliminations     Corporate      HC2**

  Net loss attributable to HC2 Holdings, Inc.     $      6,962 $      8,696 $      1,796 $          27 $     (2,285) $        (8,160) $      (9,404) $    (2,368)
  Adjustments to reconcile net income (loss) to
  Adjusted EBITDA:
   Depreciation and amortization *                         431        5,225         144            582           32              380              4        6,798
   Depreciation and amortization (included in
   cost of revenue)                                      1,321           —           —              —            —                —              —         1,321
   Gain on sale or disposal of assets                      (23)          —           —              —            —                —             —            (23)
   Lease termination costs                                  —            —         (159)            —            —                —             —           (159)
   Interest expense                                        304        1,328          —             119           —                —          8,969        10,720
   Other (income) expense, net                             (12)      (2,013)        422            (24)          (2)           3,892           835         3,098
   Foreign currency (gain) loss (included in
   cost of revenue)                                         —          (283)         —              —            —                —              —          (283)
   Income tax (benefit) expense                          4,672           96          —              —            —                —          (7,851)      (3,083)
   Noncontrolling interest                                 411          465          —              27         (770)            (974)            —          (841)
   Share-based compensation expense                         —           546          —               3          128               37          1,088        1,802
   Acquisition and nonrecurring items                      429           —           —              —            —                —             821        1,250
   Adjusted EBITDA                                $     14,495 $    14,060 $       2,203 $         734 $     (2,897) $        (4,825) $      (5,538) $    18,232

(*) Includes depreciation adjustments from purchase accounting.
(**) Excludes net loss from Insurance segment in the amount of $2.2 million for the three months ended September 30, 2016.

                                                      © 2 0 1 6 H C 2 H OLDINGS, I NC.                                                                                               17
Reconciliation of Adjusted EBITDA of HC2 to U.S. GAAP Net Income (Loss)
Three Months Ended September 30, 2015
(in thousands)
Three Months Ended September 30, 2015
Non-
Marine Life Other and operating
Manufacturing Services Telecom Utilities Sciences Eliminations Corporate HC2**
Net loss attributable to HC2 Holdings, Inc. $ 7,116 $ 7,356 $ (362) $ (82) $ (1,575) $ 1,525 $ (21,804) $ (7,826)
Adjustments to reconcile net income (loss) to
Adjusted EBITDA:
Depreciation and amortization * 513 4,376 98 411 6 480 — 5,884
Depreciation and amortization (included in
cost of revenue) 1,928 — — — — — — 1,928
Gain on sale or disposal of assets (990) (117) — — — — — (1,107)
Lease termination costs — — 1,124 — — — — 1,124
Interest expense 354 929 — 10 — (1) 9,090 10,382
Other (income) expense, net (141) (1,149) (162) (19) — 280 — (1,191)
Foreign currency (gain) loss (included in
cost of revenue) — (1,739) — — — — — (1,739)
Income tax (benefit) expense 5,284 260 — — — (6,359) 2,318 1,503
Loss from discontinued operations — — — — — 24 — 24
Noncontrolling interest 383 204 — (73) (449) — — 65
Share-based compensation expense — — — 20 — 1 2,323 2,344
Acquisition and nonrecurring items — — — — — — 2,733 2,733
Other costs — — 109 — — — — 109
Adjusted EBITDA $ 14,447 $ 10,120 $ 807 $ 267 $ (2,018) $ (4,050) $ (5,340) $ 14,233
(*) Includes depreciation adjustments from purchase accounting.
(**) Excludes net loss from Insurance segment in the amount of $0.2 million for the three months ended September 30, 2015.
© 2 0 1 6 H C 2 H OLDINGS, I NC. 18Reconciliation of Adjusted EBITDA of HC2 to U.S. GAAP Net Income (Loss)
Three Months Ended June 30, 2016
(in thousands)
Three Months Ended June 30, 2016
Non-
Marine Life Other and operating
Manufacturing Services Telecom Utilities Sciences Eliminations Corporate HC2**
Net income (loss) $ 9,364 $ 6,002 $ 1,009 $ 68 $ (2,004) $ (2,608) $ (7,603) $ 4,228
Adjustments to reconcile net income (loss) to
Adjusted EBITDA:
Depreciation and amortization 303 5,725 140 468 36 336 — 7,008
Depreciation and amortization (included in
cost of revenue)* (206) — — — — — — (206)
(Gain) loss on sale or disposal of assets (1,845) 7 — — — 1 — (1,837)
Lease termination costs — — 338 — — — — 338
Interest expense 303 1,285 — 14 — 1 8,966 10,569
Other (income) expense, net (32) 211 29 (344) — (10) 465 319
Foreign currency (gain) loss (included in
cost of revenue) — (1,540) — — — — — (1,540)
Income tax (benefit) expense 4,524 (212) — — — 1 (9,404) (5,091)
Noncontrolling interest 768 200 — 244 (812) (1,044) — (644)
Share-based payment expense — 152 — 90 34 40 1,359 1,675
Acquisition and nonrecurring items — — 18 — — 313 331
Adjusted EBITDA $ 13,179 $ 11,830 $ 1,534 $ 540 $ (2,746) $ (3,283) $ (5,904) $ 15,150
(**) Excludes net loss from Insurance segment in the amount of $2.3 million for the three months ended June 30, 2016.
© 2 0 1 6 H C 2 H OLDINGS, I NC. 19Reconciliation of Adjusted EBITDA of HC2 to U.S. GAAP Net Income (Loss)
Three Months Ended March 31, 2016
(in thousands)
Three Months Ended March 31, 2016
Core Operating Early Stage & Other Non-
operating HC2**
Manufactu Marine Total Core Life Other and
Corporate
ring Services Telecom Utilities Operating Sciences Eliminations
Net income (loss) $ 4,384 $ (5,918) $ 1,202 $ (27) $ (359) $ 1,298 $ (10,494) $ (13,409) $ (22,966)
Adjustments to reconcile net income
(loss) to Adjusted EBITDA:
Depreciation and amortization 529 4,797 106 429 5,861 19 336 — 6,216
Depreciation and amortization
(included in cost of revenue) 1,933 — — — 1,933 — — — 1,933
(Gain) loss on sale or disposal of
assets 904 (17) — — 887 — — — 887
Interest expense 310 1,070 — 9 1,389 — — 8,937 10,326
Other (income) expense, net (44) 612 (1,025) (31) (488) (3,221) 6,006 (1,611) 687
Foreign currency (gain) loss
(included in cost of revenue) — (147) — — (147) — — — (147)
Income tax (benefit) expense 3,445 (640) — — 2,805 — — (4,226) (1,422)
Noncontrolling interest 61 (155) — (22) (116) (720) (44) — (880)
Share-based payment expense — 609 — 14 623 22 159 2,386 3,191
Acquisition and nonrecurring items — 266 — 27 293 — 2,201 2,494
Adjusted EBITDA $ 11,522 $ 477 $ 283 $ 399 $ 12,681 $ (2,602) $ (4,037) $ (5,722) $ 319
(**) Excludes net loss from Insurance segment in the amount of $7.5 million for the three months ended March 31, 2016.
© 2 0 1 6 H C 2 H OLDINGS, I NC. 20Reconciliation of Insurance AOI to U.S. GAAP Net Income (Loss)
Three Months Ended September 30, June 30 and March 31, 2016
(in thousands)
Three Months Ended Three Months Ended Three Months Ended
September 30, June 30, March 31,
2016 2016 2016
Net loss - Insurance Segment $ (2,189) $ (2,293) $ (7,496)
Effect of investment (gains) losses 220 (2,418) 4,875
Acquisition and non-recurring items 269 — —
Insurance AOI $ (1,700) $ (4,711) $ (2,621)
The calculation of Insurance Net Loss has been revised to exclude adjustments for intercompany eliminations as they are not considered relevant in evaluating the performance of our
Insurance segment. For first quarter 2016, this resulted in a change to the previously reported Insurance loss of ($12.3) million for the quarter to a loss of ($7.5) million.
The calculation of Insurance AOI has been revised to exclude adjustments for intercompany eliminations as they are not considered relevant in evaluating the performance of our
Insurance segment. For first quarter 2016, this resulted in a change to the previously reported Insurance AOI loss of ($3.6) million for the quarter to a loss of ($2.6) million.
© 2 0 1 6 H C 2 H OLDINGS, I NC. 21HC2 HOLDINGS, INC. A n d r e w G . B a c k m a n • i r @ h c 2 . c o m • 2 1 2 . 2 3 5 . 2 6 9 1 • 4 5 0 P a r k A v e n u e , 3 0 th F l o o r , N e w Y o r k , N Y 1 0 0 2 2 © HC2 Holdings, Inc. 2016
You can also read