Health and wellbeing in Brighton & Hove
←
→
Page content transcription
If your browser does not render page correctly, please read the page content below
Health and wellbeing in Brighton & Hove
        Joint Strategic Needs Assessment (JSNA) Executive Summary
                                                     March 2021

NEEDS ASSESSMENTS | BH Connected
Community Insight | Reports | Surveys | Needs Assessments | Performance
http://www.bhconnected.org.uk/content/needs-assessments
Health and wellbeing in Brighton & Hove
JSNA Executive Summary Key to the summary
The Brighton & Hove Health and Wellbeing Board is required to Throughout the summary (with the exception of the
produce a Joint Strategic Needs Assessment (JSNA). The JSNA population page) the colours within charts and icons are
provides a description of the current and future health, social based upon whether Brighton & Hove is statistically
care and wellbeing needs of the local population, and does so by significantly lower / higher or better / worse than
collating a variety of evidence, including information from England (where this judgement can be made):
existing in-depth needs assessments; health and social care data
Significantly lower than England
and local views and experiences.
Not significantly different to England
The JSNA is used to identify local health and wellbeing issues
and inform the commissioning and delivery of local services. This Significantly higher than England
summary gives a snapshot of health and wellbeing in the city. It
will be updated every three months in line with Public Health Significantly better than England
Outcomes Framework updates. See the full set of JSNA resources
http://www.bhconnected.org.uk/content/needs-assessments Not significantly different to England
For the latest information on Covid please visit : Significantly worse than England
Covid-19 key statistics for Brighton & Hove (brighton-
hove.gov.uk) Significance cannot be calculated
Produced by: Public Health Intelligence Team, Brighton & Hove
Where trend data is available, clicking on the icons in
City Council
the summary links directly to this information.
For more information: kate.gilchrist@brighton-hove.gov.ukKEY ISSUES FOR BRIGHTON & HOVE
A range of evidence has been collated for the JSNA to inform the key issues for the city presented here, including information
gained from in-depth needs assessments, data from public health, NHS and social care outcomes frameworks.
Issues highlighted are those where we are significantly worse than England (or comparator local authorities), where large
numbers or people are impacted, or where we have significant inequalities:
All ages Starting well Living well Ageing well Dying well
Housing
Homelessness and rough
Child poverty
sleeping Unemployment
Education Fuel poverty
Wider determinants Tobacco control Good employment and
Adverse Childhood Events Income deprivation
Road safety healthy workplaces
(ACEs)
Active travel
Crime and safety
Risk taking behaviours and
Domestic and sexual
the clustering of these Smoking
violence
behaviours: Alcohol and drugs misuse
Physical activity, healthy
Smoking Sexual health (STIs and Social isolation /
Lifestyles / prevention weight
Drugs HIV/AIDS) loneliness
Food poverty and good
Alcohol Suicide prevention and
nutrition
Sexual health self-harm
Emotional wellbeing
Emotional wellbeing
Multiple long-term
physical and mental
health conditions
Mental health Children in care Dementia
Cancer (and cancer
Physical disability and Emotional wellbeing and Multiple long-term Support for dying in place
Services / support screening)
impairment mental ill health support conditions of preference
Heart disease and stroke
Learning disabilities Immunisation Immunisation
Musculoskeletal
conditions
Mental health
Download dataPEOPLE Projections There are projected to be 12,100 more people
Population living in the city by 2030 (compared with 2019,
an 4% increase to 303,000 people).
290,900 The city’s population is predicted to get
residents (2019) older, with the greatest projected increases by broad
age band in the 60-69 years (34%, 7,700 extra people)
21% Under 20 (24% Eng) and 80-84 years (34%, 1,800 extra people).
62% 20-59 (52% Eng) Of note, there are projected to be 400 (11%) more 85-
89 year olds and 300 (12%) more 90+ year olds.
11% 60-74 (15% Eng)
6% 75+ (8% Eng) 1995
2000
Our population profile is younger than England 2005
Brighton & Hove England 2010
Year
2015
2020
2025
2030
50k 100k 150k 200k 250k 300k
Population (thousands)
0-19 20-59 60-74 75+
Download dataPEOPLE
Population groups
Our city consists of different One in five people (19.5%) are Our best estimate of
population groups living in a from a Black or Minority Ethnic lesbian, gay and
Group (14.5% South East, 20.2%
range of geographical bisexual residents is
England)
communities. 11% to 15% of the
population aged 16+
The large student and lesbian,
% 49,000 residents were
gay, bisexual and trans (LGBT)
communities are key born outside of the UK
17% of the city‘s population in
characteristics of the city’s
the year ending June 2020.
population profile.
Between 1,500 and Higher than the South East
(13%) and England (15%)
The most up to date data and 2,500 trans
our best estimates show: adults live in 49% of residents have a
Brighton & Hove, with
religion, lower than the
many more who visit
South East (65%) and England
to socialise, study
(68%)
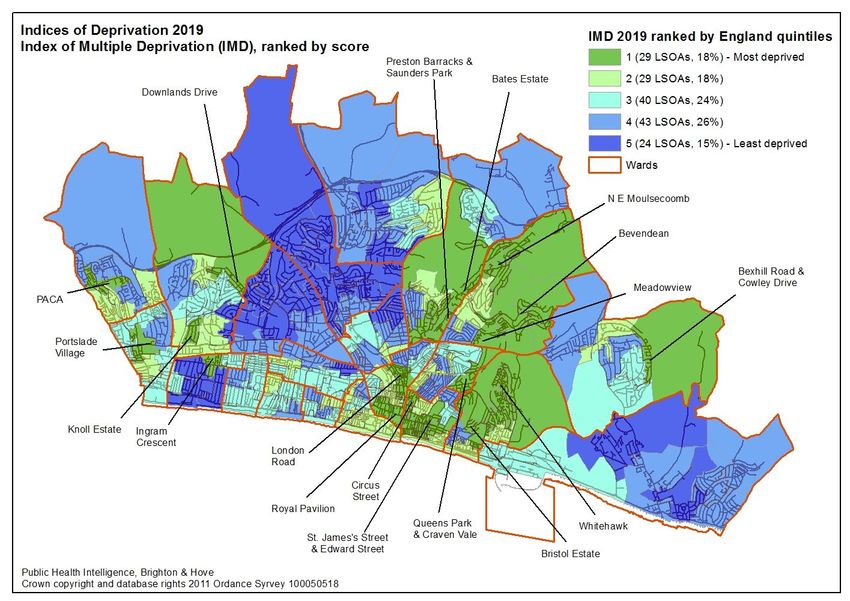
and/or workPLACE In 2019, 17% of the population of the city lived in the 20%
most deprived areas in England and 13% in the 20% least
Deprivation
deprived areas: Brighton & Hove
131st
Our city is the
according to the
2019 Index of most deprived
local authority in England
Multiple England (of 317)
Deprivation (IMD)
1 (most deprived) 2 3 4 5 (least deprived)
Some areas are more affected by deprivation
than others. The highest concentration of
deprivation is in the Whitehawk,
Moulsecoomb, and Hollingbury areas. Along
the coast, to the west of the city and in
Woodingdean there are also pockets of
deprivation. All these areas are in the 20%
most deprived areas in EnglandPLACE
Our health and wellbeing is Air pollution Community resilience
influenced by a wide range of Brighton & Hove has a strong
social, economic and 5.3% of adult mortality (30+) is community with higher rates of
environmental factors: attributable to particulate air belonging, pulling together, formal
pollution (2018) volunteering and feeling that people
Housing and (5.2% South East, 5.1% England) from different backgrounds get on to
homelessness England (City Tracker survey results
11% (14,575 people Road safety 2018):
100
estimated to be in fuel 57 per 100,000 people killed
poverty (2018) (10% England) or seriously injured on the roads 80
in the city (2016-2018) (43 England)
those on the lowest 25%
60
of earnings need 12
%
Community safety
times their earning 40
to afford the lowest 25% 38 per 100,000 people
20
of house prices (2019) admitted to hospital due to
violent crime (incl. sexual
64 rough sleepers 0
assault) (2017/18 to 2019/20)
(Street count 2018)
Pu ng g
ge d
En h e r
lu d
En eer
Ge d
En on
d
n
ll la n
Vo lan
an
an
(46 per 100,000 England)
lo
nt
t
t
gl
gl
g
Be
to
ESTARTING WELL Our children and young people's
wellbeing is influenced by a wide
range of social, economic and
Child poverty
Population
environmental factors:
16% of children
The number of 0-24 year olds is live in poverty %
projected to increase by 6% (5,600) 13% South East, 17%
between 2019 and 2030, from Children in care England (2016)
74 per 10,000 children
93,700 to 99,300 children and young Youth unemployment
and young people in
people 4.6% 16-17 year olds not
The biggest % increase is expected in
care. 53 South East, 67
in education,
England (31 March 2020)
15 to 24 year olds, (16%, 8,100 people ) employment or training
5.5% England (2018)
School readiness
72% achieving a good Disabilities and
2019
level of development at end
sensory impairments
Year
of reception. (75% South East
There are 2,153 children and
2030
72% England (2019)
Education young people with a disability or
20K 40K 60K 80K
Educational progress impairment on the local register
Population (thousands)
pupils make between (2019/20)
primary and secondary It is estimated that there up to 600
0-4 5-9 10-14 15-19
schools is in line with
children and young people with Autistic
20-24
the England average
Spectrum Conditions living in the city
Download data (2018/19)STARTING WELL Healthy weight
79% of 4-5 year olds are a
We do well in many areas: fewer mothers smoke, more healthy weight -2018/19
(England 76%)
breastfeed and more children are a healthy weight
73% of 10-11 year olds a healthy
weight - 2018/19 (England 64%)
However, we have worse rates of smoking, drinking and
drugs use and poorer emotional wellbeing impacting However, it is estimated that 14,000 children and
young people’s current & future wellbeing young people in the city are overweight or obese
Maternal & infant health Young people Emotional wellbeing
88% breastfeeding by 48 hours We have the highest % of 15 yr olds who 519 per 100,000
75% England (2016/17) smoke, have tried cannabis and the 3rd 10-24 yr olds admitted
highest drinking weekly in England (2014) to hospital for self-harm
6% smoking at delivery and high Sexually Transmitted Infection (2018/19)
10% South East and England (2019/20) (STI) rates in young people (444 per 100,000 England)
17% of 14-16 yr olds
Most childhood immunisations, say they often /
including MMR at five years sometimes have
%
(2018/19), are below the 95% suicidal thoughts and
required for population protection 15% 8% 24% 11% 11% 6% 10% say that they
Under 18 conceptions 13 per often / sometimes hurt
H
d
H
d
H
d
an
an
an
B&
B&
B&
gl
gl
gl
1,000 (2018) or harm themselves
En
En
En
(17 per 1,000 England) (2018)LIVING WELL
Population Employment and work Healthy life expectancy
The number of 20-64 year olds is Getting people into, and remaining Whilst life expectancy has been
projected to increase by 2% (4,000) in, good work is a priority for increasing, healthy life expectancy
2019 to 2030 from 192,300 to physical and mental health has not in recent years. People are
196,300 people living longer in ill health. This,
4.1% (6,800 people are
The biggest % increase is expected in alongside the rising retirement age,
unemployed (Oct 19-Sept 20)
60-64 year olds (32%, 4,000 people), but means increasing numbers of people
falls in 45-54 year olds (14%, 5,700) of working age are living in ill-health.
Employment rates are lower for those
with: long-term conditions; a learning
Male Female
2019
disability; and those in contact with
Life expectancy (2017-19)
secondary mental health services
Year
2030
(2018/19) 79.1 83.2
40K 80K 120K 160K
4% of 16-64 year olds years years
Population (thousands) are out of work due to Healthy life expectancy (2016-18)
long-term sickness (Oct
64.8 65.9
20-24 25-29 30-34 35-39 2018 to Sept 2019)
years years
40-44 45-49 50-54 55-59
£496 the median gross There are large differences in both life
60-64 weekly earnings in pounds expectancy and healthy life
Download data (2020 Provisional) expectancy across the cityLIVING WELL
Lifestyles Emotional health
Some lifestyle behaviours can
17.5% of adults are current
Brighton & Hove has higher than
smokers (2019)
have a negative impact on our average levels of mental health
health. Smoking, alcohol & 488 per 100,000 people issues and suicides
drug misuse, and sexual had alcohol specific hospital 12% of adults are on GP
health are significant issues in admissions in 2018/19 practice depression
the city registers and 1.2% severe
10.0 adults per 1,000 aged 15- mental illness (2019/20)
64 estimated to use opiates and
/or crack cocaine (2016/17) 14 per 100,000 suicide &
We have the highest rates of new undetermined injury deaths (2017-19),
STI diagnosis and HIV prevalence the 4th highest rate in England
(2018) outside of London 20
Rate per 100,000
15
76% of adults are physically
However, we have more 10
active and 15% inactive
physically active residents and 5
(2018/19) 0
fewer obese/overweight adults
16% of adults cycle at least
-…
-…
-…
-…
-…
-…
-…
-…
-…
07
17
01
03
05
09
11
13
15
20
20
once a week, for leisure (7%)
20
20
20
20
20
20
20
and or travel (11%) (2018/19) Brighton & Hove EnglandLIVING WELL
Long-term conditions Global burden of disease Healthy life expectancy
There are over Locally, conditions with the Whilst life expectancy has been
50,900 adults greatest burden (2017) are: increasing, healthy life expectancy
has not in recent years. People are
(22%) aged 20+ with
therefore living longer in ill health. This,
two or more long-term Cancers alongside the rising retirement age,
physical or mental health
means increasing numbers of people of
conditions in the city -
Musculoskeletal conditions working age are living in ill-health.
with a strong link with
deprivation (54% with Male Female
Heart conditions Life expectancy (2017-19)
one or more condition)
18,500 (8% of adults) 79.1 83.2
Neurological conditions
have mental and physical years years
(including dementia)
health conditions Healthy life expectancy (2016-18)
Without scaling up Mental health
prevention, there will be
64.8 65.9
years years
over 10,500 more Cancer screening
There are large differences in both
adults with two or more Screening rates for breast,
cervical and bowel cancer are all life expectancy and healthy life
conditions by 2030
lower than England (2020) expectancy across the cityAGEING WELL
Population Life expectancy at 65 Social care
The number of 65+ year olds is
Life expectancy at 65 is similar to 64% of those surveyed
projected to increase by 20% (7,600)
England for females but worse receiving adult social care
from 38,800 to 46,400 people
than England for males (2017-19) had good quality of life
between 2019 and 2030 (2019/20)
The biggest % increase is expected in 80- 18.4 21.1
84 years (34%, 1,800 more people). There Similar carer quality of life
years years
are projected to be 400 (11%) more 85-89 to England (2019/20)
Male Female
year olds and 300 (12%) more 90+ year
olds
Social isolation
2019
Brighton & Hove has a relatively 41% of people aged 65+
Year
2030
large proportion of older people live alone according to the
10K 20K 30K 40K
living alone and a higher 2011 Census
Population (thousands) percentage of older people who
are income deprived 18.7% of older people
65-69 70-74 75-79 80-84 are income deprived
(2019)
85-89 90+
Download dataAGEING WELL DYING WELL
We have similar rates of diagnosed dementia in older people, Place of death
but higher rates of age-related macular degeneration
The majority of people would
(preventable sight loss), falls and hip fractures. Immunisation
prefer to die at home. In half
for flu in those aged 65+ is also worse than England.
of all deaths (51%), the
4.2% of 65+ yr 94 in every 100,000 65+ place of death is the place of
olds have a record year olds have age-related usual residence (2017)
of dementia macular degeneration This is above England and has
(2020) (preventable sight loss) increased from 40% in 2006
Flu immunisation (2018/19)
There were 5% more deaths of
Flu immunisation uptake at 67.9% in 65+ year olds 85+ year olds in winter in the
(2019/20) is below the goal of 75% (England 72.4%) period August 2018 to July 2019 than
would be expected if the rates were the
Falls and hip fractures same as non-winter months
2,415 per 100,000 people aged 65+ were
admitted as an emergency to hospital due to a fall-
2019/20 (England 2,222) NEEDS ASSESSMENTS | BH Connected
and 597 per 100,000 people aged 65+ had a Community Insight | Reports | Surveys | Needs
Assessments | Performance
hip fracture-2019/20 (England 572) http://www.bhconnected.org.uk/content/needs-assessmentsYou can also read