Health Care is a Knowledge Industry, and Should Be More So
←
→
Page content transcription
If your browser does not render page correctly, please read the page content below
Health Care is a Knowledge
            Industry, and Should Be
            More So

Michael Wolfson1
University of Ottawa

Introduction
WHEN WE THINK OF HEALTH CARE IN CANADA, we likely think of surgery,
pills, and visiting the doctor. While the pills and surgical procedures are tan-
gible and physical, a very large portion of activity in health care involves
knowledge, not primarily goods and tangible services.2 The knowledge pro-
cesses start with the doctor asking about a patient’s health history, symptoms
and problems, then offering a diagnosis and proposing a course of action to

1   I would like to acknowledge the very helpful comments of John Wright, Jenni-
    fer Zelmer and the editors. I of course remain responsible for any errors or
    infelicities.
2   While the hoopla seems to have died down, economists have noted the
    transitions underway, usually associated with the revolution in information
    and communications technologies, from primarily a goods and tangible
    services economy to a “knowledge economy.” Discussion of this transition was
    apparently first popularized by Peter Drucker in 1959 who emphasized the
    distinction between manual workers and knowledge workers. Health care is
    quintessentially a knowledge industry in this sense.

           New Directions for Intelligent Government in Canada                     249
cure, or at least ameliorate, any problems. In the direct experiences of patients, a great deal of their interactions with health care providers is knowledge flows. As a society, we train and value health care professionals at least as much for their knowledge and information processing capabilities – observing, assessing, recalling, recognizing patterns, accessing accumulated knowledge, judging, and deciding – as for their tangible skills such as operat- ing a diagnostic imaging device, inserting a breathing tube, and performing surgery. Similarly, at the level of health care provider organizations, a great deal of activity involves the creation, collection, and application of knowledge – though as argued below, nowhere near enough. Of course, at the organization level, there are familiar tangible activities such as hospitals providing beds and clean laundry, housing and maintaining diagnostic imaging devices, and food preparation. But we also see sequences of physicians consulting patient charts, conferring with colleagues on the most appropriate diagnosis, ordering meds, and spending hours per week keeping up to date on the latest research results published in the academic literature. Even in hospital nursing, which would appear to be an entirely physical and social interaction with patients, up to two hours in every eight hour shift may be spent in writing and consulting (still most often paper) patient charts. Furthermore, there is growing concern, given increasing specialization and division of labour, with the “continuity of care,” as patients’ trajectories of care, especially those with complex comorbidities, involve a sequence of health care encounters often with a diversity of providers. There should be major transfers of knowledge between and among these providers and with the patient when they move from a specialist visit, to hospital, to home, with GP (general practitioner) follow-up or home care, to nursing home. As the patient is “handed off” from one provider to the next, it is fundamental that each pro- vider should have all the necessary and cumulative knowledge about the patient’s diagnoses, treatments received, and current functional status. Patients as well need to know about what is happening and the course of care as it is planned for them – indeed they should have a real say in their treat- ments. 250 New Directions for Intelligent Government in Canada
However, Canada’s health system continues its failure to accord sufficient
priority and systematic thinking to these knowledge aspects, not only at the
individual physician level, but even more importantly at various levels of orga-
nization, from hospital to health region to province. As a result, no one really
knows how effective most activity in health care is, what the many components
of health care service provision actually cost, and where the system can be
modified both to reduce costs, improve quality of care, and ultimately improve
population health. In case this last sentence slipped by the reader too
smoothly, let me repeat: no one really knows how effective most activity in
health care is.
  While investments in more coherent information and knowledge creation
systems have recently accelerated, Canada’s health care (non)system remains
decades behind best practice in other sectors, like banking and airlines, and
other healthcare systems, such as the Veterans Administration in the United
States. Your car dealer often knows more about the repair and maintenance
history of your car than your doctor does about your medical history, and cer-
tainly more than the healthcare system more generally (e.g. hospitals, special-
ists, ERs) knows – as evidenced by the almost continual need for an attending
physician to ask about your medical history.
  In this chapter, we document a number of areas where these lacunae are
especially troublesome. Drawing on the limited data available we first con-
sider the implications of “post code medicine,” where your location has a
strong but seemingly random and certainly unexplained impact on your health
care, and then data on what is driving health care costs. We then turn to sug-
gestions on how best to improve this situation and close with a vision for a
proper health information system – indeed one which was articulated almost a
decade ago.

Consider Geographic Variations and Heart Attacks
  One of the scariest events in one’s own life or that of a loved one is to have a
heart attack (acute myocardial infarction, or AMI). Provincial health care sys-
tems across Canada devote significant resources to the treatment of AMIs.
The practice of cardiology is one of the highest profile activities in health care,
and open heart surgery has, for years, been broadly considered one of the mir-

           New Directions for Intelligent Government in Canada               251
acles of modern medicine. The Economic Burden of Disease in Canada (PHAC,
2002) indicates that cardiovascular disease (of which AMI is a major part) had
direct costs amounting to 8.1 per cent of total health care costs in Canada, and
15.1 per cent of total hospital costs in 1998. 3 So an obvious question is
whether Canadians are getting value for the money spent on these treatments
– in other words, are the expenditures and use of highly skilled resources
devoted to treating AMI patients producing improvements in their health that
are at least commensurate?4
The short answer is that nobody knows. But there is considerable evidence,
one key element of which is discussed below, that there are major inefficiencies
in this area of health care. This evidence is limited precisely because the
required kinds of information are not being routinely collected, nor even
being collected on a sample basis, so the requisite knowledge cannot even be
generated.
In the current fiscal climate, inefficiency in the provision in health care ser-
vices means scarce resources are being spent on activities with at most mar-
ginal health benefits, and at worst harmful effects – in Ivan Illich’s term,
iatrogenic (Illich, 1976; see also Baker et al., 2004). Hence the resources could
be devoted to other activities that produce higher benefits – either within
health care, in which case inefficiency is equivalent to a failure to improve
Canadians’ health as much as possible, or in other sectors, like education and
housing, whose budgets are being squeezed by the disproportionate growth in
health care spending.
The evidence we do have, and one of the most powerful indicators that
something might be amiss in the way health care is managed, is variations in
health care provision across small geographic areas. The main reason for the
widespread attention to these kinds of indicators, which are intrinsically rather
3 The fact that, in 2011, the most recent data of this sort is for 1998 is itself an
indication of the deplorable priority attached to the production of important
kinds of health information.
4 There is extensive discussion in the cost-effectiveness literature of what it
means for expenditure to be “commensurate” with the associated health gain.
For our purposes here, “commensurate” can be taken to mean that the dollar
costs per QALY (quality-adjusted life year) gained is not excessive. See
Laupacis et al. (1992); Gold et al. (1996).
252 New Directions for Intelligent Government in Canadaweak for this purpose, is that they are relatively easy to construct with rou-
tinely collected data – indeed using data that are primarily collected for other
purposes (e.g. monitoring hospital budgets, paying physicians). But they have
been essentially the only data available for this purpose.
It has been widely observed in many jurisdictions that the fraction of the
population being treated can vary substantially from one small geographic
area to another. But if the rates of illness, for example AMIs, are roughly the
same across these same small regions, then “medical necessity” cannot explain
wide variations in treatment rates. Some other factors, possibly ones that indi-
cate inappropriate provision of health care, might be the cause. This possibility
led, decades ago, to major efforts in the development of “appropriateness
guidelines.” However, development of such guidelines has been slow – in part
because of the difficulties in assembling the required information, and their
adoption has also been slow, in part as doctors have resisted the idea of “cook-
book medicine” being forced upon them.
Of course, the situation is more complex than this. In the case of AMI, it is
well known that smoking, obesity, physical inactivity, hypertension, choles-
terol, age, and diabetes among others are major risk factors for AMI, and the
prevalence of these risk factors also varies across small geographic areas
(CCORT, 2006, p.35). The CCORT (Canadian Cardiovascular Outcomes
Research Team) researchers concluded:
There is a moderate to high degree of variation in
hospitalization rates (for AMI) across the regions of
Canada... Variations in hospitalization rates for these four
cardiovascular diagnoses (AMI, CHF = congestive heart
failure, angina, chest pain) could in part be a result of
differences in coding practices for these conditions,
although we believe that is unlikely to be the major
explanation. A more plausible suggestion is that regional
differences in hospitalization rates are related to factors
such as physician supply and practice styles, access to
ambulatory care, community and institutional resources,
the prevalence of effective primary and secondary
prevention programs, and the socioeconomic status of
various health regions. (CCORT, 2006, p. 55)
New Directions for Intelligent Government in Canada 253Some of the potential explanations for these variations in hospitalization
rates as just enumerated by the CCORT atlas point toward issues of primary
prevention. For example, why are smoking rates higher in one region than
another. But other explanations such as “physician supply and practice styles”
point to questions of where doctors choose to practice, and the ways medical
school enrolments and hospitals are managed. The fact that one of the best
research groups in Canada, with some of the best data available, is unable to
determine which of these major and very different potential explanations is
dominant is troubling, especially now - after decades of evidence of such small
area variations, the attendant push to develop appropriateness guidelines, and
efforts to apply “evidence-based decision-making” across the spectrum of
health care activities.
Unexplained small area variations in health care indicate possible
inefficiencies and/or significant pockets of sub-optimal care. In a phrase, we
see some smoke, but we are not sure where the fire is, nor how large it is.
As an overall indication of the magnitude of these small area variations,
Chart 1 shows the rates of hospitalization across Canada’s larger health
regions.5 The crude hospitalization rates (the steepest line) vary dramatically
from a low of less than 40 visits per thousand population to over 180 – more
than a four-fold difference. With hospital costs at about 4 per cent of GDP, the
resource implications of understanding these variations should be evident.
To be conservative, and to ensure the results are robust, the arrows in this
chart point to the 10th and the 90th percentiles of the health regions ranked by
their rates of hospitalization. The 90 th percentile region had a crude rate
(steepest line) of 2.3 times as many hospitalizations as the 10th percentile.
Of course, experienced health services analysts will immediately point out
that some of the high rate regions likely had an older or more female
population, where both of these factors could account for a higher
hospitalization rate. So the results adjusted for age and sex are shown by the
next steepest line. The 90 -10 ratio of these age/sex-adjusted hospitalization
rates drops marginally to 2.2.
5 At the time of the analysis, there were just over 130 health regions in Canada.
254 New Directions for Intelligent Government in CanadaChart 1
Hospitalizations per 1,000 Population Across
116 Canadian Health Regions
200
180
160
140
120
100
80
60
40
20
0
116 Health Regions
Crude (unadjusted) rate (2.3 fold)
Adjusted for age and sex (2.2 fold)
Also adjusted for illness, health care use, risk factors (2.0)
Also adjusted for SES factors (1.7 fold)
Still, some of these regions might have more individuals suffering from
chronic disease, or they might have more smokers and obese individuals.
Indeed, one might conjecture that some of these regions have physicians who
are more inclined to admit their patients to hospitals. Unfortunately, the rou-
tinely collected data have none of these obviously important covariates. The
“culture” of medicine, at least as still incorporated (encrusted?) in contempo-
rary health information systems, is dominated by a narrow bio-medical per-
spective, notwithstanding research and analysis going back at least to the
Lalonde Report (1974) that “there is more to health than health care.”
Fortunately, Statistics Canada’s Canadian Community Health Survey
(CCHS) does have these data, and the overwhelming majority of survey
respondents consented to having their data linked to their health care records.
This has been done in the case of hospital visits. The result of linking the
CCHS data at the individual record level to the hospitalization (discharge
New Directions for Intelligent Government in Canada 255abstract) data described so far, and then adjusting for the mixture of factors
just mentioned – including chronic disease prevalence, and risk factors includ-
ing smoking and obesity, is shown by the next steepest line. These statistical
adjustments reduce the 90th to 10th percentile regional hospitalization ratio a
bit more, down to 2.0.
Finally, there are further, albeit more distal, socio-economic health deter-
minants which might also account for some of these large differences in hos-
pitalization rates across health regions in Canada. To account for this, the least
steep line incorporates further statistical adjustments for these socioeconomic
status (SES) factors – including income, education, race, and immigration sta-
tus. The 90 – 10 hospitalization ratio now declines further from 2.0 to 1.7.
Interestingly, this last adjustment has about the same impact as the first two
sets of adjustments combined – age and sex, and illness, risk factors and other
health care use. Compared to the early 1990s when the idea of the social deter-
minants of health having a major role in understanding why some people are
healthy and others not 6 was still a contested academic curiosum, it is now
widely accepted. The results in this graph clearly reinforce this substantive
point. But after almost two decades of discussion and effort, it still has not pen-
etrated to the structure of Canada’s health information to any substantial
degree. Chart 1 required major, special efforts, and these kinds of data are not
routinely produced.
Moreover, these statistical adjustments do not make the wide variations in
hospitalization rates go away. Indeed, we may have over-adjusted. So there
must be an important range of other factors – presently unknown – driving
such large variations in utilization of one of the most expensive parts of Can-
ada’s health care sector. Similar analysis in the United States using their
national Medicare data clearly indicated that the observed 3:1 small area vari-
ations indicated major inefficiencies, and these results have been central to
their recent health care reforms (Fisher et al., 2003; Gawande, 2009; Gawande
et al., 2009).
6 This is the title of the award-winning book (Evans, Barer and Marmor, 1994)
which was a milestone in broadening the appreciation of the importance of
social determinants of health.
256 New Directions for Intelligent Government in CanadaA recent analysis at Statistics Canada has been able to push the CCORT
(2006) and McGrail et al. (2011) type small area analyses considerably further,
albeit with major effort, and not for all provinces (Johansen et al., 2009). It is
one thing, as in the CCORT atlas, to show the small area variations in risk fac-
tors on one map, the rates of AMI on another, and AMI mortality on yet
another. However, there are many factors interacting in a more complicated
way, so that ideally a much more sophisticated analysis is required. In particu-
lar, the analysis ideally occurs at the level of individual patients rather than
small geographic areas, and the data should be longitudinal, so the patient can
be tracked from risk factors to AMI to hospitalization and treatment to subse-
quent health status and longevity.
In other words, the ideal information base to disentangle the complex fac-
tors that could account for otherwise unexplained small area variations in
health care would be a large set of actual patient trajectories covering not only
their treatments but also their health status both before and after the treat-
ment. Again, ideally, the health care sector should only be providing treat-
ments where health status after the treatment is most likely to be better than
before – though of course the analysis is more complex than this with chronic
diseases where health care is needed over an extended period of time.
Unfortunately, the data just described do not exist. But a partial data set of
this sort has been assembled (again with considerable effort) and used to exam-
ine, at the level of individual patients, the relationships among the major kind
of treatment for AMIs, namely revascularization (coronary artery bypass graft
(CABG) and percutaneous trans-luminal coronary angiography (PTCA)), and
mortality. Specifically, only hospitalization data have been used, but for each
in-patient who was diagnosed on admission with an AMI, their hospitaliza-
tions have been linked longitudinally.
Chart 2 provides a quick sketch of how the results are put together. Each
horizontal line represents a highly stylized view of one patient’s trajectory of
hospitalizations, showing three kinds of events – black for an AMI, grey for a
revascularization, and white for death.
In order to focus on the subset of individuals for whom the hospital admis-
sion was a first AMI, the linked data were examined for 12 months prior to the
index AMI to see if they had been previously admitted with another earlier
New Directions for Intelligent Government in Canada 257Chart 2
Hypothetical Event History Data for AMI and Revascularization
Observation period
(excluded)
follow-up period
}
Heart attack (AMI) Death
Treatment (revascularization = bypass or angioplasty)
AMI. The top line in Chart 2 illustrates the trajectory of an individual who was
rejected from the analysis for just this reason.7 The second line represents an
individual who was revascularized, and survived for the length of the follow-
up period, but not much longer. The other lines give examples of other pat-
terns.
With these kinds of longitudinally-linked patient-level trajectories of hospi-
talizations, it is possible to begin examining small area treatment variations in
Canada in a far more sophisticated manner. What the Johansen et al. (2009)
analysis did was first assemble all of the patient trajectories into groups by sub-
provincial health region, and then extract two basic statistics. The first was the
proportion of all the health regions’ incoming AMI patients who were treated
by revascularization. The second statistic was the proportion who died in hos-
7 Of course, one year as a “wash out” period to ensure that the index AMI was
indeed a first AMI is too short in reality. But the ability to assemble linked
hospitalization data in this way remains severely constrained, and this was the
best that was feasible.
258 New Directions for Intelligent Government in CanadaChart 3
30-day revascularization and 30-day mortality rates of acute
myocardial infraction patients, health regions with at least 100,000
population, seven provinces, 1995/1996 and 2003/2004
30-day mortality rate, per cent
20
1995/1996
2003/2004
15
10
5
0
0 10 20 30 40 50 60 70
30-day revascularization rate, per cent
Nova Scotia, New Brunswick, Quebec, Ontario, Manitoba, Saskatchewan, Alberta.
Note: Lines cross at median values of mortality and revascularization within each year.
Source: 1995/1996 and 2003/2004 Health Person-Oriented Information Database, Statistics
Canada.
pital within 30 days of the AMI, including cases who were discharged and then
re-admitted.
Chart 3 “simply” shows a scatter plot of the results. Each dot in this graph
represents one large health region. (Only health regions with populations over
100,000 were included to ensure sufficient numbers for statistical analysis).
Each region’s revascularization rate for AMI cases is plotted along the hori-
zontal axis, and its 30 day mortality rate along the vertical axis. (Note that the
vertical axis scale is over twice as large as horizontal axis scale, to make varia-
tions in mortality rates clearer visually.) The hollow triangles show the situa-
tion in 1995/6, while the black diamonds are 8 years later.
Overall, during this eight year period, there has been a dramatic increase in
treatment rates – more than a tripling from an average of 12.8 per cent in
New Directions for Intelligent Government in Canada 2591995/96 to 39.8 per cent in 2003/4, an increase of 27 percentage points. The
reasons for this dramatic growth are not entirely clear, but are likely due in
part to pressure from cardiologists who argued that increased budgets for the
less invasive PTCA would substitute for open heart surgery (CABGs) and
thereby reduce costs (which did not happen). There was also evidence of effi-
cacy of PTCA from clinical trials, though ignoring powerful evidence of over-
use of this procedure in the United States.8 And there was broad public sup-
port for increased capacity for this “miracle of modern medicine.” We might
therefore expect a similarly dramatic improvement in outcomes. And we do
see some improvement in survival. But compared to the increase in treatments,
the reduction in mortality is more modest, about a 3.6 percentage point drop
– from 13.2 to 9.4 per cent.
Even more importantly, the scatter of dots shows a very wide variation
among health regions. In 2003/4, a number of health regions had 30 day mor-
tality rates in the 8-10 per cent range, yet treatment rates varied about three-
fold, from around 20 per cent to about 60 per cent (highlighted by the shaded
rectangle).
If these health regions were manufacturing firms, and their input costs var-
ied by a factor of three for what appears to be the same quality of output,
almost all would be bankrupt and out of business in short order.
At least as importantly, the impression given by the scatter of points in Chart
3 is that health care practice – i.e. the treatment decisions of cardiologists,
and/or the guidance offered by hospital or health region managers – is all over
the place. If revascularization were really an effective treatment, as practiced
across most of Canada, then within each oval, the points would cluster tightly
around a line sloping down and to the right. Instead, there is no obvious trend
within each oval for higher treatment rates to be associated with lower mortal-
ity rates. To put it starkly (and notwithstanding various clinical trials arguing
for the efficacy of rapid revascularization for AMI cases), why should one
health region do three times as many cardiac procedures than another if there
is no observable difference in mortality outcomes?
8 See Boden et al. (2007) for evidence that the United States had been conduct-
ing 800,000 unnecessary PTCAs per year.
260 New Directions for Intelligent Government in CanadaOf course, there are some important caveats, and herein lie many chal-
lenges. No account has been taken of other clinical factors – for example the
extent and speed of thrombolysis (clot-busting drugs), or variations in the
prevalence of conventional AMI risk factors like hypertension, obesity and
smoking status. Nor has any account been taken of the broader determinants
of health – the possibility that the higher AMI mortality rate regions are
poorer, and thus subject to higher mortality rates more generally.
Also, the intended benefits of revascularization are much more than a reduc-
tion in 30 day mortality. Revascularization after AMI is intended not only to
prevent immediate death, but also to improve longer term survival and quality
of life, especially reduction of anginal pain. It has been possible for a smaller
sub-set of provinces to link the hospitalization records to death certificates, so
that for AMI cases in these provinces, a one year rather than only a 30-day
mortality follow-up was also examined, as were adjustments for co-morbidity.
For this smaller group of provinces, the results were essentially the same.
But the fundamental issue remains that the data are just not generally avail-
able – even something as elementary as being able to link death certificates,
with cause of death information, to hospitalization records. It should be obvi-
ous that one of the most straightforward indicators of health care performance
is whether or not the patient was alive 6 or 12 months after a surgical proce-
dure. But Canadian health care is substantially driven by specialists who treat
body parts rather than whole people, and by organizations which typically lose
track of their clients once they go out the door (both vertical and horizontal).
While there are obvious benefits from such specialization, there are also dis-
advantages. In particular, a “whole patient” or whole person view is lost. The
health care non-system is blind to patients’ care trajectories – it pays no atten-
tion to the sequence of health care encounters, how they interact, and their
cumulative impact on the health of Canadians. There is no choice: these data
are not routinely available to health care providers.9
9 Of course, there are important exceptions. For example, some local cancer care
systems do track their patients through a range of different cancer treatment
and related encounters. And your personal physician has a record of his or her
encounters with you. But they do not generally have records of all your
hospitalizations, your visits to other doctors, nor all your prescriptions.
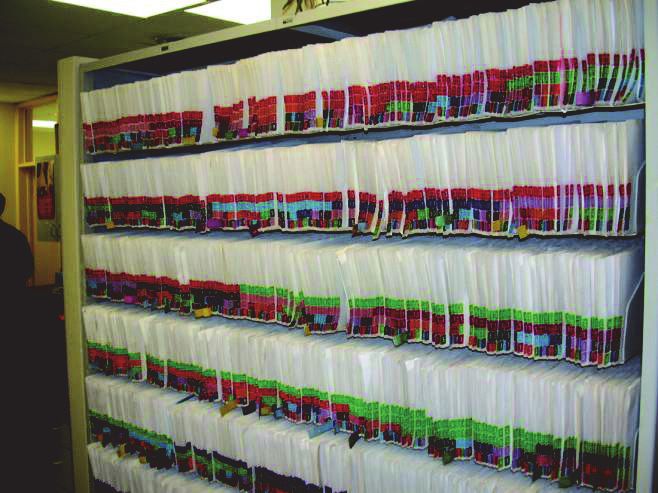
New Directions for Intelligent Government in Canada 261Figure 1 The “Wall of Ignorance” Ideally, health care is managed with the basic principle of allocating resources to those activities which are most cost-effective, those which give the largest improvements in population health per dollar. Unfortunately, in this $200 billion sector of Canada’s economy (CIHI, 2010), the information needed to tell whether or not this is happening is absent. The photo in Figure 1 was taken a few years ago in a neighbouring GP’s office. While this “paper” method of storing patient data is adequate (in some ways only barely) for one- on-one patient care, it is a “wall of ignorance”10 from the perspective of any kind of basic, let alone sophisticated, patient care (e.g. following up on screen- ing tests, including charts from hospitalizations, complete listings of drugs especially prescriptions from other doctors) and for health system manage- 10 I am indebted to Dennis Psutka, former ADM in the Ontario Ministry of Health, for this phrase. 262 New Directions for Intelligent Government in Canada
Chart 4
Physicians Using Electronic Medical Records
(per cent)
100
           2006
 90
           2009
 80

 70

60

50

40

30

20

10

 0
      Canada    United   Germany   Australia    United     New Netherlands
                States                         Kingdom   Zealand

ment more generally. Chart 411 shows how far behind Canada is compared to
other advanced economies with regard to electronic medical records (EMR).
  In sum, with Chart 3 we see a very large amount of noxious smoke, but we
still have no idea where the fire is. And the state of Canada’s health informa-
tion shown in Figure 1 and Chart 4 indicates the seriousness of our lack of the
information base needed to understand the location of the fire.

Why Do Health Care Costs Increase
  Health care has been almost continually at or near the top of the agenda in
public opinion polling for decades. This is evidenced most recently by the
election platforms of all major federal political parties in the 2011 federal elec-
tion, where as soon as the question was mentioned, they all almost immedi-
ately undertook to continue increasing federal fiscal transfers to the provinces
at an annual rate of 6 per cent after the Canada Health Transfer expires in 2014

11 This chart was taken from Rozenblum et al. (2011); the original Common-
   wealth Fund results can be accessed at http://www.commonwealthfund.org/
   Topics/International-Health-Policy.aspx.

          New Directions for Intelligent Government in Canada                263
Chart 5
Provincial-Territorial Government Health Expenditures by Age Group
(dollars per capita)
25,000
20,000
1998
2002
2007
15,000
10,000
Aging
5,000
0
1>
1-4
5-9
10-14
15-19
20-24
25-29
30-34
35-39
40-44
45-49
50-54
55-59
60-64
65-69
70-74
75-79
80-84
85-89
90+
(though the duration of this commitment remains unclear). The basic reason,
not unreasonably, is that Canadians treasure our universal health care system,
and want strongly to protect it and free access to medically necessary care.
Correspondingly, politicians of all stripes want to avoid being seen as limiting
access by reigning in health care costs.
At the same time, governments are increasingly concerned about the so-
called “gray tsunami” – the specter of even more rapidly rising health care
costs as aging baby boomers move into the age ranges where their health care
costs begin escalating dramatically. This specter was recently amply illustrated
in the federal Parliamentary Budget Office’s (PBO) 2010 Fiscal Sustainability
Report (Askari et al., 2010). Chart 5 is taken directly from their report.
Interestingly, this graph from the PBO shows not only provincial and territo-
rial health care expenditures by 5 year age group (produced originally by CIHI),
but also changes over the period from 1998 to 2007. The public discussion, as
well as the commentary in the PBO report itself, focuses on the trend high-
lighted by the added curved line. In the light of the aging baby boomers, this pat-
tern of increasing health care costs with age is indeed very scary. But the PBO
264 New Directions for Intelligent Government in Canadareport spent virtually no time discussing the much more steeply sloping added
straight lines.12 These lines show the growth in per capita health care costs
within each of the 5 year age groups over the 1998 to 2007 period.13
It is important to emphasize that the increases highlighted by the short
straight added lines are over only a 9 year period, not the decades involved in the
very slow tsunami of population aging.14 This is about the same time interval as
that covered in Chart 3 above, which showed a dramatic increase in the rate of
revascularization after AMI (a tripling). But in that case, the data suggested that
a high proportion of the additional expenditures devoted to treating heart
attacks might not be of any value in terms of improving the population’s health.
Could this be a much more general phenomenon? Could it be that the broader
per capita cost increases shown by the PBO/CIHI graph, while providing more
revenue to hospitals and more income to doctors and nurses, may have had much
more limited benefits in terms of health outcomes?15 The sad fact is that there
is absolutely no way to tell whether these dramatic increases in health care
spending are actually buying better health outcomes. There is no broad-based
concerted effort across Canada to push the health care sector to “work smarter”
rather than to “work harder.”
What Should Be Done?
The results on the treatment of AMIs shown in Chart 3 are stark evidence of
a health care non-system at work. These data were very hard to assemble in the
12 PBO in their projections referred to these age-specific expenditure trends as
the “enrichment factor,” and took them as given, without investing any effort
to discuss or understand them.
13 In John Richards’ chapter of this volume (Richards, 2011), he shows a similar
graph. Unfortunately, he fails to probe the fact as just noted that most of the
recent cost increases have virtually nothing to do with population aging.
14 Examination of the original CIHI data that were the source of the PBO graph
indicates that the PBO failed to deflate the cost numbers. After deflation, the
per capita cost increases from 1998 to 2008 (the most recent year available
now) within each 5 year age group are not as large, but they are still
substantial.
15 One hypothesis could be related to the fact that most health care spending
occurs in the last months of life. In turn, with increasing life expectancy, more
people will spend their last year of life in a higher age group. However, the
rate of increase in life expectancy has been on the order of one year every
five. This rate is too slow to account for the pattern shown in the chart.
New Directions for Intelligent Government in Canada 265first place; and they are seriously incomplete. As things stand, there is limited prospects that, in coming years, Canada’s health information and knowledge generation systems will improve sufficiently so that the sources of these dra- matic variations can be understood. Nor is there reason for optimism that the evidentiary base to understand the trends highlighted by the short steep lines in Chart 5 will improve significantly. Notwithstanding the continuing escalation of health care costs, there is no concerted effort amongst the managers of health care in Canada, up to and including Ministers and Deputy Ministers of Health, or their colleagues in Ministries of Finance, to try to understand the extent to which these results indicate major system inefficiency.16 There are similar lacunae in the efforts being devoted to understanding which interventions are most likely to be cost- effective in improving the health of Canadians.17 Canada’s health care industry, in this regard, stands in stark contrast to other sectors of the economy. Leading firms in forestry, mining and automobile manufacturing, for example, know their “cost functions” – they know their total spending on labour, materials, energy and other inputs. They also have an engineering level of detailed understanding of the prices and quantities required of their many inputs, and their benefits when used in various combi- nations – their techniques of production in economic jargon. This knowledge is, of course, not free; substantial investments are required, for example, to know the incremental costs of different kinds of mineral extraction, and fur- ther and equally importantly, their potential contributions to bottom line profitability. In many cases, this knowledge is purchased from specialized con- sulting engineering firms, the very existence of which emphasizes the impor- tance of this kind of knowledge in these other sectors. 16 Of course, all senior managers of Canada’s health care sector would like such information. The key point here is that efforts to do so, on the scale needed, are not apparent. 17 There are some notable exceptions, for example a number of hospitals have associated research institutes, such as the Ottawa Hospital Research Institute (OHRI), devoted both to generating new evidence and bringing existing evidence such as that assembled by the Cochrane Collaboration (http:// www.cochrane.org/) to bear on health care practice of the Ottawa Hospital with which it is associated. 266 New Directions for Intelligent Government in Canada
At the same time, successful firms in these other sectors devote major efforts
to understanding the needs and wants of their customers, and to quality con-
trol. Of course, there are major differences between the market for cars and for
health care. With regard to needs and wants, consumers generally have much
better knowledge of what they are buying in the case of a car than health care.
But compared to the knowledge asymmetry between car sales staff and pro-
spective car purchasers, health care providers typically have far more knowl-
edge – though this disparity is being reduced by the widespread availability of
health information on the internet, at least for those with the propensity and
ability to understand it. At the same time, though, the provider has an incen-
tive to find more “need” for his or her services. This differential knowledge
asymmetry, far larger in health care than for most other goods and services, is
one of the principal arguments for publicly provided health care. But this in no
way obviates the needs for governments, acting on behalf of their citizens
when providing them health care services, to engage in extensive and sophis-
ticated assessments of their needs.
   There is a corresponding analogy with regard to quality control. Producers in
other sectors like manufacturing have understood its importance for decades,
indeed since World War II and the seminal work of Deming (1950, also
Shewhart and Deming, 1939), leading to the growth of statistical process quality
control methodologies. Better producers regularly sample their products, sub-
ject them to quality testing, and have clear methods for tracking which steps in
the production process are the sources of any observed defects. But even though
the importance of these ideas has been understood for decades, and there are
well established university programs in operations research and statistics that
train individuals to do these kinds of quality control, these ideas are only
recently beginning to be taken up in the health care sector, for example with the
creation of a number of health quality councils.18 Still, even these organizations

18 For example see the health quality councils in Saskatchewan (http://
   www.hqc.sk.ca), Ontario (http://www.ohqc.ca/en/strategic_plan.php), Alberta
   ( h t t p : / / w w w. h q c a . c a / ) , Q u e b e c ( h t t p : / / w w w. c s b e . g o u v. q c . c a /
   index.php?id=63&L=2 ), New Brunswick (http://www.nbhc.ca/index.cfm) and
   British Columbia (http://www.bcpsqc.ca/), the Canadian Patient Safety Insti-
   tute (http://www.patientsafetyinstitute.ca/English/Pages/default.aspx) and the
   Health Council of Canada (http://www.healthcouncilcanada.ca/splash.htm).

                New Directions for Intelligent Government in Canada                                               267
are having difficulty due to the paucity of appropriate information, as indicated
by the following statement on the Saskatchewan Health Quality Council’s web
site (home page):
While there are a lot of data available on discrete encoun-
ters with the health system, there is currently no way to
answer the following questions: How does a person with a
health problem travel through the health care system?
Which services do they access and in what order? What is
the relationship between patient characteristics (age, sex,
etc.), the services they are using, and health outcomes?
Answering these questions will allow the health system to
better understand how episodes of care are related, track
changes in the use health services over time, and more
accurately determine the cost of treating a condition.
These comparisons between health care and leading firms in the private sec-
tor are in no way a suggestion that more aspects of health care should be priva-
tized. There are fundamental reasons why it should remain publicly provided,
including the information asymmetry problem just noted, the fundamental
importance of equal access to health care services in terms of social equity, and
(certainly compared to the major counter-example, the United States) the bet-
ter capacity to control costs. Rather, the point of these comparisons is to
emphasize that methodologies for aligning what services are produced with
what is needed in the most cost effective manner, and for rigorous quality con-
trol, are well developed and widely deployed in other parts of the economy.
The outstanding question is why the health care sector has been so immune to
learning from these other experiences.
There are several explanations. One is like the proverbial frog in the pot of
water. If the temperature is increased gradually, the animal dies before it tries
to jump out of the pot. In the case of health care, costs have been increasing
for decades (albeit with a significant and controversial downward movement in
the mid-1990s), but only gradually. As a result, policy attention has focused
more on “muddling through” than on more fundamental responses.
Another explanation is more sociological. Individuals who self-select into
health care occupations tend to be preoccupied with one-on-one caring inter-
actions, and not with broader structural issues. They also tend to be less quan-
268 New Directions for Intelligent Government in Canadatitatively inclined. Doctors, in particular, are motivated to save lives, and often
with a “damn the costs” attitude. These kinds of orientations are also evident
in hospitals, ministries of health, and other health care organizations which
naturally recruit many of their managers from these pools.
Yet another explanation is the powerful positions held by doctors through-
out the health care sector. They are used to being authority figures. They have
been through a grueling training process in medical school where they have
had to master huge volumes of knowledge. Practicing doctors have passed
these tests, and many do not like to be told what to do. Modern health infor-
mation systems, however, do have the capacity to monitor physician perfor-
mance in unprecedented ways. These systems can pop up reminders or alerts
that something a physician is about to do or prescribe is wrong. They can also
give them statistics about their practice patterns comparing them (perhaps
unfavourably) to their peers when they have little training or interest in quan-
titative analysis. There are, as a result, very understandable reasons why the
medical profession is resistant to the kinds of “modern management” that have
become standard in other sectors of the economy.19
Yet the absence of modern management of health care is the most funda-
mental problem. At a technical level, what needs to be done is well-known.
The key ingredients in general are the collection of the right kinds of data,
analysis of these data, and feedback to managers at all levels of the health care
enterprise, as well as clinicians and patients. In short, not only is a major part
of health care at the patient level itself a knowledge process – collecting the
patient’s history, accessing prior accumulated knowledge, forming a diagnosis
and deciding on a course of action – but addressing the most fundamental
problems in the broader health care enterprise also requires well-designed and
19 We are tempted to use the term “scientific management” with its implications
of managing with a view toward economic efficiency and the application of
analysis, synthesis, logic, rationality, empiricism, efficiency and elimination of
waste, standardization of best practices, disdain for tradition preserved merely
for its own sake or merely to protect the social status of particular workers
with particular skill sets. However, “scientific management” is also associated
with Taylorism, which has unfortunate connotations of deskilling workers and
dehumanising workers and the workplace. (Both preceding sentences borrow
from the Wikipedia definition.) To avoid these latter connotations, we use the
phrase “modern management.”
New Directions for Intelligent Government in Canada 269Figure 2
An Analytical Framework of the Policy and Non-policy Influences
on Healthcare System Outcomes
Place/environment
Characteristics of the
Health Care System
Process of Structure of Quality of
health care health care health care
Place/environment
Place/environment
Care Path Outcomes
● Patient-related outcomes
Need for intervention ¬ Intervention(s) ¬ ● Health status
● Health-related
● Non health-related
● Health system performance
Characteristics of Patients
Socio-demographic Risk Health status/ Expectations/
characteristics factors comorbidity preferences
Ongoing care
Place/environment
substantial information systems and knowledge generation and diffusion pro-
cesses.
The main elements of the latter kind of information framework are shown
in Figure 2 (Statistics Canada and CIHI, 2008). As noted in this Statistics Can-
ada/CIHI study on health outcomes, it builds first on Donabedian’s (1966,
1988) structure – process – outcome framework wherein the quality of health care
is assessed in terms of health improvements that can be attributed to episodes
of care. It also builds on Wagner’s (1998) discussion of best approaches to
chronic disease management, as well as the conceptualization of population
health to include a much broader range of determinants than simply the bio-
medical (Evans et al., 1994)
270 New Directions for Intelligent Government in CanadaThe core of this diagram is the care path, the central portion where individ-
uals have a health problem, are treated with some kind of intervention, and
this intervention in turn affects their health status as well as other aspects of
their lives. These include other health-related results such as biomarkers,
which are not really health outcomes in any sense meaningful to patients, and
non-health outcomes such as satisfaction with the way the health care was
delivered, and impacts on their work lives. As well, outcomes can be assessed
at an overall health system level, for example by indicators such as infant mor-
tality rates.
In turn, the most critical requirement is routine and repeated measures of
patients’ health status. There is no way to tell whether or not an intervention
had a beneficial impact without knowing whether the individual’s health status
after the intervention was better than before. This notion is so elementary that
it seems trivially obvious. Indeed, it was emphasized over a century ago by A.E.
Codman with his “end results” cards (Berwick, 1989). Unfortunately, however,
there is no locus for developing this kind of measurement, let alone broaden-
ing consensus on its need, anywhere in Canada.
In contrast, the United Kingdom’s National Institute for Health and Clini-
cal Excellence (NICE, 2008) has mandated this approach in its guidance on
technology appraisal, which is fundamental to its work. The “fundamental
principles” of NICE include,
The Institute takes into account the clinical and cost
effectiveness of a technology, along with other specified
considerations, when issuing guidance to the NHS
(National Health Service). (para 1.4.1)
In general, technologies can be considered clinically
effective if, in normal clinical practice, they confer an
overall health benefit, taking account of any harmful
effects, when compared with relevant alternative treat-
ments. Technologies can be considered to be cost effec-
tive if their health benefits are greater than the
opportunity costs measured in terms of the health bene-
fits associated with programmes that may be displaced to
fund the new technology. In other words, the general
consequences for the wider group of patients in the NHS
are considered alongside the effects for those patients
New Directions for Intelligent Government in Canada 271who may directly benefit from the technology of interest.
(paras 1.4.2)
NICE includes in “health technologies” pharmaceuticals, medical devices,
diagnostic techniques, surgical procedures, other therapeutic technologies,
and health promotion activities (para 1.2.1). The appraisals undertaken by
NICE are significant because “The Secretary of State for Health has directed
that the NHS provides funding and resources for technologies that have been
recommended through the NICE technology appraisals programme…” (para
1.5.1).
Further, in their section on “Measuring and valuing health effects,” the
NICE document states, “For cost-effectiveness analysis, the value of health
effects should be expressed in terms of QALYs (quality adjusted life years) for
the appropriate time horizon. For the reference case, the measurement of
changes in HRQL (health-related quality of life) should be reported directly
from patients and the value of changes in patients’ HRQL (that is, utilities)
should be based on public preferences using a choice-based method.” (para
5.4.1).
In the United States there have been important reports from the Institute of
Medicine (Gold et al., 1996) advocating the kind of approach adopted by
NICE in the United Kingdom. The recent Obama health care reform package
includes billions of dollars for health care cost-effectiveness evaluations, fol-
lowing in part on the kind of evidence like that in Chart 3 above produced by
the Dartmouth group (Fisher et al. 2003; Gawande, 2009; Gawande et al.,
2009).
The Health Council of Canada (2009) has raised similar concerns in their
report, “Value for Money: Making Canadian Health Care Stronger” where
they ask:
Are we using our resources well to produce services? And
more importantly, are we using services well to foster a
healthy population? We need better information to
answer these questions. Assessing value for money
requires knowing what care is effective, for whom, and
under what circumstances; and finding out whether that
care actually has the desired effects. (p. 9)
272 New Directions for Intelligent Government in CanadaCanadian researchers (e.g. Torrance, 1976; Torrance and Feeney, 1989)
have been world leaders in the development of the kinds of QALY measures
cited by the NICE document, and Statistics Canada has been a leader in
including such measures in its health surveys. The Statistics Canada-CIHI
study, from which Figure 2 has been drawn, goes on to push available data as
far as possible to begin to answer these kinds of questions in the case of depres-
sion and diabetes treatments, though with limited success. But aside from
these few examples, there has been little or no interest in such approaches
more generally in Canada’s health care sector.
Of course, adequate data on health status using some kind of QALY mea-
sure, while essential, are not the whole of the story. As indicated in Figure 2,
there are many other factors affecting health status and the way it changes over
time. For example, the results in Chart 3 above on AMI treatments and out-
comes, at least to the very limited extent measured in terms of 30 day mortal-
ity, could be due to small area variations in smoking or obesity rates (i.e.
“patient characteristics” in the bottom portion of Figure 2). If these comple-
mentary data were also available, it would be possible to adjust statistically for
their contributions to observed patterns of change in health status as done in
Chart 1, and thereby at least approximate the contribution that can be attrib-
uted to the health care intervention. But again, such data are not available, and
the prospects for their creation remain dim.
Where is the Problem?
If important approaches to containing the growth in Canada’s health care
costs and improving the health of the population are so obvious, why is almost
nothing being done? Or, if things are being done, why is progress so painfully
slow? Some of the reasons have already been outlined – the fact that cost pres-
sures have been growing only gradually, so it is typically easier to try to “mud-
dle through” than take more dramatic action. There is also a bias against
quantitative analysis and rigorous evaluation in many parts of the health care
sector, and the self-interests (both pecuniary and in terms of autonomy) of
many providers.
Another is a sort of chicken and egg question. It is very difficult to rally pub-
lic opinion, and hence political will, to make difficult choices if there is no
New Directions for Intelligent Government in Canada 273apparent pressing issue. Canadians are generally willing to pay higher taxes in order to be assured that high quality health care will be accessible when they need it. As a result, gradual increases in health care costs will generally be accepted. The information and knowledge to show major inefficiencies in health care generally does not exist. And without the evidence of problems, the investments in improving health information and related analyses never achieve a very high priority. Hopefully, results like those in Chart 3 above will diffuse and strengthen the case that there really are potentially serious prob- lems. Another major factor is the concern for protecting personal privacy. There is no question that the kinds of data and data linkages needed for rigorous and systematic health outcome analysis are very sensitive. But at the same time, Canada and the provinces are suffering under a “privacy chill.” Concerns about privacy protection on the part of many data custodians are excessive. In part, this is due to a basic asymmetry. A data custodian in a provincial health ministry has far more to lose if allowing access to patient record data results in some sort of privacy breach. If, on the other hand, the data are made accessible only to bona fide analysts – either in a secure university setting or under the stringent auspices of some other agency like Statistics Canada or a provincial health quality council – and important benefits are then derived from analysis of those data, the data custodian receives virtually no benefit to his or her career. There is clearly a trade-off here between the competing goods of pro- tecting privacy and advancing knowledge of “what works” in the health care sector. While there is not extensive evidence, there are indications that the general public would prefer more use of their personal data if it would improve the quality and cost-effectiveness of their health care.20 Electronic health and medical records (EHRs and EMRs) are of potentially major benefit for Canada’s health information and knowledge. The federal government has provided over $1.5 billion to Health Infoway to work with 20 As a related example, when Statistics Canada held focus groups to explore whether parents would be willing to allow the Canadian Health Measures Survey to collect bio-markers from their children, the initial reaction was quite negative. But once it was pointed out to parents that these data collections were essential to construct information like growth curves, the attitudes changed dramatically. 274 New Directions for Intelligent Government in Canada
provincial, territorial and other partners to accelerate the deployment of such
information systems. The provinces and territories are making similarly large
investments.
  However, until the past few years, Infoway has been reluctant to talk of
EHRs in anything other than the context of direct improvements in patient
care. The recent television ads, showing patients arriving in the emergency
department with or without the EHR information on their allergies and pre-
scriptions, provide a vivid example of these kinds of direct patient-specific
benefits of EHRs. Yet it is likely that EHRs will provide even greater benefits
in supporting health system evaluation – not least in providing the basis for
appraisals of the cost-effectiveness of health interventions (or “technologies”
in the terminology of NICE), and monitoring whether the interventions being
provided are in fact appropriate. Unfortunately, however, these latter “health
system” uses of EHRs have not been a visible priority.
  Moreover, a careful analysis based on interviews with a number of stake-
holders across Canada concluded that “lack of an e-health policy, inadequate
involvement of clinicians, failure to establish a business case for using
electronic health records, a focus on national rather than regional
interoperability, and inflexibility in approach were seen as barriers to adoption
of the (e-health) plan.” (Rozenblum et al., 2010) Recent scandals in the
procurement of EHR software have also been a major setback. And it may turn
out that the EHR software being deployed has been managed with so little
vision that the kinds of information needs described above will not be
achievable for yet another decade.

Vision of a Coherent Health Information System
  As noted at the outset, a large portion of the actual patient-level work of
providing health care is intrinsically knowledge work – from gathering patient
histories to prescribing courses of action. Health care is a knowledge-intensive
industry. But it is nowhere near as knowledge and information-intensive as it
should be. While the costs of this limitation are diffuse and difficult to identify
– not least because of the catch-22 that the information needed to do so gen-
erally does not exist, they are almost certainly very substantial, both in terms
of excessive expenditure on inappropriate kinds of health care, and foregone

          New Directions for Intelligent Government in Canada                275
You can also read