Heavy Metals in Suspended Particulate Matter of the Zhujiang River, Southwest China: Contents, Sources, and Health Risks - MDPI
←
→
Page content transcription
If your browser does not render page correctly, please read the page content below
International Journal of
           Environmental Research
           and Public Health

Article
Heavy Metals in Suspended Particulate Matter of the
Zhujiang River, Southwest China: Contents, Sources,
and Health Risks
Jie Zeng 1 , Guilin Han 1, * , Qixin Wu 2 and Yang Tang 3
 1    Institute of Earth Sciences, China University of Geosciences (Beijing), Beijing 100083, China;
      zengjie@cugb.edu.cn
 2    Key Laboratory of Karst Environment and Geohazard, Ministry of Land and Resources, Guizhou University,
      Guiyang 550025, China; qxwu@gzu.edu.cn
 3    State Key Laboratory of Environmental Geochemistry, Institute of Geochemistry, Chinese Academy of
      Sciences, Guiyang 550081, China; tangyang@mail.gyig.ac.cn
 *    Correspondence: hanguilin@cugb.edu.cn; Tel.: +86-10-8232-3536; Fax: +86-10-8232-1115

 Received: 20 April 2019; Accepted: 22 May 2019; Published: 24 May 2019

 Abstract: To investigate the abundance, water/particle interaction behavior, sources, and potential
 risk of heavy metals in suspended particulate matter (SPM), a total of 22 SPM samples were collected
 from the Zhujiang River, Southwest China, in July 2014 (wet season). Nine heavy metal(loid)s (V,
 Cr, Mn, Ni, Cu, Zn, As, Cd and Pb) in SPM were detected. The results show that the selected heavy
 metal(loid)s in SPM appear in the following order: Mn (982.4 mg kg−1 ) > Zn (186.8 mg kg−1 ) >
 V (143.6 mg kg−1 ) > Cr (129.1 mg kg−1 ) > As (116.8 mg kg−1 ) > Cu (44.1 mg kg−1 ) > Ni (39.9 mg
 kg−1 ) > Pb (38.1 mg kg−1 ) > Cd (3.8 mg kg−1 ). Furthermore, both the enrichment factor (EF) and
 geo-accumulation index (Igeo ) indicate that SPM is extremely enriched in metal(loid)s of Cd and As,
 while SPM is slightly enriched, or not enriched, in other heavy metals. According to the toxic risk
 index (TRI) and hazard index (HI), arsenic accounts for the majority of the SPM toxicity (TRI = 8,
 48.3 ± 10.4%) and causes the primary health risk (HI > 1), and the potential risks of V and Cr are
 also not negligible. By applying a correlation matrix and principal component analysis (PCA), three
 principal components (PC) were identified and accounted for 79.19% of the total variance. PC 1
 (V, Cr, Mn, Ni, Cu, and Pb) is controlled by natural origins. PC 2 (As and Cd) is mainly contributed
 by anthropogenic origins in the basin. PC 3 (Zn) can be attributed to mixed sources of natural and
 anthropogenic origins. Moreover, all the partition coefficients (lgKd ) exceeded 2.9 (arithmetical mean
 value order: Mn > Pb > Cd > V ≈ Cu > Cr ≈ Ni), indicating the powerful adsorptive ability of SPM
 for these heavy metal(loid)s during water/particle interaction.

 Keywords: heavy metals; suspended particulate matter; enrichment; health risk; Pearl River;
 Southwest China

1. Introduction
     Heavy metals are one of the most significant pollutants in the environment, particularly in
the aquatic environment, that may cause severe deterioration of water quality and do harm to
living organisms due to their toxicity, persistence, non-biodegradability, and bio-accumulation [1–3].
Generally, heavy metals in the aquatic system can be divided into three phases: dissolved load,
suspended particulate matter (SPM), and sedimentary [4–8]. Although the dissolved phase is believed
to be more toxic to aquatic organisms and humans, its content is usually lower than the suspended
particle phase [9]. Because of the high surface area and reactivity of suspended particulate matter,
the dissolved heavy metals are also easily absorbed by SPM [8,10]. Therefore, more attention has been

Int. J. Environ. Res. Public Health 2019, 16, 1843; doi:10.3390/ijerph16101843   www.mdpi.com/journal/ijerph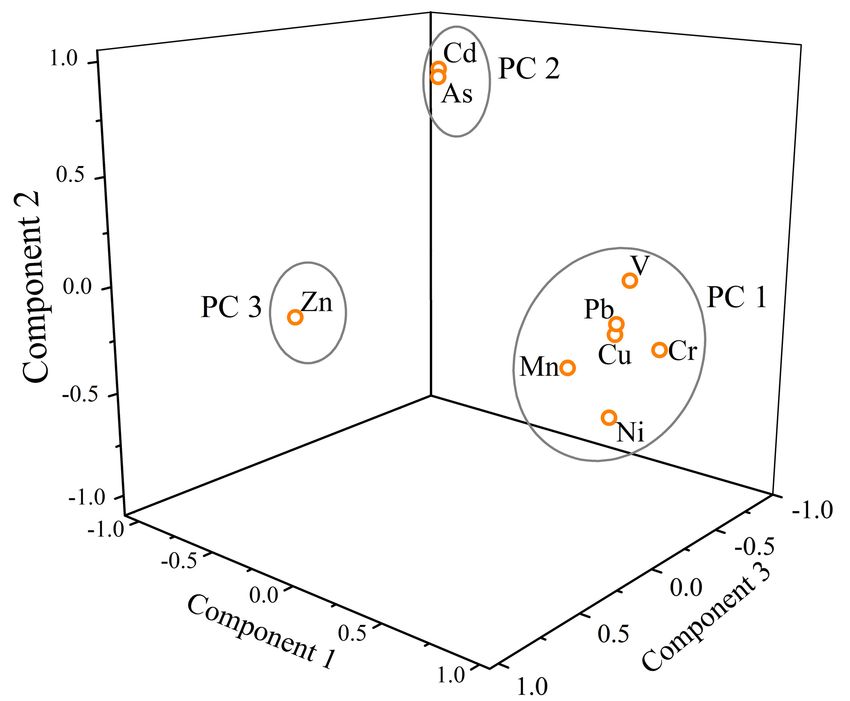
Int. J. Environ. Res. Public Health 2019, 16, 1843                                                   2 of 16

paid to heavy metals of the suspended particle phase than those of the dissolved phase. Furthermore, as
the major carrier and pre-sink of heavy metals in the fluvial environment [11], SPM in the aquatic system
is not a threat for humans as a rule, but the main carrier of land materials export to the ocean [11,12].
Previous studies suggested that the bed load at estuaries accounts for less than 10% of a river’s total
solids transported to the ocean and is often less than 1%, while more than 90% of solids are transported
in suspension [13,14]. In addition, heavy metals in river water tend to accumulate in SPM because of
its direct interface with the water, and the deposition of metal-adsorbed SPM is the primary process
for the accumulation of heavy metals in bed sediments [10]. Accordingly, the contaminated surface
bed sediment or deposited SPM might become re-suspended because of water flow disturbance [8,10].
This is a crucial process for the ecological risks of heavy metals across the sediment–water interface.
Therefore, numerous studies regarding heavy metals in SPM, their effects on the fluvial environment,
and the fluxes to the ocean have been published in various countries [4,6,11,12,15–20], including
China [8,10,14,21–23]. A case study in the multi-anthropogenic polluted river in the Gulf of Tunis
revealed that heavy metal (Pb, Cu, Zn, and Fe) pollution was mainly localized to commercial activities
and fishing [4]. The study on the Tigris River showed that the dissolved phase dominated the physical
speciation of many metals (low partition coefficients), but the Al, Fe, Pb, Th, and Ti exhibited high
particulate fractions due to the high SPM concentration [6]. Viers et al. [11] presented a new database
on the chemical composition (including heavy metals) of suspended matter in global rivers, together
with the associated heavy metal fluxes, and they also give a “snap-shot” of heavy metal fluxes for each
continent in order to assess the influence of human activities on natural geochemical cycles of heavy
metals in different environments. A two-year monitoring data of particulate metals (Cd, Cu, Ni, Zn, Fe,
Pb, Cr, and Mn) in an estuarine environment displayed no seasonal variation or any relationship with
the tide, and the large input of particulate metals was attributed as probably being due to the intensive
agriculture within the drainage basin [15]. Matsunaga et al. [19] explored the temporal variations in
metal enrichment in SPM during rainfall events in a rural stream. In the Lerma River, particulate Fe
and Mn originated predominantly from natural sources, whereas Cu, Zn, Cr, and Pb in SPM originated
mainly from anthropogenic sources [16].
      In terms of catchment management, identifying the contaminated level and ecological risk of
heavy metals is a prerequisite for pollution remediation. Many methods (such as enrichment factor,
anthropogenic metal flux, bioavailable metal index and toxic risk index) have been widely developed
to evaluate the contaminated levels, anthropogenic inputs, bioavailability and toxicity of heavy
metals in SPM or sediment [24]. The Zhujiang River is the largest river flowing into the South China
Sea [25]; it is the major water source for a local population of about 30 million and provides important
supports for the socio-economic development of southern China [26]. Since the intense anthropogenic
disturbance on the Zhujiang River, several studies have been performed to investigate the heavy metal
composition of the water [21,27], sediment [24,28–30], and SPM [8,21] in different reaches. These
studies distinguished the heavy metal temporal transport of SPM in the upper reaches of the Zhujiang
River and explored the partition coefficients of heavy metals between water and SPM in the tributaries
of the lower reaches of the Zhujiang River. However, these studies were insufficient for obtaining a clear
idea of the general status of the abundance and sources of heavy metals in SPM, and the water/particle
interaction behavior of heavy metals in the Zhujiang River from a whole basin perspective. In addition,
the risk assessment mainly focused on the bioavailability and toxicity of heavy metals in SPM (the
major carrier and pre-sink of heavy metals) [5,8,24,28,29,31], while the health risk of human exposure
has rarely been systematically reported up to now.
      A previous study investigated the dissolved heavy metals in river water of the entire riverine
system of the Zhujiang River [32]. However, it was impossible to get adequate SPM in all of the sites,
particularly during the dry season. In the present study, an investigation on nine heavy metal(loid)s
(V, Cr, Mn, Ni, Cu, Zn, As, Cd, and Pb) in 22 SPM samples in the Zhujiang River was conducted.
The aims of this study were: (i) to analyze the enrichment of heavy metal(loid)s in SPM; (ii) to explore
the behaviors of heavy metal(loid)s during water/particle interaction of the entire basin; (iii) to identify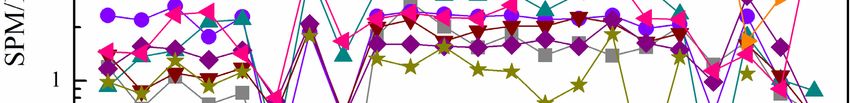
Int. J. Environ. Res. Public Health 2019, 16, x 3 of 17
Int. J. Environ. Res. Public Health 2019, 16, 1843 3 of 16
the sources of heavy metal(loid)s in SPM; and (iv) to assess the potential risk of heavy metal(loid)s in
SPM,
the particularly
sources of heavytometal(loid)s
evaluate theinhealth
SPM; risk
and of
(iv)human exposure
to assess firstly risk
the potential by referring
of heavy to the U.S. EPA
metal(loid)s in
(Environmental
SPM, Protection
particularly to evaluate theAgency) method.
health risk of human Theexposure
resultsfirstly
can bybereferring
applied to U.S.
to the increase
EPA
prevention–control
(Environmental efficiency
Protection of heavy
Agency) metal(loid)
method. pollution
The results can be as well as
applied to to prevent
increase hazardous heavy
prevention–control
metal(loid) pollution affecting the local people in the whole basin.
efficiency of heavy metal(loid) pollution as well as to prevent hazardous heavy metal(loid) pollution
affecting the local people in the whole basin.
2. Materials and Methods
2. Materials and Methods
2.1. Study Area
2.1. Study Area
The Zhujiang River (21°31′–26°49′ N, 102°14′–115°53′ E) is the largest river flowing into the
SouthTheChina
Zhujiang Riveris(21
Sea and the◦ 31 0 –26◦ 490 N, 102◦ 140 –115◦ 530 E) is the largest river flowing into the
major water source for the population of more than 30 million in
South China Sea and is the major
southern China [26,27]. As the elevation water source for thefrom
decreases population
northwest of more than 30 million
to southeast, in southern
the Zhujiang River
China
flows [26,27].
throughAsYunnan,
the elevation decreases
Guizhou, fromand
Guangxi northwest to southeast,
Guangdong the Zhujiang
provinces River flows
with a coverage areathrough
of 4.5 ×
Yunnan,
105 km2 Guizhou, Guangxi
(Figure 1). and Guangdong
The Zhujiang provinces
River basin with a coverage
is characterized area of to
by a tropical × 105 km2 (Figure
4.5subtropical monsoon 1).
The Zhujiang River basin is characterized by a tropical to subtropical monsoon
climate, where the annual temperature and annual precipitation range from 14 to 22 °C and 1200 to climate, where the
annual
2200 mm temperature and annual
[25]. Various rocks, precipitation range from
including carbonate rocks, 22 ◦ C and 1200
14 tometamorphic to 2200
rocks, mm [25].
detrital Various
sedimentary
rocks, including carbonate rocks, metamorphic rocks, detrital sedimentary rocks,
rocks, and magmatic rocks, are widely distributed in the Zhujiang River basin [25,26] (Figure and magmatic rocks,
1).
are widely
There are 24distributed
large damsinandthe212Zhujiang
medium River basin [25,26]
reservoirs located(Figure 1). There are
in the mid-lower 24 large
reaches dams
of the and
Zhujiang
212 medium
River [25]. reservoirs located in the mid-lower reaches of the Zhujiang River [25].
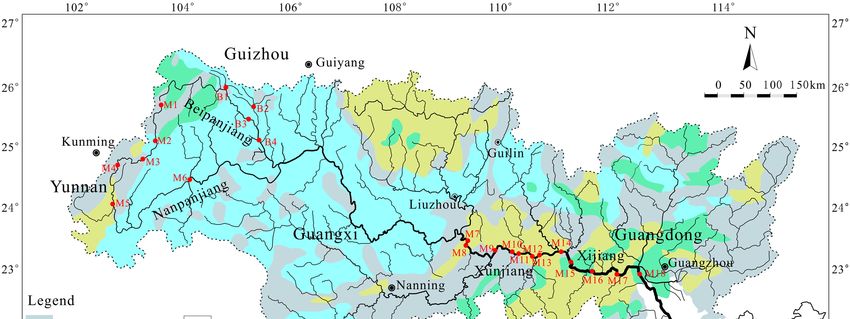
Figure1.1. Map
Figure Map showing
showing sampling
samplinglocations
locationsand
andsample
samplenumbers
numbersof
ofthe
theZhujiang
ZhujiangRiver.
River.
2.2.
2.2. Sample
SampleCollection
Collectionand
andAnalysis
Analysis
Based
Basedononthe
thelithology
lithologydistribution,
distribution,population
populationdistribution
distributionandandreservoir/dam
reservoir/damdistribution
distributionof of
the
the Zhujiang River basin, 22 sampling sites were selected (Figure 1). Ten sites werelocated
Zhujiang River basin, 22 sampling sites were selected (Figure 1). Ten sites were locatedat atthe
the
Nanpanjiang
Nanpanjiang River
River (NPR,
(NPR, M1
M1 toto M6)
M6) and
and Beipanjiang
Beipanjiang River
River (BPR,
(BPR, B1
B1 to
to B4)
B4) inin the
the upper
upper reaches
reachesof of
the Zhujiang River with widely distributed carbonates and a small population.
the Zhujiang River with widely distributed carbonates and a small population. Twelve sites were Twelve sites were
located
locatedatatXunjiang
Xunjiang(XUR,
(XUR,M7M7to toM13)
M13)and
andXijiang
Xijiang(XJR,
(XJR,M14
M14to toM18)
M18)ininthe
themid-lower
mid-lowerreaches
reachesof ofthe
the
Zhujiang
ZhujiangRiver,
River,where
wherethere areare
there large populations
large populations andandmany reservoirs/dams
many reservoirs/dams with with
metamorphic
metamorphicrock
and
rockmagmatic rock development.
and magmatic Accordingly,
rock development. a totalaoftotal
Accordingly, 22 river
of 22SPM
riversamples
SPM sampleswere collected from
were collected
the selected sites during July 2014 (wet season). The SPM samples in river water
from the selected sites during July 2014 (wet season). The SPM samples in river water were firstly were firstly filtered
through
filtered millipore nitrocellulose
through millipore membrane
nitrocellulose filters, and
membrane the SPMs
filters, and on
thethe filteronmembranes
SPMs were then
the filter membranes
removed by milli-Q water and dried at 55 ◦ C in the laboratory. The digestion method of SPMs was
were then removed by milli-Q water and dried at 55 °C in the laboratory. The digestion method of
modified
SPMs was from previousfrom
modified studies [21,33].studies
previous Briefly, [21,33].
100 mg of SPM sample
Briefly, 100 mg powder
of SPM wassample
digested with 1 was
powder mL
pure HF and
digested 3 ml
with pure
1 mL HNO
pure HF3 in
and a pre-cleaned
3 ml pure HNO PFA3(Perfluoroalkoxy)
in a pre-cleaned PFAsample jar (Savillex, Eden
(Perfluoroalkoxy) Prairie,
sample jar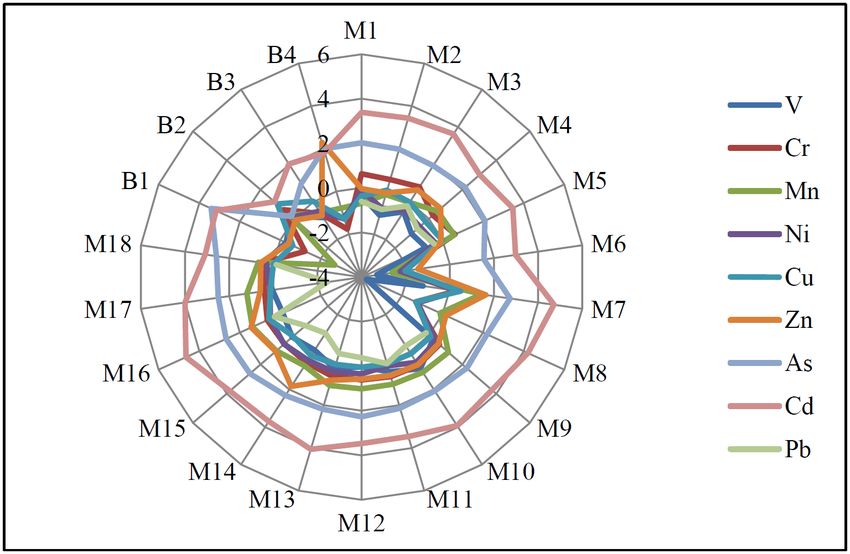
Int. J. Environ. Res. Public Health 2019, 16, 1843                                                                     4 of 16

MN, USA) at 140 ◦ C. After the samples were completely digested, 2 mL pure HNO3 was added twice
to break up residual fluorine compounds until evaporation to dryness. Finally, the remaining digest
was re-dissolved using 100 mL 3% HNO3 for the heavy metal(loid) analyses. The heavy metal(loid)s
(V, Cr, Mn, Ni, Cu, Zn, As, Cd, and Pb) of the digested solutions were determined by ICP-MS (Elan
DRC-e, Perkin Elmer, Waltham, Massachusetts, USA), and the aluminum for the enrichment factor
calculation was also detected by ICP-OES (Optima 5300DV, Perkin Elmer, Waltham, Massachusetts,
USA). All the samples and standards were analyzed in batches with a procedural blank. Relative
standard deviations (RSD) for heavy metal(loid)s were ±5%.

2.3. Assessment Method and Statistical Analysis

2.3.1. Enrichment Factor (EF)
     The EF normalizes the content of a heavy metal(loid)s to a conservative element, and has been
extensively used to assess the enrichment of heavy metal(loid)s quantitatively [20,24,33,34]. Here,
Al was approved as a reference element due to its extensive distribution in continental rocks and
scarcity in various pollution sources [35], and can be used to calculate the EF as follows [20,24]:
                                                              h                      i
                                       EF = [(Ci /Cref )SPM ]/ (Ci /Cref )background                                      (1)

where Ci is the concentration of the heavy metal(loid)s (mg kg−1 ), and Cref is the concentration of
the reference heavy metal(loid)s (mg kg−1 ). The (Ci /Cref ) ratio is calculated based on the local soil
background values. The soil background values of the Yunnan and Guizhou provinces were used
for NPR (M1 to M6), and BPR (B1 to B4) river reach samples, and the mean soil background values
of Guangdong and Guangxi provinces were used for the downstream samples (M7 to M18) [36].
The corresponding enrichment level categorizations of the EF value [24] are listed in Table 1.

      Table 1. Contamination and toxic risk categories based on enrichment factor (EF), geo-accumulation
      index (Igeo ) and toxic risk index (TRI).

    EF              Enrichment Level                 Igeo        Pollution Intensity         TRI          Toxic Risk
     5          extremely polluted

2.3.2. Geo-Accumulation Index (Igeo )
     The geo-accumulation index (Igeo ) is also applied to assess the heavy metal(loid) contamination
in SPM. This approach has been widely used in previous studies [8,20,37]. The Igeo is calculated as
follows [38,39]:
                                     Igeo = log 2 [Ci /(1.5 × Bi )]                                (2)

where Ci is the concentration of heavy metal i in the SPM (mg kg−1 ), Bi is the local soil background
concentration of metal i (mg kg−1 ), and the coefficient 1.5 in the equation is used to minimize the
effect of possible variations in the background values. The Igeo for each metal is classified using seven
(0–6 grades) enrichment classes [38] (Table 1).

2.3.3. Risk Assessment
     The toxic risk index (TRI) is applied to assess the integrated toxic risk (mainly the potential
ecological risk to aquatic organisms) based on both the threshold effect level (TEL) and the probable
effect level (PEL) of heavy metal(loid)s. Here, we selected consensus-based TEL and PEL values [40],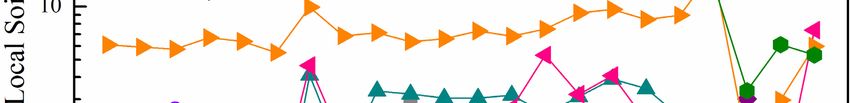
Int. J. Environ. Res. Public Health 2019, 16, 1843                                                                             5 of 16

which have been successfully used to assess the potential ecological risks of aquatic system trace
metal(loid)s in previous studies [5,24]. The TRI of the SPM is calculated by the following equation [5]:
                                                                         2              2  1/2
                               TRI = Σni=1 TRIi =              CiS /CiTEL        + CiS /CiPEL /2                                  (3)

where CiS is the concentration of metal i (mg kg−1 ) in the SPM, CiTEL and CiPEL are the TEL and PEL of
metal i (mg kg−1 ), respectively. The toxic risks are classified into five categories (Table 1) based on the
TRI calculation [5].
     The health risk of human exposure to SPM of the Zhujiang River was evaluated by referring
to the U.S. EPA method [41], which considers the amount of metal(loid)s entering the body and the
relationship between the undesirable health effects and reference dose. The non-carcinogenic risk is
calculated and assessed by the hazard quotient (HQ) and hazard index (HI, the potential hazard to
the human health). In general, direct ingestion and dermal absorption are the two main exposure
pathways to heavy metal(loid)s in the aquatic system for human beings [42,43]. Since humans rarely
drink water with SPM directly (direct ingestion), here we considered that dermal absorption is the
only exposure pathway for heavy metal(loid)s in the SPM. The HQ is the ratio between exposure via
each pathway and the reference dose (RfD). HI is the sum of the HQs for each heavy metal from all
the pathways (in this study, HI is equal to HQ because there is only one pathway). If the HQ or HI
exceeds 1, non-carcinogenic risk effects on human health are a concern, and further study is necessary.
In contrast, there are no deleterious effects when HQ or HI is less than 1 [37,43]. The HQ and HI are
calculated as follows [37,44]:

                        ADDdermal = (C × EF × ED × SA × AF × ABS × 10−6 )/(BW × AT)                                               (4)

                                                         HQ = ADD/RfD                                                             (5)

                                                               HI = ΣHQs                                                          (6)

where ADDdermal is the average daily doses by dermal absorption (mg kg−1 day−1 ); RfD is the reference
dose (mg kg−1 day−1 ) [37,45], and the other parameters and values in these Equations (4)–(6) are shown
in Table 2.

                Table 2. Values and factors used for non-carcinogenic hazard health risk assessment.

   Parameter           Physical Meaning                  Unit                    Children           Adults          Reference
                    Concentration of heavy
        C                                              mg kg−1                                                      This study
                     metal(loid)s in SPM
       EF            Exposure frequency               day year−1               350                    350              [41]
       ED             Exposure duration                  year                    6                     30              [41]
       SA             Exposed skin area                  cm2                   1800                   5000             [37]
       AF              Adherence factor              mg cm−2 day−1               1                      1              [37]
                                                                        0.03 for As; 0.001     0.03 for As; 0.001
       ABS         Dermal absorption factor                -                                                         [37,44]
                                                                        for other metals       for other metals
       BW            Average body weight                 kg                     15                    55.9             [37]
       AT               Average time                     day                365 × ED               365 × ED          [37,44]

2.3.4. Multivariate Analysis
     Statistical approaches, including a correlation matrix and principal component analysis (PCA),
were applied to analyze the dataset to obtain descriptive statistics and to explore the possible sources
of the heavy metal(loid)s. PCA is the most common multivariate statistical method used to explore
the associations and origins of heavy metal(loid)s [46], which could reduce the dimensionality of the
dataset to several influencing factors while trying to preserve the relationships presented in the original
data [43,47]. The factor contribution or variables with minor significance attained from PCA are
further reduced by the varimax rotation method [43]. The results of PCA, including the factor loadings,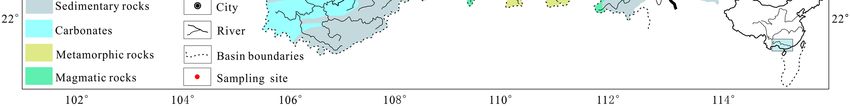
Int. J. Environ. Res. Public Health 2019, 16, 1843                                                                     6 of 16

eigenvalues, variance, and communalities, constitute the component matrix. The result of PCA is
acceptable if the communalities value is close to 1. The factor loadings (the correlation coefficients
between each principal component and initial variable) are classified as “strong”, “moderate”, and
“weak” according to the absolute loading values of >0.75, 0.75–0.50, and 0.50–0.30, respectively [48].
In this study, PCA is performed for heavy metal(loid)s of SPM in the Zhujiang River to distinguish
their possible origins. The suitability of the dataset for PCA was checked using the Kaiser-Meyer-Olkin
(KMO) test and Bartlett’s sphericity test (p < 0.001) [47]. To avoid the numerical ranges of the original
variables, the dataset was first standardized by a z-scale transformation.

2.4. Data Processing Method
    For the statistical analyses of obtained data, Pearson’s correlation coefficient and principal
component analysis (PCA) were performed using SPSS 21.0 (IBM, Armonk, NY, USA). The data were
graphed with Origin 8.1 (EA, Redwood City, CA, USA) and Microsoft Office 2010 (Microsoft, Redmond,
WA, USA) for Windows.

3. Results and Discussion

3.1. Abundance of Heavy Metal(loid)s in SPM
      The concentrations of heavy metal(loid)s in SPM of the Zhujiang River are shown in Table 3.
The Kolmogorov–Smirnov (K–S) test, which is a non-parametric test, was used to test the normal
distribution of our data. The test results show that all parameters are normally distributed in the
Zhujiang River (K–S test significance >0.1), and the arithmetical mean values of all parameters are
suitable for comparison [43]. Therefore, the nine selected heavy metal(loid)s in this study can be
ranked by abundance as follows: Mn (982.4 mg kg−1 ) > Zn (186.8 mg kg−1 ) > V (143.6 mg kg−1 ) > Cr
(129.1 mg kg−1 ) > As (116.8 mg kg−1 ) > Cu (44.1 mg kg−1 ) > Ni (39.9 mg kg−1 ) > Pb (38.1 mg kg−1 )
> Cd (3.8 mg kg−1 ). Mn and Zn are the most abundant metals, with maximums of 1487.1 and
732.8 mg kg−1 , respectively, compared to the soil background values of the Zhujiang River basin [36].
The concentrations of five metal(loid)s, including Cr, Mn, Zn, As, and Cd, in SPM are much higher than
all soil background values, while the contents of the remaining metals are between the soil background
values of several provinces. Cd concentration is 5.8–23.7 times higher than the soil background
concentration values of the whole basin which can be considered the strongest enriched metal in SPM
relative to the soil. Cr, Mn, Zn, and As concentrations are elevated 1.2–7.9 times the soil background
concentration values.

      Table 3. Descriptive statistics of heavy metal(loid)s in suspended particulate matter (SPM) and the
      SPM concentration of the Zhujiang River (n = 22), and the local soil background values of the Zhujiang
      River basin.

    Parameter       V         Cr        Mn           Ni      Cu      Zn      As     Cd       Pb      SPM Concentration
      Min           10.9      20.7    152.7          13.1   13.6     49.3    33.5    2.1     8.2              8.0
      Max          270.3     221.5    1487.1         62.5   96.4    732.8   317.6    8.9    54.7             944.0
      Med          150.5     147.7    1103.6         41.6   36.3    139.1   109.2    3.5    38.6             138.0
      AM           143.6     129.1    982.4          39.9   44.1    186.8   116.8   3.8     38.1             177.2
       SD          61.5       48.8    379.7          12.0   19.9    138.1    51.6    1.6    11.6             205.5
      SGZ          138.8      95.9    794.0          39.1   32.0     99.5    20.0   0.66    35.2               —
      SYN          154.9      65.2    626.0          42.5   46.3     89.7    18.4   0.22    40.6               —
     SGDGX          97.6      66.3    362.5          20.5    22.4    61.5    14.7   0.16     30.0              —
      TEL            —        43.4      —            22.7   31.6    121.0     9.8    1.0    35.8               —
      PEL            —       111.0      —            48.6   149.0   459.0    33.0   5.0     128.0              —
     K-S test      0.96       0.29     0.55          0.53   0.32     0.14    0.16   0.10    0.65              0.22
      Note: Units in mg kg−1 for heavy metal(loid)s, mg L−1 for SPM concentration; Min, minimum; Max, Maximum;
      Med, median; AM, arithmetical mean; SD, arithmetical standard deviation; SGZ, soil background values of Guizhou
      province [36]; SYN, soil background values of Yunnan province [36]; SGDGX, mean soil background values of
      Guangdong and Guangxi provinces [36]; TEL, threshold effect level [40]; PEL, probable effect level [40]; K–S test,
      Kolmogorov–Smirnov test; —, no data.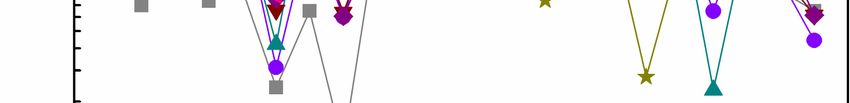
Int. J. Environ. Res. Public Health 2019, 16, 1843                                                                     7 of 16

     On a global scale (Table 4), V, Cr, and Zn are generally close to the world average, Mn, Ni, Cu, and
Pb are lower than the world average, while As and Cd are much higher than the world average [11].
Compared with the rivers in Asia (China), the contents of V, Cr, and Mn in SPM of the Zhujiang River
are similar, Ni, Cu, and Pb are slightly lower, while Zn is slightly higher. Additionally, the metals (Cr,
Ni, Cu, Zn, and Pb) easily affected by human activities in SPM of the Zhujiang River are much lower
than those in Europe (with many developed countries), which partly reflects the impact of economic
development on heavy metal pollution in the fluvial environment.

                   Table 4. Comparison of heavy metals in SPM of global rivers (unit in mg kg−1 ).

                    Rivers                           V     Cr         Mn        Ni       Cu       Zn     As      Cd    Pb
      Zhujiang River (this study)                143.6    129.1     982.4      39.9     44.1     186.8   116.8   3.8   38.1
          World River average                    129.0    130.0     1679.0     74.5     75.9     208.0   36.3    1.6   61.1
     South American River average                131.0     79.0      700.0     46.0     59.0     184.0    —      —     76.0
     North American River average                188.0    115.0     1430.0     50.0     34.0     137.0    —      —     22.0
      Asia (Russia) River average                128.0    260.0     5767.0     123.0    145.0    300.0    —      —     35.0
       Asia (China) River average                135.0    117.0     970.0      68.0     53.0     145.0    —      —     64.0
          Africa River average                   116.0    130.0     1478.0     78.0     53.0     130.0    —      —     46.0
         Europe River average                    85.0     164.0     1884.0     66.0     172.0    346.0    —      —     71.0
                              Note: The data for global rivers are from Viers et al. [11]; —, no data.

3.2. Water/Particle Interaction and Contamination Assessment

3.2.1. Water/Particle Interaction
      The partition coefficient (Kd ) is the ratio of the element content in solid form (SPM in this
study) to dissolved content in water (ppm/ppm) [21], which provides empirical information about the
water/particle interaction for trace metals [8,49] and is usually expressed as lgKd . A high lgKd value
signifies a powerful affinity of the metals with SPM [15]. In combination with the dissolved heavy
metal concentration in the same water samples of Zhujiang River reported in our early work [32],
the lgKd values of the seven metals are calculated and summarized in Table 5. The lgKd values of V, Cr,
Mn, Ni, Cu, Cd, and Pb ranged from 3.6 to 5.0, 3.3 to 4.5, 4.7 to 7.0, 3.7 to 4.5, 2.9 to 5.3, 4.6 to 5.5, and
5.4 to 6.2, respectively. All the lgKd values exceeded 2.9, indicating the powerful adsorptive ability of
heavy metals for the SPM. The mean partition coefficients of seven metals decreased in the order of Mn
> Pb > Cd > V ≈ Cu > Cr ≈ Ni (Table 5); mainly controlled by the ionic radius and particle reactivity of
these metals and the particle size of the SPM [8,23,49]. Compared to some rivers in the world, the lgKd
values of seven metals are within the range of world river values [6,8,50–53] (Table 5). The partition
coefficients of Cr, Cu, and Cd are comparable to some rivers in China [52], particularly the Beijiang
River [8], a significant tributary of the lower reaches of the Zhujiang River. However, the lgKd values
of Mn, Ni, and Pb are relatively higher than those of rivers in China [8,52]. It is noteworthy that all the
mean lgKd values (except Pb) in the present study are lower than the monthly mean values of the upper
Zhujiang River [21], which indicates the possible seasonal variations in water/particle interaction.
Int. J. Environ. Res. Public Health 2019, 16, 1843 8 of 16
Table 5. The partition coefficients (lgKd ) of heavy metals in the Zhujiang River and global rivers.
River V Cr Mn Ni Cu Cd Pb
Min 3.6 3.3 4.7 3.7 2.9 4.6 5.4
Zhujiang River
Max 5.0 4.5 7.0 4.5 5.3 5.5 6.2
(this study)
AM 4.6 4.2 6.3 4.2 4.6 5.0 5.9
Rivers in US — 5.1 — 4.6 4.7 4.7 5.6
Tigris River — 6.7 6.6 6.5 6.3 6.3 6.7
Day
Int. J. Environ. Res. Public River
Health 2019, 16, x — 5.5 5.0 5.3 5.4 5.7 5.3 8 of 17
Sava River 4.7 4.2 5.9 4.4 3.9 3.0 4.6
Yangtze River — 4.1 5.0 3.9 4.1 4.2 5.2
Upper Zhujiang River 5.4 5.6 6.6 5.3 4.9 5.1 5.7
Jialingjiang River — 4.3 5.0 3.8 4.2 4.8 5.1
Note: Min, minimum; Max, maximum;—
Beijiang River AM, arithmetical
— — mean; —,
— no data; in US [53]
4.7Rivers4.8 5.2; Tigris
River [6];Upper River [51]
Day Zhujiang ; Sava River
River 5.4[50]; Yangtze
5.6 River
6.6 and5.3Jialingjiang
4.9 5.1 [52];5.7
River Beijiang
River[8]; Upper Zhujiang River [21] .
Note: Min, minimum; Max, maximum; AM, arithmetical mean; —, no data; Rivers in US [53]; Tigris River [6]; Day
River [51]; Sava River [50]; Yangtze River and Jialingjiang River [52]; Beijiang River [8]; Upper Zhujiang River [21].
3.2.2. Enrichment Factor
3.2.2. Enrichment Factor
The abundance of heavy metal(loid)s in SPM is normalized by the corresponding soil
The abundance
background values [36]of heavy
in thismetal(loid)s
study (Figurein SPM is normalized
2). Most by had
metal(loid)s the corresponding
a soil-normalizedsoil value
background
which
values [36] inone
approached thisand
study (Figure
ranged from2). 0.1
Mostto metal(loid)s
4.1, with thehad a soil-normalized
exception of Zn, As andvalue which
Cd. approached
Soil-normalized
one andofranged
values As and fromCd0.1 to 4.1,
were 1.7with the and
to 15.9 exception
3.3 toof39.7,
Zn, As and Cd. Soil-normalized
respectively, values
and indicate that all of
theAsSPM
and
Cd were are
samples 1.7 to 15.9 andin3.3
enriched to 39.7, respectively,
metal(loid)s of As andand Cd.indicate
Zn shows thatthe
allsoil-normalized
the SPM samples are enriched
value of varying in
metal(loid)s
degrees (0.8 of
to As
7.4),and Cd. is
which Znmore
shows the soil-normalized
obvious valuereach
in the headstream of varying
(M1 to degrees
M6, B1(0.8 to 7.4),
to B4) andwhich
the XJRis
more obvious in
reach (M14 to M18). the headstream reach (M1 to M6, B1 to B4) and the XJR reach (M14 to M18).
Figure 2.
2. Abundances
Abundancesofofnine
nineheavy
heavy metal(loid)s
metal(loid)s in SPM
in SPM normalized
normalized to local
to local soil insoil
thein the Zhujiang
Zhujiang River.
River.
In order to quantitively evaluate the enrichment degree of heavy metal(loid)s in the Zhujiang
RiverInSPM,
orderthetoenrichment
quantitively factor (EF) was
evaluate theapplied in thedegree
enrichment presentofstudy.
heavyAsmetal(loid)s
shown in Figurein the 3, Zhujiang
the mean
EF values
River SPM, ofthe
the enrichment
SPM in all sites decreased
factor (EF) wasinapplied
the order in of
theCd (23.3) >study.
present As (11.0) > Zn (3.2)
As shown > Mn (2.1)
in Figure 3, the>
Cr (1.8) > Cu (1.6) > Ni (1.4) > V (1.3) > Pb (0.9), indicating extremely severe
mean EF values of the SPM in all sites decreased in the order of Cd (23.3) > As (11.0) > Zn (3.2) > Mn enrichment of Cd and
As.
(2.1)In the(1.8)
> Cr current
> Custudy,
(1.6) >theNi EF values
(1.4) of Cd
> V (1.3) > Pbin (0.9),
most indicating
sampling sites exceed
extremely 10 (severe
severe enrichment,
enrichment of Cd
Table
and As.1), and
In thea few sampling
current study, sites
theexceed 50 (M6,
EF values of M8,
Cd and B1), which
in most samplingcan be defined
sites exceedas10 extremely
(severe
severe enrichment
enrichment, (Table
Table 1), and 1).
a fewThesampling
EF values of As
sites mainly
exceed rangeM8,
50 (M6, from
and5 B1),
to 10, which
which canis a
bemoderately
defined as
severe enrichment.
extremely Cr, Mn, Ni,
severe enrichment Cu, and
(Table Zn are
1). The EF slightly
values of enriched,
As mainly with mean
range EF values
from 5 to 10,between
which is1.4 a
and 3.2, while
moderately the remaining
severe enrichment. metals
Cr, Mn, (V and Pb) and
Ni, Cu, show Znno enrichment
are characteristics
slightly enriched, with mean in most of the
EF values
between < 1).
sites (EF 1.4 andIt 3.2,
should
whilebe the
noted that the metals
remaining EF values of VPb)
(V and (6.2),
showCr (3.3), Cu (5.0), and
no enrichment As (79.8) are
characteristics in
highest
most of at B1,
the and(EF
sites the
Int. J. Environ. Res. Public Health 2019, 16, 1843 9 of 16
respectively) [21], most of the metals in our study have a relatively lower EF value, indicating that
although the lgKd values in this study (wet season) reflect the powerful adsorption capacity of SPM
for heavy metals, there may be stronger water/particle interaction at the monthly scale, particularly
particle adsorption. Furthermore, compared with the mean EF values of 11.0, 12.5, 10.0, 5.0, 19.6, and
19.6 for Cr, Ni, Cu, Zn, Cd, and Pb, respectively, in the polluted river (Soan River, Pakistan) [20], the
Int. J. Environ. Res. Public Health 2019, 16, x 9 of 17
enrichment
Int. degree
J. Environ. Res. Publicof heavy
Health metals
2019, 16, x in the Zhujiang River SPM is relatively slight. 9 of 17
Figure 3. Enrichment factors (EF) of SPM in the Zhujiang River; (a) headstream, (b) downstream.
Figure
Figure 3.
3. Enrichment
Enrichment factors
factors (EF)
(EF) of
of SPM
SPM in
in the
the Zhujiang
Zhujiang River;
River; (a)
(a) headstream,
headstream, (b)
(b) downstream.
downstream.
3.2.3. Geo-Accumulation Index
3.2.3. Geo-Accumulation
3.2.3. Geo-Accumulation Index Index
Based on the local soil background values (Table 3), the contamination degrees of heavy
Based on
Based
metal(loid)s on the
in local
the
SPM soilthe
local
of background
soil background
Zhujiang values (Table
Rivervalues 3), the contamination
(Table
are assessed 3),
by the degrees of degrees
the contamination
geo-accumulation heavy metal(loid)s
index ofmethod
heavy
in
(Equation (2)). The mean value of Igeo shows a contamination level order similar to EF (Cd > As >(2)).
SPM
metal(loid)s of thein Zhujiang
SPM of River
the are
Zhujiang assessed
River byarethe geo-accumulation
assessed by the index method
geo-accumulation (Equation
index method Zn
The
> Mnmean
(Equation value
> Cr(2)).
> CuThe ≈ofNiIgeo
mean> Vshows
≈value aofcontamination
Pb, FigureIgeo shows
4). Theamost level order similar
contamination
contaminated levelheavy
order (Cd > As
to EFmetal(loid)s
similar to EF>are
Zn
(CdCd>>Mnand>
As Cr
> As,
Zn
> Cu
>with ≈
Mn >mean Ni >
Cr > Cu V ≈ Pb,
Igeo ≈values Figure
Ni > V of ≈ Pb, 4). The
3.4Figure
and 2.1, most
4). The contaminated
most contaminated
respectively heavy
(Figure 4),heavymetal(loid)s are
metal(loid)s
revealing Cd and
heavilyarepolluted As,
Cd and andwith
As,
mean
with I
mean
geo values
I of 3.4
values and
of 2.1,
3.4 respectively
and 2.1, (Figure
respectively 4), revealing
(Figure 4), heavily
moderately to heavily polluted levels. The mean value of Igeo for Zn (0.5), Mn (0.3), and Cr (0.1)
geo revealing polluted
heavily and moderately
polluted and
to heavilythese
moderately
classifies polluted
to heavily
metalslevels.
as The mean
polluted
lightly levels.value
polluted. The of Iremaining
mean
The geo for Zn of
value (0.5),
IgeoMn
metals for (0.3),
(Cu,ZnNi, and
(0.5), Cr
Mn(0.1)
V, and (0.3),
Pb) classifies
andmean
have Cr these
(0.1)
Igeo
metals
classifies as lightly
these polluted.
metals as The
lightly remaining
polluted. metals
The (Cu,
remaining Ni, V,
metalsand Pb)
(Cu,
values of less than 0, indicating the unpolluted level (Figure 4). The mean Igeo values of the presenthave
Ni, V, mean
and I
Pb)geo values
have meanof less
I geo
than
values 0,ofindicating
less than the
0, unpolluted
indicating the level (Figure
unpolluted 4).
level The mean
(Figure 4). IThe
geo
study are consistently lower than those of the Beijiang River, an important tributary of the lower values
mean of
Igeo the present
values of study
the are
present
consistently
study
Zhujiangare River,lower
consistently than
with those of
lower
several the those
than Beijiang
polymetallic River,
ofmines an important
the Beijiang
and River,
metal tributary
an important
smelting of thetributary
enterprises lower
(the Zhujiang
meanof the River,
lower
values of
with several
Zhujiang polymetallic
River, with mines
several and metal
polymetallic smelting
mines andenterprises
metal (the
smelting mean values
enterprises
Igeo are 2.1, 2.7, 3.1, 7.0, and 1.5 for Cu, Zn, As, Cd, and Pb, respectively) [8], revealing that the of I
(the
geo are
mean 2.1, 2.7,
values 3.1,
of
I7.0, and2.1,
geo are
pollution 1.5intensity
for
2.7,Cu,3.1,Zn, As,and
of7.0,
heavy Cd, andfor
1.5 Pb,Cu,
metal(loid)s respectively)
Zn,
in SPM As,isCd,[8],and
revealing
assuaged Pb, thatvarying
the pollution
byrespectively)
the intensity
[8], revealing
landscape of heavy
that
setting of the
the
metal(loid)s
pollution in
intensitySPM ofis assuaged
heavy by the
metal(loid)s varying
in SPM landscape
is assuaged setting
by
whole Zhujiang River basin. This could be further confirmed by the comparison with polluted of
the the whole
varying Zhujiang
landscape River
setting basin.
of the
This
riverscould
whole be further
Zhujiang
[20]. River confirmed
basin. This by the comparison
could be further with polluted by
confirmed rivers
the[20].
comparison with polluted
rivers [20].
Figure4.
Figure 4. Geo-accumulation
Geo-accumulation index
index (I(Igeo
geo) of heavy metal(loid)s of the SPM.
) of heavy metal(loid)s of the SPM.
Figure 4. Geo-accumulation index (Igeo) of heavy metal(loid)s of the SPM.
3.3. Origins of Heavy Metal(loid)s in the SPM
3.3. Origins of Heavy Metal(loid)s in the SPM
3.3.1. Correlation Analysis
3.3.1. Correlation Analysis
A Pearson correlation matrix was employed to distinguish correlations between the nine heavyInt. J. Environ. Res. Public Health 2019, 16, 1843 10 of 16
3.3. Origins of Heavy Metal(loid)s in the SPM
3.3.1. Correlation Analysis
A Pearson correlation matrix was employed to distinguish correlations between the nine heavy
metal(loid)s of the SPM in the Zhujiang River (Table S1). The heavy metals with high correlation
coefficients in the aquatic system could have similar sources, migration processes and chemical
behavior [43,54]. In the current study, Cr, Mn, Ni, Cu, and Pb are remarkably positively correlated
with each other (p < 0.01), indicating that these metals may be derived from the same source. Strong
positive correlations are also observed between As and Cd (0.780), but these are poorly correlated with
the remaining metals, suggesting that the sources of As and Cd are different from those metals. V is
only significantly correlated with Cr (0.741), while Zn is not correlated with any metal (Table S1).
3.3.2. Principal Component Analysis
In this study, PCA with the varimax rotation method was performed for heavy metal(loid)s of SPM
in the Zhujiang River. There are three principal components (PC, eigenvalues >1) that are extracted
and summarized in Table 6. PC 1 explains 44.51% of the total variance and predominantly includes
V, Cr, Mn, Ni, Cu, and Pb. PC 2 explains 22.36% of the total variance with significant loadings of As
and Cd. PC 3 explains 12.33% of the variance which is only contributed by Zn, and most of the heavy
metal(loid)s exhibit a strong loading in their PCs (loading values >0.75) [48,55]. In total, these three
PCs account for 79.19% of the total variance and are presented in a three-dimensional space, as shown
in Figure 5. For PC 1, V is from lithophile elements [56], and Mn, Ni, and Cr are from natural sources
of rock weathering and subsequent pedogenesis [24,57]. Although urban and industrial activities such
as mining, metal smelting, and automobile exhausts can be the primary source of Cu and Pb [58],
the lower EF values of Cu (1.6) and Pb (0.9) (Figure 3) indicate that the contribution of anthropogenic
sources is limited [7,20]; hence, we attribute PC 1 to the natural origins controlled by geology and
lithology. There are two metal(loid)s (As and Cd) with positive loadings on PC 2, and the correlation
analysis suggests that the sources of As and Cd are different from those metals in PC 1. Considering
the extremely high EF values of As (11.0) and Cd (23.3), we conclude that PC 2 is mainly contributed
by anthropogenic origins in the basin [20,59]. In addition, Zn is the sole contributor to PC 3 and is not
correlated with any metal (Table S1). In combination with the moderate enrichment of Zn (EF = 3.2),
PC 3 can be attributed to mixed sources of geologic and anthropogenic origins.
Table 6. Varimax rotated component matrix for heavy metal(loid)s of SPM in the Zhujiang River.
Variable PC 1 PC 2 PC 3 Communalities
V 0.68 0.05 −0.31 0.56
Cr 0.94 −0.17 −0.16 0.94
Mn 0.80 −0.16 0.29 0.75
Ni 0.83 −0.45 0.03 0.89
Cu 0.74 −0.14 −0.13 0.58
Zn −0.06 0.04 0.94 0.89
As −0.16 0.94 −0.01 0.91
Cd −0.10 0.92 0.05 0.85
Pb 0.86 −0.02 0.05 0.75
Eigenvalues 4.01 2.01 1.11
Variance (%) 44.51 22.36 12.33
Cumulative (%) 44.51 66.86 79.19
Note: Extraction method, principal component analysis; Rotation method, Varimax with Kaiser normalization; the
“bold” values mean the factor loadings (the correlation coefficients between PC and initial variable) are “strong” or
“moderate”.Int. J. Environ. Res. Public Health 2019, 16, 1843 11 of 16
Int. J. Environ. Res. Public Health 2019, 16, x 11 of 17
Figure 5. 3D plot of scores for heavy metal(loid)s obtained from PCA results of SPM in the Zhujiang
Figure 5. 3D plot of scores for heavy metal(loid)s obtained from PCA results of SPM in the Zhujiang River.
River.
3.4. Potential Risk Assessment and Heavy Metal(loid) Export Budget
3.4. Potential Risk Assessment and Heavy Metal(loid) Export Budget
3.4.1. Toxic 3.4.1.
RiskToxic
Index (TRI)
Risk Index (TRI)
AccordingAccordingto MacDonald to MacDonald[40],[40],
when whenthethenegative
negative effects areare
effects less less
than 10%
thanwithin
10%the minimal
within the minimal
effect range, the TEL is considered reliable, while the PEL is considered reliable if the negative effects
effect range,exceed
the TEL is considered reliable, while the PEL is considered reliable
65% of the probable effect range [5,40]. Thus, the TRI integrating the TEL and PEL, does not
if the negative effects
exceed 65%considerof the only
probable effect range [5,40]. Thus, the TRI integrating the TEL
the acute toxicity but also the lasting chronic toxic effects of heavy metals [24]. Based and PEL, does not
on the consensus TEL and PEL values [40] in (Table 3) and Equation
consider only the acute toxicity but also the lasting chronic toxic effects of heavy metals [24]. Based on (3), the TRI of seven
metal(loid)s were calculated to evaluate the total toxic risk of both the acute and chronic toxic effects
the consensus TEL and PEL values [40] in (Table 3) and Equation (3), the TRI of seven metal(loid)s
of SPM heavy metal(loid)s; V and Mn were excluded from the TRI calculations due to the lack of
were calculated TEL andto evaluate
PEL values.the total toxic
As shown risk6, of
in Figure theboth the acute
TRI values and
of the 22 chronic
sites range from toxic9.5 effects of SPM heavy
(M6) to 32.9
metal(loid)s;(B1), V and
with Mna mean were
valueexcluded from the
of 17.9, indicating TRI calculations
considerable due
toxic risk for toofthe
most thelack
sites of
(15TEL< TRIand
≤ 20).PEL values.
As shown inAdditionally,
Figure 6, the threeTRI
sitesvalues
(M7, M16,of and
theB1,
22TRI > 20)
sites present
range very9.5
from high(M6)
toxic to
risk, while
32.9 low with
(B1), toxic risk
a mean value
is observed at M6 (5 < TRI ≤ 10) (Figure 6). In contrast to the EF and Igeo values, the mean TRI of
of 17.9, indicating considerable toxic risk for most of the sites (15 < TRI ≤ 20). Additionally, three
individual metal(loid)s follow a decreasing order of As (8.8) > Cd (2.8) > Cr (2.3) > Ni (1.3) > Zn (1.1) >
sites (M7, M16, and
Cu (1.0) > PbB1, TRI
(0.6), > mean
with 20) present veryofhigh
contributions 48.3 ±toxic
10.4%,risk,
15.6 ±while low± 5.5%,
4.3%, 13.0 toxic7.7 risk is observed
± 3.0%, 6.3 ± at M6
(5 < TRI ≤ 10) 4.5%, 5.8 ± 3.0%,
(Figure 6). and 3.3 ± 2.1%,to
In contrast respectively,
the EF and to the
IgeoTRI, indicating
values, thethat
meanAs accounts
TRI of for the majority
individual metal(loid)s
of the overall SPM toxicity. The considerable contributions of As and Cd to the TRI are attributed
follow a decreasing order of As (8.8) > Cd (2.8) > Cr (2.3) > Ni (1.3) > Zn (1.1) > Cu (1.0) > Pb (0.6),
mainly to their relatively low TEL and high concentration in SPM. This highlights the potential
with mean toxicity
contributions
of SPM in of the48.3 ± 10.4%,
Zhujiang 15.6two
River, with ± 4.3%, ± 5.5%,
13.0 (As
metal(loid)s and Cd) 7.7 ± 3.0%,more
deserving ± 4.5%, 5.8 ± 3.0%,
6.3concern.
and 3.3 ± 2.1%, respectively, to the TRI, indicating that As accounts for the majority of the overall
SPM toxicity. The considerable contributions of As and Cd to the TRI are attributed mainly to their
relatively low TEL and high concentration in SPM. This highlights the potential toxicity of SPM in the
Zhujiang River, with two metal(loid)s (As and Cd) deserving more concern.
Int. J. Environ. Res. Public Health 2019, 16, x 12 of 17
Figure
Figure 6. The
6. The toxic
toxic riskrisk index(TRI)
index (TRI)of
ofheavy
heavy metal(loid)s
metal(loid)s ofof
SPM in the
SPM Zhujiang
in the River.River.
Zhujiang
3.4.2. Health Risk Assessment
To better assess the health risk of human exposure to SPM of the Zhujiang River, the hazard
index (HI) for the selected heavy metal(loid)s is calculated based on the reference dose (RfD) of each
metal [37,45,60] (Table S2). The mean HI values are shown in Figure 7, and the HI calculated resultsInt. J. Environ. Res. Public Health 2019, 16, 1843 12 of 16
Figure 6. The toxic risk index (TRI) of heavy metal(loid)s of SPM in the Zhujiang River.
3.4.2. Health Risk Assessment
3.4.2.
To Health
better Risk Assessment
assess the health risk of human exposure to SPM of the Zhujiang River, the hazard
index (HI)Tofor the selected
better assess theheavy
healthmetal(loid)s
risk of human is exposure
calculated to based
SPM ofonthetheZhujiang
reference dosethe
River, (RfD) of each
hazard
index (HI) for the selected heavy metal(loid)s is calculated based on the reference
metal [37,45,60] (Table S2). The mean HI values are shown in Figure 7, and the HI calculated results for dose (RfD) of each
each metal
site are [37,45,60] (Table in
summarized S2).Table
The mean
S2. ItHI valuesbe
should are shown
noted in Figure
that mean HI 7, and the HI
values of calculated
As exceedresults
1 for both
for each site are summarized in Table S2. It should be noted that mean HI values of As exceed 1 for
children (3.3) and adults (2.4), indicating that non-carcinogenic effects may occur. For both adults and
both children (3.3) and adults (2.4), indicating that non-carcinogenic effects may occur. For both
children, the HI for all the metals (except As) are less than 1 (Figure 7, Table S2), indicating that for these
adults and children, the HI for all the metals (except As) are less than 1 (Figure 7, Table S2),
metals, little hazard is presented through the only exposure pathway—dermal absorption—in the whole
indicating that for these metals, little hazard is presented through the only exposure
basinpathway—dermal
area. In general, absorption—in
children have the a higher
whole HI value
basin area.than adults (Figure
In general, children 7), indicating
have a higher HIthat children
value
face greater
than adults serious health
(Figure risks duethat
7), indicating to SPM heavy
children face metals than adults.
greater serious Additionally,
health risks due to SPM theheavy
previous
studies concluded
metals that negative
than adults. Additionally,health
theeffects may
previous occurconcluded
studies for HI valuesthat >0.1 in the
negative child
health cohort
effects [37,61].
may
occur for HI values >0.1 in the child cohort [37,61]. Consequently, the V and
Consequently, the V and Cr (with mean HI values of 0.24 and 0.25 for children, Table S2) exposure Cr (with mean HI values
to theofSPM0.24 isand 0.25 for children,
non-negligible in thisTable
study. S2)Considering
exposure to species-specific
the SPM is non-negligible in this(As)
toxicity, arsenic study.
mainly
Considering
afflicts the mucous species-specific
membrane by toxicity,
directlyarsenic (As) mainly
damaging afflicts the
the capillaries mucous
[37,62]; membrane(Cr)
chromium by directly
can result in
damaging the capillaries [37,62]; chromium (Cr) can result in asphyxia via reducing oxygen demand
asphyxia via reducing oxygen demand of the biochemical process [63]; and vanadium (V) exhibits
of the biochemical process [63]; and vanadium (V) exhibits hepatotoxic, nephrotoxic properties and
hepatotoxic, nephrotoxic properties and reproductive system toxicity [64]. Here, we conclude that As
reproductive system toxicity [64]. Here, we conclude that As is the primary health risk and more
is theattention
primaryshouldhealthalso
riskbeand more attention should also be paid to V and Cr in the Zhujiang River.
paid to V and Cr in the Zhujiang River.
Figure
Figure 7. Hazard
7. Hazard index(HI)
index (HI)for
foreach
each metal(loid)
metal(loid) ofofSPM
SPMinin
thethe
Zhujiang River.
Zhujiang River.
3.4.3. Heavy Metal Export Budget Estimation
Based on the concentrations of the heavy metals in SPM and the discharge of the wet season
(April to September) at the last site (M18) of the Zhujiang River (River and Sediment Bulletin of China,
http://www.mwr.gov.cn/sj/tjgb/zgstbcgb/), river fluxes of each heavy metal in SPM are estimated that
range from 38.6 (Cd) to 16,171 (Mn) tons (Table 7). Here, we only calculate the budget of the wet
season, and the results may be overestimated due to sampling only once. However, considering that
we do not have any samples in the dry season, the overestimated part could approximately equal the
export flux of the dry season. Therefore, our results can represent the annual export budget of SPM
heavy metal to a certain extent. In combination with the data for dissolved heavy metals [32], the total
export budget of each heavy metal was evaluated and decreased in the order of Mn > V > Cr > Ni >
Cu > Pb > Cd (Table 7). To eliminate the large uncertainty in evaluation, high-frequency samplings
and observations are needed to quantify the annual heavy metal budget, especially in the wet flow
season, when the heavy metal concentrations could vary significantly after a storm event.Int. J. Environ. Res. Public Health 2019, 16, 1843 13 of 16
Table 7. Export fluxes of heavy metals (t yr−1 ) and proportions (%) of SPM and the dissolved flux to
the total flux in the Zhujiang River.
V Cr Mn Ni Cu Cd Pb
Parameter
Flux % Flux % Flux % Flux % Flux % Flux % Flux %
SPM 3707 83 2585 62 16171 99 709 59 628 78 38.6 77 760.0 99
Dissolved 736 17 1561 38 106 1 498 41 174 22 11.3 23 8.6 1
Total flux 4442 4146 16277 1207 802 50.0 768.6
4. Conclusions
In conclusion, this study indicates that systematic analyses of data on nine heavy metal(loid)s in
SPM samples of the Zhujiang River using multi-indicators/statistical techniques—including partition
coefficient, enrichment factor (EF), geo-accumulation index (Igeo ), toxic risk index, hazard index,
correlation analysis and principal component analysis—can provide important support regarding the
prevention–control of heavy metal pollution, and health risk control in the whole basin. Our results
show that the SPM samples contained high concentrations of several heavy metal(loid)s, including Cr,
Mn, Zn, As, and Cd (higher than all soil background values), and the investigated heavy metal(loid)s
are powerfully adsorbed by the SPM during water/particle interaction. In particular, the enrichments
of As and Cd are noticeable in the SPM, with the consistently high EF and Igeo values. Anthropogenic
emissions are the main source of the SPM extremely enriched elements (As and Cd), while natural
origins are the source responsible for V, Cr, Mn, Ni, Cu, and Pb, and the sources of the remaining heavy
metals are controlled by mixed anthropogenic and geologic origins. Moreover, our systematic risk
assessment concluded that As could pose potential non-carcinogenic effects on human health and
accounted for the majority of the SPM toxicity in the entire catchment. The potential risks of V and Cr
with their relatively higher hazard index, is also not negligible. In order to incorporate the possible
uncertainty of the single sampling and the variations of geochemical fractions of heavy metal(loid)s
in SPM, and to estimate the potential risk clearly, there is a need for further research including
high-frequency sampling and heavy metal(loid)s speciation analysis that would help understand the
geochemical cycle of heavy metal(loid)s and its environmental effect in the Zhujiang River basin.
Supplementary Materials: The following are available online at http://www.mdpi.com/1660-4601/16/10/1843/s1,
Table S1: Pearson correlation matrix of heavy metal(loid)s of the SPM in the Zhujiang River. Table S2: Hazard
index (HI) calculated results for each site, and reference dose for heavy metal(loid)s in the Zhujiang River.
Author Contributions: Conceptualization, G.H.; Methodology, G.H., Q.W. and Y.T.; Investigation, G.H., Q.W. and
Y.T.; Software, J.Z.; Data curation, J.Z., G.H., Q.W. and Y.T.; Writing—original draft, J.Z. and G.H.; Writing—review
and editing, J.Z. and G.H.
Funding: This work was supported by the National Natural Science Foundation of China (Grant No.41325010;
41661144029).
Acknowledgments: The authors thank Danyang Zhang from China University of Geosciences, Beijing for
laboratory analysis.
Conflicts of Interest: The authors declare no conflicts of interest.
References
1. Farahat, E.; Linderholm, H.W. The effect of long-term wastewater irrigation on accumulation and transfer of
heavy metals in Cupressus sempervirens leaves and adjacent soils. Sci. Total Environ. 2015, 512–513, 1–7.
[CrossRef] [PubMed]
2. Wilbers, G.-J.; Becker, M.; Nga, L.T.; Sebesvari, Z.; Renaud, F.G. Spatial and temporal variability of surface
water pollution in the Mekong Delta, Vietnam. Sci. Total Environ. 2014, 485–486, 653–665. [CrossRef]
3. Zaric, N.M.; Deljanin, I.; Ilijević, K.; Stanisavljević, L.; Ristić, M.; Gržetić, I. Assessment of spatial and
temporal variations in trace element concentrations using honeybees (Apis mellifera) as bioindicators. PeerJ
2018, 6, e5197. [CrossRef]Int. J. Environ. Res. Public Health 2019, 16, 1843 14 of 16
4. Chouba, L.; Mzoughi, N. Assessment of heavy metals in sediment and in suspended particles affected by
multiple anthropogenic contributions in harbours. Int. J. Environ. Sci. Technol. 2013, 10, 779–788. [CrossRef]
5. Gao, L.; Wang, Z.; Li, S.; Chen, J. Bioavailability and toxicity of trace metals (Cd, Cr, Cu, Ni, and Zn) in
sediment cores from the Shima River, South China. Chemosphere 2018, 192, 31–42. [CrossRef]
6. Hamad, S.H.; Schauer, J.J.; Shafer, M.M.; Al-Raheem, E.A.; Satar, H. The Distribution between the Dissolved
and the Particulate Forms of 49 Metals across the Tigris River, Baghdad, Iraq. Sci. World J. 2012. [CrossRef]
7. Islam, M.S.; Ahmed, M.K.; Raknuzzaman, M.; Habibullah-Al-Mamun, M.; Islam, M.K. Heavy metal pollution
in surface water and sediment: A preliminary assessment of an urban river in a developing country.
Ecol. Indic. 2015, 48, 282–291. [CrossRef]
8. Li, R.; Tang, C.; Cao, Y.; Jiang, T.; Chen, J. The distribution and partitioning of trace metals (Pb, Cd, Cu, and
Zn) and metalloid (As) in the Beijiang River. Environ. Monit. Assess. 2018, 190, 399. [CrossRef]
9. Zhang, N.; Zang, S.; Sun, Q. Health risk assessment of heavy metals in the water environment of Zhalong
Wetland, China. Ecotoxicology 2014, 23, 518–526. [CrossRef]
10. Liu, C.; Fan, C.; Shen, Q.; Shao, S.; Zhang, L.; Zhou, Q. Effects of riverine suspended particulate matter on
post-dredging metal re-contamination across the sediment–water interface. Chemosphere 2016, 144, 2329–2335.
[CrossRef]
11. Viers, J.; Dupré, B.; Gaillardet, J. Chemical composition of suspended sediments in World Rivers: New
insights from a new database. Sci. Total Environ. 2009, 407, 853–868. [CrossRef]
12. Liu, Z.; Zhao, Y.; Colin, C.; Stattegger, K.; Wiesner, M.G.; Huh, C.-A.; Zhang, Y.; Li, X.; Sompongchaiyakul, P.;
You, C.-F.; et al. Source-to-sink transport processes of fluvial sediments in the South China Sea. Earth-Sci. Rev.
2016, 153, 238–273. [CrossRef]
13. Asselman, N.E.M. Fitting and interpretation of sediment rating curves. J. Hydrol. 2000, 234, 228–248.
[CrossRef]
14. Zhang, W.; Wei, X.; Jinhai, Z.; Yuliang, Z.; Zhang, Y. Estimating suspended sediment loads in the Pearl River
Delta region using sediment rating curves. Cont. Shelf Res. 2012, 38, 35–46. [CrossRef]
15. Beltrame, M.O.; De Marco, S.G.; Marcovecchio, J.E. Dissolved and particulate heavy metals distribution in
coastal lagoons. A case study from Mar Chiquita Lagoon, Argentina. Estuar. Coast. Shelf Sci. 2009, 85, 45–56.
[CrossRef]
16. Avila-Perez, P.; Zarazua, G.; Carapia-Morales, L.; Tejeda, S.; Diaz-Delgado, C.; Barcelo-Quintal, I. Evaluation
of heavy metal and elemental composition of particles in suspended matter of the Upper Course of the
Lerma River. J. Radioanal. Nucl. Chem. 2007, 273, 625–633. [CrossRef]
17. Bhosale, U.; Sahu, K.C. Heavy metal pollution around the island city of Bombay, India. Part II: distribution
of heavy metals between water, suspended particles and sediments in a polluted aquatic regime. Chem. Geol.
1991, 90, 285–305. [CrossRef]
18. Kassim, T.I.; AlSaadi, H.A.; AlLami, A.A.; AlJaberi, H.H. Heavy metals in water, suspended particles,
sediments and aquatic plants of the upper region of Euphrates river, Iraq. J. Environ. Sci. Health Part
A-Environ. Sci. Eng. Toxic Hazard. Subst. Control 1997, 32, 2497–2506. [CrossRef]
19. Matsunaga, T.; Tsuduki, K.; Yanase, N.; Kritsananuwat, R.; Ueno, T.; Hanzawa, Y.; Naganawa, H. Temporal
variations in metal enrichment in suspended particulate matter during rainfall events in a rural stream.
Limnology 2014, 15, 13–25. [CrossRef]
20. Nazeer, S.; Hashmi, M.Z.; Malik, R.N. Heavy metals distribution, risk assessment and water quality
characterization by water quality index of the River Soan, Pakistan. Ecol. Indic. 2014, 43, 262–270. [CrossRef]
21. Liu, J.; Li, S.-L.; Chen, J.-B.; Zhong, J.; Yue, F.-J.; Lang, Y.; Ding, H. Temporal transport of major and trace
elements in the upper reaches of the Xijiang River, SW China. Environ. Earth Sci. 2017, 76, 299. [CrossRef]
22. Nie, F.-H.; Li, T.; Yao, H.-F.; Feng, M.; Zhang, G.-K. Characterization of suspended solids and particle-bound
heavy metals in a first flush of highway runoff. J. Zhejiang Univ. Sci. A 2008, 9, 1567–1575. [CrossRef]
23. Yao, Q.Z.; Wang, X.J.; Jian, H.M.; Chen, H.T.; Yu, Z.G. Characterization of the Particle Size Fraction associated
with Heavy Metals in Suspended Sediments of the Yellow River. Int. J. Environ. Res. Public Health 2015, 12,
6725–6744. [CrossRef]
24. Li, R.; Tang, C.; Li, X.; Jiang, T.; Shi, Y.; Cao, Y. Reconstructing the historical pollution levels and ecological
risks over the past sixty years in sediments of the Beijiang River, South China. Sci. Total Environ. 2019, 649,
448–460. [CrossRef]You can also read