Hemispheric sunspot numbers 1874-2020
←
→
Page content transcription
If your browser does not render page correctly, please read the page content below
Astronomy & Astrophysics manuscript no. ms41195                                                                                     ©ESO 2021
                                              July 2, 2021

                                                                         Hemispheric sunspot numbers 1874–2020
                                                           Astrid M. Veronig1, 2 , Shantanu Jain3 , Tatiana Podladchikova3 , Werner Pötzi2 , and Frederic Clette4

                                                    1
                                                        University of Graz, Institute of Physics, Universitätsplatz 5, 8010 Graz, Austria
                                                        e-mail: astrid.veronig@uni-graz.at
                                                    2
                                                        University of Graz, Kanzelhöhe Observatory for Solar and Environmental Research, Kanzelhöhe 19, 9521 Treffen, Austria
                                                    3
                                                        Skolkovo Institute of Science and Technology, Bolshoy Boulevard 30, bld. 1, Moscow 121205, Russia
                                                    4
                                                        World Data Center SILSO, Royal Observatory of Belgium, 1180 Brussels, Belgium
                                                   Received Month , Year; accepted Month, year
arXiv:2107.00553v1 [astro-ph.SR] 1 Jul 2021

                                                                                                                ABSTRACT

                                                   Context. Previous studies show significant north–south asymmetries for various features and indicators of solar activity. These findings
                                                   suggest some decoupling between the two hemispheres over the solar cycle evolution, which is in agreement with dynamo theories.
                                                   For the most important solar activity index, the sunspot numbers, so far only limited data are available for the two hemispheres
                                                   independently.
                                                   Aims. The aim of this study is to create a continuous series of daily and monthly hemispheric sunspot numbers (HSNs) from 1874 to
                                                   2020, which will be continuously expanded in the future with the HSNs provided by SILSO.
                                                   Methods. Based on the available daily measurements of hemispheric sunspot areas from 1874 to 2016 from Greenwich Royal Obser-
                                                   vatory and National Oceanic and Atmospheric Administration (NOAA), we derive the relative fractions of the northern and southern
                                                   activity. These fractions are applied to the international sunspot number (ISN) to derive the HSNs. This method and obtained data are
                                                   validated against published HSNs for the period 1945–2004 and those provided by SILSO for 1992 to 2020.
                                                   Results. We provide a continuous data series and catalogue of daily, monthly mean, and 13-month smoothed monthly mean HSNs
                                                   for the time range 1874–2020 —fully covering solar cycles 12 to 24— that are consistent with the newly calibrated ISN (Clette et al.
                                                   2014). Validation of the reconstructed HSNs against the direct data available since 1945 reveals a high level of consistency, with
                                                   Pearson correlation coefficients of r = 0.94 (0.97) for the daily (monthly mean) data. The cumulative hemispheric asymmetries for
                                                   cycles 12–24 give a mean value of 16%, with no obvious pattern in north–south predominance over the cycle evolution. The strongest
                                                   asymmetry occurs for cycle no. 19, in which the northern hemisphere shows a cumulated predominance of 42%. The phase shift
                                                   between the peaks of solar activity in the two hemispheres may be up to 28 months, with a mean absolute value over cycles 12–24 of
                                                   16.4 months. The phase shifts reveal an overall asymmetry of the northern hemisphere reaching its cycle maximum earlier (in 10 out
                                                   of 13 cases), with a mean signed phase shift of −7.6 months. Relating the ISN and HSN peak growth rates during the cycle rise phase
                                                   with the cycle amplitude reveals higher correlations when considering the two hemispheres individually, with r ≈ 0.9.
                                                   Conclusions. Our findings provide further evidence that to some degree the solar cycle evolves independently in the two hemispheres,
                                                   and demonstrate that empirical solar cycle prediction methods can be improved by investigating the solar cycle dynamics in terms of
                                                   the HSN evolution.
                                                   Key words. Sun – sunspots – solar activity

                                              1. Introduction                                                           (ISN) is calculated from the Wolf numbers collected from many
                                                                                                                        observers on a daily basis (currently, a network of 80 stations
                                              The sunspot number is a measure of the global solar activity de-          worldwide). This processing, described in detail in Clette et al.
                                              rived from visual observations of the Sun’s visible disk. It pro-         (2007), is carried out by World Data Center Sunspot Index and
                                              vides the longest record of the evolution of solar activity, as it        Long-term Solar Observations (WDC-SILSO), which provides
                                              extends back to the very first independent, detailed observations         daily, monthly mean, and yearly mean ISN time-series dating
                                              of sunspots made four centuries ago by Galileo Galileo in Italy,          back to the year 1700. These time-series provide a unique long-
                                              Christoph Scheiner in Germany, Johann Fabricius in the Nether-            term record of the 11-year solar cycle, which supports a wide
                                              lands, and Thomas Harriot in England, very soon after the inven-          range of scientific applications, including many solar-cycle pre-
                                              tion of the telescope in 1609.                                            diction methods (e.g. review by Petrovay 2020).
                                                  The sunspot number is based on the so-called Wolf number,
                                              calculated for a single observation as:                                        While the base ISN series provides a total number for the
                                                                                                                        whole Sun, in January 1992, the WDC-SILSO also started pro-
                                              W = 10 Ng + N s ,                                                   (1)   ducing hemispheric sunspot numbers (HSNs) using the same sta-
                                                                                                                        tistical processing as for the ISN series. However, the HSNs are
                                              where N s is the total number of spots and Ng the total number of         based on a subset of about 50 SILSO stations that also record
                                              sunspot groups on the solar disk (Wolf 1856). However, the raw            hemispheric counts in addition to the base total counts. Those
                                              Wolf number from one observer will depend on the telescope,               hemispheric numbers allow the solar cycle evolution to be traced
                                              the personal experience and visual acuity, and also on randomly           in the northern and southern hemispheres independently. In the
                                              varying sky conditions. In order to derive a global index indepen-        framework of the first end-to-end re-calibration of the ISN time-
                                              dent from individual observers, the international sunspot number          series (Clette et al. 2014; Clette & Lefèvre 2016), a new version
                                                                                                                                                                   Article number, page 1 of 12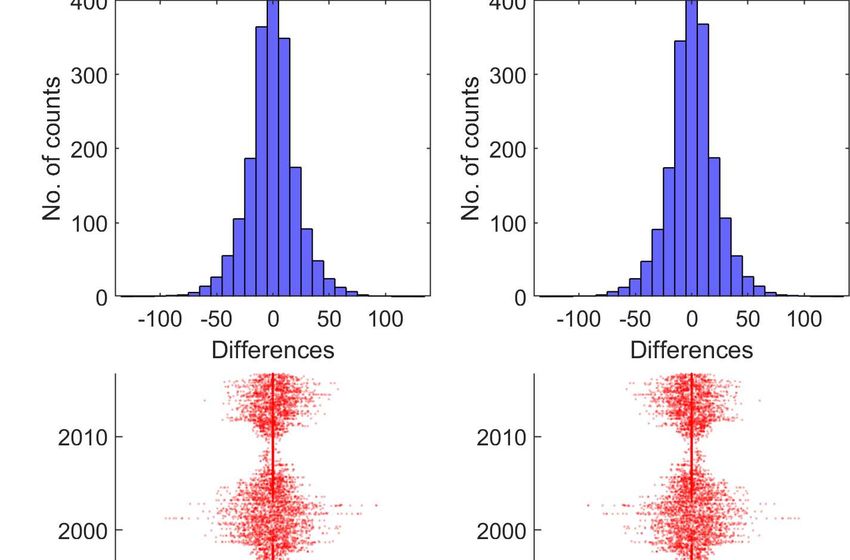
A&A proofs: manuscript no. ms41195

of the ISN was released in July 2015 (Version 2.0). Simultane-         (KSO, Austria; Pötzi et al. 2016)1 and Skalnate Pleso Observa-
ously, the hemispheric numbers were also recalculated in accor-        tory (Slovakia), and merged them to a common homogeneous
dance with the corrections determined for the total ISN.               data series.2 The data coverage of daily observations from these
     More than one century ago, early studies comparing the ac-        two stations is 84% (see also, Rybák et al. 2004).
tivity of the northern and southern hemispheres already revealed           As mentioned in Sect.1, since 1992, in addition to the ISN,
significant asymmetries (see, e.g. review by Hathaway 2015).           WDC-SILSO also collects HSNs from its worldwide network.
For instance, Spoerer (1889) and Maunder (1904) noticed that           In this case, the daily coverage is 100%, as data from 20 to 40
sunspots can be preferentially located in one of the hemispheres       stations are typically available each day, out of about 80 active
over extended periods. Waldmeier (1971) noted in his compre-           stations.3 Moreover, those hemispheric numbers are directly at-
hensive observations that for the years 1959–1969 (cycles 19           tached to the long-term calibration of the ISN series, which ex-
and 20), a variety of solar activity features like sunspots, facu-     tends back over multiple centuries. Therefore, this series pro-
lae, and prominences were much more numerous in the northern           vides the base reference for the backward reconstruction of the
hemisphere than in the southern hemisphere, and that the coronal       HSNs presented here.
brightness was also distinctly higher in the northern hemisphere.          Next to the visual sunspot numbers, another sunspot-based
     Since then, hemispheric asymmetries of solar activity have        measure of solar activity, the total sunspot area, is available over
been studied in detail in a variety of observations and activity in-   the period May 1874 to September 2016. This alternate series
dices, such as sunspot groups and areas (e.g. Newton & Milsom          is primarily based on photographic plates of the Sun produced
1955; Carbonell et al. 1993; Berdyugina & Usoskin 2003;                between 1874 and 1976 by a small network of stations run by
Norton & Gallagher 2010; McIntosh et al. 2013; Deng et al.             the Royal Greenwich Observatory (RGO) and using the same
2016), sunspot numbers (e.g. Temmer et al. 2002, 2006;                 equipment and procedures. This collection by RGO ended in
Zolotova et al. 2010; Chowdhury et al. 2019), magnetic field dis-      1976, and was extended using sunspot areas from the US Na-
tributions (e.g. Antonucci et al. 1990; Knaack et al. 2005), flare     tional Oceanic and Atmospheric Administration (NOAA), which
occurrence (e.g. Garcia 1990; Temmer et al. 2001; Joshi & Joshi        are based on sunspot drawings from the SOON stations (So-
2004; Roy et al. 2020), and so on. In general, these hemi-             lar Observing Optical Network) run by the US Air Force. It is
spheric asymmetries do not exceed 20% (Norton et al. 2014),            thus a composite series with two parts, each spanning multiple
but during extreme minima, like the Maunder minimum, they              decades. Text files containing the daily sunspot areas (in units of
may attain very high values. In addition to the findings that          millionths of a hemisphere, µhem) and monthly mean values are
the solar cycle maxima may have different strength and may             available for the full sun as well as separately for the northern
be reached at different times in the two hemispheres, it has           and southern hemispheres.4
also been shown that the solar-cycle-related polar field re-
versals occur at different times in the northern and south-
ern hemispheres (Durrant & Wilson 2003; Svalgaard & Kamide             3. Hemispheric sunspot number reconstruction and
2013). The physical origin of these north–south asymme-                   validation
tries and phase shifts —indicative of a partial decoupling of
                                                                       3.1. Reconstruction
the two hemispheres— is presumed to lie in the solar dy-
namo (e.g. Sokoloff & Nesme-Ribes 1994; Ossendrijver et al.            In 2015, the ISN was entirely recalibrated, and during this major
1996; Norton et al. 2014; Schüssler & Cameron 2018). There-            change, an obsolete 0.6 down-scaling convention inherited from
fore, studies of the long-term evolution of the solar cycles in the    the 19th century was also eliminated (change of unit), which
two separate hemispheres provide important information for the         brings the new series to the same scale as modern observations
dynamo process underlying this evolution.                              (Clette & Lefèvre 2016). The current version of the SILSO HSN
     In this paper, we reconstruct the HSNs back to the year 1874      (2.0) is consistent with this re-calibration. The corrections are
based on observations of sunspot areas and merge those with            variable in time, but overall, over the period for which those
existing HSN series available since 1945, providing full cover-        hemispheric numbers are available, i.e. from 1992 onward, the
age of cycles 12 to 24. The method is cross-validated against the      average scale change between versions 1 and 2 is around 1.44.
HSNs for the overlapping time range (1945–2016), and the data              The HSNs compiled in Temmer et al. (2006, thereafter T06)
are compiled into a catalogue of daily and monthly HSNs from           were derived by calculating the relative fractions of the sunspot
1874–2020. Finally, we demonstrate that the separate consider-         numbers for the northern and southern hemispheres from the
ation of the dynamics of the sunspot numbers for the individual        sunspot drawings at Kanzelhöhe and Skalnate Pleso Observa-
hemispheres provides more distinct relations between the cycle         tories, and normalising to the ISN —which at that time was still
growth rate and its amplitude, which is relevant for empirical         the original series, now numbered version 1— before recalibra-
solar cycle prediction methods (Cameron & Schüssler 2008).             tion. Therefore, in order to derive a continuous long-term series,
                                                                       we now need to renormalise them to the current recalibrated ISN
                                                                       (version 2.0), which has become the new official reference since
                                                                       2015. The renormalisation is done by deriving the relative frac-
2. Data                                                                tions ni and si of the daily sunspot number in the northern (Ni,V1 )
                                                                       and southern (S i,V1 ) hemisphere, respectively, from the T06 data
In this study, we create a continuous series and catalogue of
                                                                       set (which were calibrated at the time of their creation to ISN
daily, monthly mean, and 13-month smoothed monthly mean
HSNs back to the year 1874 based on three different data sets of        1
                                                                          Sunspot drawing from Kanzelhöhe Observatory are accessible as
HSNs and hemispheric sunspot areas as described in the follow-         scans at http://cesar.kso.ac.at/synoptic/draw_years.php
ing. A few direct records of HSNs from individual stations exist        2
                                                                          The data catalogue from Temmer et al. (2006) is available at
from solar cycle 18 onwards. For the period from January 1945          http://cdsarc.unistra.fr/viz-bin/cat/J/A+A/447/735
to December 2004. Temmer et al. (2006) derived HSNs from                3
                                                                          Data access at: http://sidc.be/silso/, “Data” section
                                                                        4
the daily sunspot drawings obtained at Kanzelhöhe Observatory             https://solarscience.msfc.nasa.gov/greenwch.shtml

Article number, page 2 of 12
Astrid M. Veronig et al.: Hemispheric sunspot numbers 1874–2020
200 200
North North
150 150
North SN
North SN
100 100
50 50
0 0
1950 1960 1970 1980 1990 2000 2010 2020 1950 1960 1970 1980 1990 2000 2010 2020
200 200
South South
150 150
South SN
South SN
100 100
50 50
0 0
1950 1960 1970 1980 1990 2000 2010 2020 1950 1960 1970 1980 1990 2000 2010 2020
400 400
Total Total
300 300
Total SN
Total SN
200 200
100 100
0 0
1950 1960 1970 1980 1990 2000 2010 2020 1950 1960 1970 1980 1990 2000 2010 2020
Year Year
Fig. 1. From top to bottom: Monthly mean values of hemispheric north, Fig. 2. Same as Fig. 1 but for the 13-month smoothed data.
south, and total sunspot numbers from 1945 to 2020. Top and middle
panel: Blue (red) curves show the north (south) HSN series combined
from T06 and SILSO, whereas the black curves show the HSNs recon-
structed from the sunspot areas (available up to September 2016). that for the combined hemispheric sunspot number series, we use
the T06 data for the time range January 1945 to September 1991,
and the HSNs from SILSO from January 1992 onward, because
version V1.0) as these latter are based on a larger network of observatories and
are regularly updated, allowing continuous prolongation of the
Ni,V1 hemispheric sunspot number data series established here.
ni = , (2)
S i,V1 + Ni,V1 Figure 1 (top panels) shows the HSNs reconstructed from
and the sunspot area records along with the T06 and SILSO HSNs
for the time range 1945–2020. The bottom panel shows for
S i,V1 comparison the total ISN. Figure 2 shows the same for the 13-
si = , (3)
S i,V1 + Ni,V1 month smoothed monthly data. We note that we do not use
the classical running mean but the smoothing method from
and applying these fractions to the daily recalibrated (version
Podladchikova et al. (2017), which provides an optimisation be-
V2.0) ISN (Ri ) from SILSO to obtain the recalibrated north (RN,i ) tween the smoothness of the fitted curve and its closeness to the
and south (RS ,i ) HSN as data (see also its application to the F10.7 and F30 radio flux data
RN,i = ni · Ri , (4) series in Petrova et al. (2021)). As can be seen from these plots,
the overall correspondence between the original HSNs and the
and reconstructed data is high.
RS ,i = si · Ri , (5) However, we note that the comparison of the monthly mean
data suggests that on short timescales the HSN reconstructed
so that RN,i + RS ,i = Ri . With this procedure we have estab- from sunspot areas (Figure 1) varies more than that provided by
lished a continuous series of HSNs that are consistent with the the SILSO and T06 data. Quantifying the fluctuations by deriv-
recalibrated ISN, from 1/1945 to date, which is purely based on ing the point-wise differences of the monthly mean data for the
records of the HSN. two data sets, we find an rms of 27.2 (27.8) for the reconstructed
To reconstruct the HSNs further back in time, we make use of north (south) HSN, whereas for the SILSO-T06 series the rms
the data for the total and hemispheric sunspot area that are avail- gives lower values of 19.4 (18.9). There are two main effects
able for the time range May 1874 to September 2016 from RGO that can contribute to this difference, and both are related to the
and NOAA. Our rationale is the same as for the renormalisation properties of the sunspot area series which is contributing to our
of the HSNs to the recalibrated sunspot numbers. We derive the HSN reconstructions. The first one is related to differences in
relative fraction of the sunspot areas observed in the northern the measurement noise and the second is related to differences
and southern hemispheres (analogously to Eqs. 2–3), and apply in the characteristic dynamics of the sunspot number and area
these fractions to the ISN (Eqs. 4–5). time-series:
a) Sunspot numbers are a smoother series than the sunspot
3.2. Validation areas because sunspot numbers are averaged over observations
from more stations than the sunspot areas. Therefore, the sunspot
To validate this approach, we evaluate for the overlapping pe- areas would have a larger ‘measurement noise’ resulting in larger
riod January 1945 to September 2016 how well the HSNs re- fluctuations. A discussion of the different noise contributions to
constructed from the sunspot area data fit with the hemispheric the sunspot number series is given in Dudok de Wit et al. (2016).
sunspot number series combined from T06 and SILSO. We note In addition, in reconstructing the HSNs we add the errors from
Article number, page 3 of 12A&A proofs: manuscript no. ms41195
1.03±0.01 350 1.02±0.02
y = (0.89±0.02)*x +(0.31±0.22) y = (0.93±0.09)*x -(0.40±0.98)
r = 0.94 300 r = 0.97
400
Reconstructed North SN
Reconstructed North SN
250
300
200
200 150
100
100
50
0 0
0 100 200 300 400 0 100 200 300
North SN North SN
y = (0.70±0.02)*x
1.07±0.01
+(0.63±0.21) 350 y = (0.57±0.06)*x
1.12±0.02
+(1.50±0.88)
r = 0.94 r = 0.97
300
Reconstructed South SN
Reconstructed South SN
400
250
300
200
Fig. 3. Scatter plots of daily (left) and monthly
200 150 mean (right) HSNs reconstructed from sunspot
100
areas against the HSNs from T06 and SILSO.
100 Top and bottom panels show the northern and
50 southern hemispheres. The black line shows the
ideal 1:1 correspondence and the red line repre-
0 0 sents the power-law fit. The inset gives the fit
0 100 200 300 400 0 100 200 300
parameters and the Pearson correlation coeffi-
South SN South SN
cient r.
the two data series, that is, the ISN and the hemispheric sunspot likely a residual effect of the non-linear relationship between the
areas. sunspot areas and sunspot numbers.
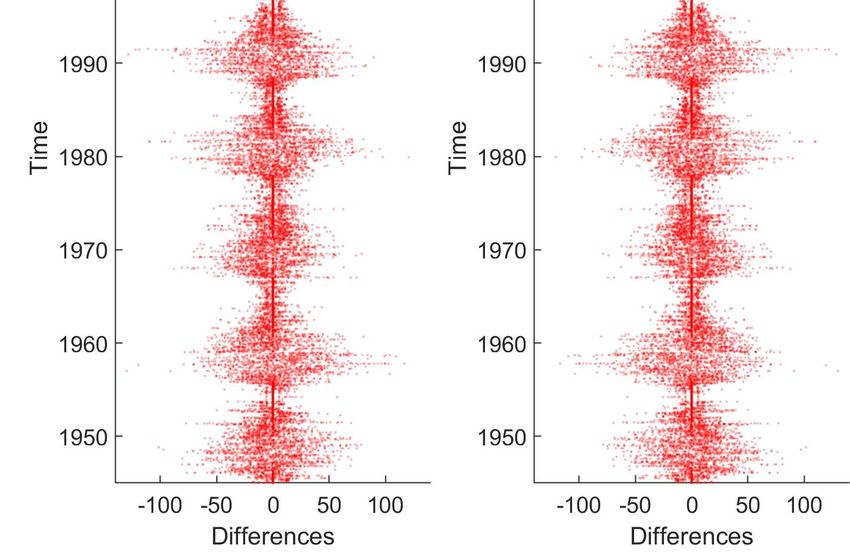
In Figure 4 (top panels), we plot the distributions of the dif-
b) In the sunspot number series, all sunspots are counted
ferences between the daily (monthly) values of the direct and re-
as 1 and all groups as 10. Therefore, the actual size or area of
constructed HSNs. The histograms demonstrate that overall the
sunspots is not directly reflected in the sunspot number. It is
data reveal no systematic differences, and the distributions are
only in the sense that, on average, the area increases with the
close to each other, with a mean difference of 0.5. In the lower
number of sunspots that both measures follow the same over-
panels, we plot the daily (monthly) differences as a function of
all variations quite closely. In particular, in the sunspot number,
time. As expected, they show a correspondence to the solar cy-
small sunspots contribute a significant fraction to the total count,
cle evolution. For the daily data, the absolute differences can be
whereas in the total sunspot areas, the largest sunspots strongly
fairly large, reaching values of >50 around the solar cycle peaks
dominate (while small sunspots play only a minor role). Large
(strongest for cycles 19 and 22). The differences are substan-
sunspots are typically long-lived, lasting several weeks. On the
tially reduced for the monthly mean data. For the daily data, the
other hand, small sunspots are short-lived and appear and disap-
differences are characterised by an rms of 18.7. The monthly
pear randomly from one day to the next. Therefore, the total area
mean data give an rms of 11.5, and the smoothed monthly mean
will tend to evolve more progressively than the sunspot number,
data give an rms of 4.1. Figure 5 shows the relation between
which may explain the somewhat larger amplitudes and varia-
the sunspot areas (from RGO) and the sunspot numbers (from
tions in the reconstructed HSNs.
T06 and SILSO) for the time range 1945–2016, together with
The correspondence between the data series is further quan- a power-law (red line) and linear (black line) least squares fit
tified in Figure 3, where we show the scatter plots of the to the data. As one can see, the sunspot areas and numbers re-
hemispheric sunspot data reconstructed from the sunspot area veal some non-linear relationship, with the power-law indices in
measurements against the corresponding values from the direct the range of about 1.2–1.3. The non-linear relation between total
HSNs (combined T06 and SILSO data set) for the daily (left sunspot areas and sunspot numbers has also been recently shown
panels) and monthly mean (right panels) data for the time range for 111 years of sunspot data from the Kodaikanal Observatory
January 1945 to September 2016. As one can see, the correlation (Ravindra et al. 2020), one of the stations that contributed to the
coefficients are high, with r = 0.94 for the daily and r = 0.97 RGO data. Such a non-linearity between the two indices is some-
for the monthly data. The black line shows the 1:1 correspon- what expected, as there is an intrinsic difference in weighting of
dence between both data sets, and the red line shows the result solar activity between sunspot areas and sunspot numbers. There
of a power-law fit. The power-law exponents derived range from is no single number that relates the two indices, but the conver-
1.02 to 1.12, indicating some small non-linearity. As one can see sion factor may be different for low and high solar activity levels
from the scatter plots in Fig. 3, deviations from the linear 1:1 re- (see also Wilson & Hathaway 2006).
lation show up in the case of very high activity (large-amplitude However, applying the ‘conversion’ to the relative fractions
cycles), with the reconstructed sunspot numbers revealing some of sunspot areas in the northern and southern hemispheres, this
trend to lie above the 1:1 line. As discussed below, this is most becomes a second-order effect, and is thus smaller than for the
Article number, page 4 of 12Astrid M. Veronig et al.: Hemispheric sunspot numbers 1874–2020
Fig. 4. Top: Histograms of the differences between the daily (left) and monthly (right) HSNs reconstructed from sunspot areas and the HSNs from
T06 and SILSO. Bottom: Time evolution of the corresponding daily (monthly) differences.
direct area-to-sunspot relation. This is because, in general, when appending the new HSN values computed by the WDC-SILSO
solar activity is high, it will be high in both hemispheres, and on a monthly basis.5
when it is low, it will be low in both hemispheres, which then Accompanying this study, we provide the data compiled into
cancels out in the relative fractions. In the present study, we de- an online catalogue for the time range 1874–2020. The catalogue
rive the relative fractions of the daily sunspot areas in the north- consist of two parts: Part A compiles the daily HSN and part B
ern and the southern hemispheres, and apply those ratios to the compiles the monthly mean and smoothed monthly mean HSNs.
ISN in order to reconstruct hemispheric sunspot numbers. This The catalogue includes the full information for the combined se-
requires us to use a daily conversion factor that reflects the in- ries derived in this study as well as for the three individual data
dividual level of solar activity. Comparing the scatter plots in sets used for merging. Catalogue A contains the daily data, and
Figure 3 to those in Figure 5, one can see that this approach in- has the following entries:
deed largely reduces the non-linearity when reconstructing the
HSN (Fig. 3), but still a small residual effect remains for very – First column: date in the format YYYY-MM-DD.
high activity levels. – Second, third columns: combined series of daily HSNs
(north, south) derived in this study (May 1874 to October
2020).
– Fourth, fifth columns: daily HSNs (north, south) recon-
4. Catalogue of hemispheric sunspot numbers structed from sunspot areas (available for May 1874 to
1874–2020 September 2016).
– Sixth, seventh columns: daily HSNs (north, south) from T06
Figure 6 shows the final combined time-series of the monthly renormalised to the recalibrated ISN (available for January
mean HSNs from 1874–2020 together with the ISN series. Fig- 1945 to December 2004).
ure 7 shows the same for the smoothed monthly mean val- – Eighth, ninth columns: daily HSNs (north, south) from
ues. The final hemispheric data plotted in Figs. 6 and 7 are SILSO (January 1992 to October 2020)
merged from the following data sets: (i) May 1874 to December
1944: reconstructed from hemispheric sunspot areas, (ii) January Catalogue B contains the monthly data, and has the following
1954 to December 1991: recalibrated HSNs from T06, (iii) Jan- entries:
uary 1992 to October 2020: hemispheric sunspot numbers from – First column: date in the format YYYY-MM.
SILSO. We note that this hemispheric sunspot number series can
5
be homogeneously and continuously expanded in the future by http://sidc.be/silso/datafiles
Article number, page 5 of 12A&A proofs: manuscript no. ms41195
200
North
150
North SN
100
50
0
1880 1900 1920 1940 1960 1980 2000 2020
200
South
150
South SN
100
50
0
1880 1900 1920 1940 1960 1980 2000 2020
400
Total
300
Total SN
200
100
0
1880 1900 1920 1940 1960 1980 2000 2020
Year
Fig. 6. Final series of monthly mean HSN derived for the period 1874–
2020. Top: Northern hemisphere. Middle: Southern hemisphere. Bot-
tom: Total sunspot numbers.
200
North
150
North SN
Fig. 5. Scatter plots of daily (left) and monthly mean (right) sunspot
100
areas against sunspot numbers for the time range 1945–2016. From top
to bottom: North and south HSN (from T06 and SILSO) and ISN (from 50
SILSO). The black line represents the linear least-squares fit, the red
0
line the power-law fit to the data. The inset gives the power-law fit pa- 1880 1900 1920 1940 1960 1980 2000 2020
rameters and the Pearson correlation coefficient r. 200
South
150
South SN
– Second, third columns: combined series of monthly mean 100
HSNs (north, south) derived in this study (May 1874 to Oc- 50
tober 2020). 0
– Fourth, fifth columns: combined series of 13-month 1880 1900 1920 1940 1960 1980 2000 2020
400
smoothed monthly mean HSNs (north, south) derived in this
Total
study. 300
Total SN
– Sixth, seventh columns: monthly mean HSNs (north, south) 200
reconstructed from sunspot areas (available for May 1874 to 100
September 2016).
0
– Eight, ninth columns: 13-month smoothed monthly mean 1880 1900 1920 1940 1960 1980 2000 2020
HSNs (north, south) reconstructed from sunspot areas. Year
– Tenth, eleventh columns: monthly mean HSNs (north, south)
from T06 renormalised to the recalibrated ISN (available for Fig. 7. Final series of 13-month smoothed monthly mean HSNs derived
January 1945 to December 2004). for the period 1874–2020. Top: Northern hemisphere. Middle: Southern
hemisphere. Bottom: Total sunspot numbers.
– Twelfth, thirteenth columns: 13-month smoothed monthly
mean HSNs (north, south) from T06 renormalised to the re-
calibrated ISN.
– Fourtennth, fifteenth columns: monthly mean HSNs (north, 5. Hemispheric asymmetry analysis and cycle
south) from SILSO (January 1992 to October 2020). growth rates
– Sixteenth, seventeenth columns: 13-month smoothed
monthly mean HSNs (north, south) from SILSO. 5.1. Hemispheric asymmetries and phase shifts
The catalogue for the data presented in this study from 1874 In the top panel of Figure 8, we plot the 13-month smoothed
to 2020 is available at Vizier.6 In addition, a live catalogue con- monthly mean north and south HSNs from the merged data set
taining the reconstructed HSNs from this study together with the we created, indicating the excess by colour shadings (blue for
regular updated HSN will be available at SILSO.7 north predominance, red for south predominance), along with
the ISN data. The bottom panel shows the cumulative monthly
6
https://vizier.u-strasbg.fr/ mean HSNs, calculated individually for each of the full cycles
7
http://sidc.be/silso/extheminum that are covered by the data set, namely cycles 12–24.
Article number, page 6 of 12Astrid M. Veronig et al.: Hemispheric sunspot numbers 1874–2020
10000
North
South
8000
Cumulative SN
6000
4000
2000
0
1880 1900 1920 1940 1960 1980 2000 2020
Time(Years)
Fig. 8. Top: Smoothed monthly mean ISN (black) and HSN (north: blue, south: red) from the merged data set for the time range 1874—2020.
The shading of the difference between the north and south sunspot numbers indicates the excess between them. Dashed vertical lines are drawn at
sunspot minima to delineate the individual cycles. Bottom: Cumulative monthly mean HSN calculated individually for each of the cycles 12–24.
Table 1. Hemispheric asymmetries for solar cycles 12–24.
Cycle tmax Max. Max. Max. Rate Rate Rate Cumul. Cumul. Predom. Diff. ∆tN ∆tS ∆tN−S
No. ISN N S ISN N S N S Hem. [%] (mon) (mon) (mon)
12 12/1883 128 63 84 5.3 4.4 4.6 3258 4409 South 35.3 −27 −1 −26
13 08/1893 148 64 97 7.1 5.6 5.3 4125 5090 South 23.4 −13 0 −13
14 10/1905 105 74 56 4.3 3.7 3.2 3778 3674 North 2.8 1 18 −17
15 08/1917 184 102 79 13.6 6.6 7.4 4918 3920 North 25.5 0 1 −1
16 06/1928 135 67 74 9.0 5.5 4.4 4391 3916 North 12.1 2 −7 9
17 05/1937 199 128 106 9.3 8.3 5.8 6033 5996 North 0.6 2 14 −12
18 06/1947 225 109 125 10.2 6.6 7.4 6658 6630 North 0.4 27 −1 28
19 11/1957 293 168 141 13.6 8.6 9.1 9516 6741 North 41.2 17 −6 23
20 02/1969 157 92 78 7.7 5.1 4.2 6732 5222 North 28.9 0 12 −12
21 11/1979 235 126 122 9.0 7.0 7.1 6889 7146 South 3.7 −2 5 −7
22 09/1989 216 111 124 12.8 8.8 5.8 5839 6780 South 16.1 −1 22 −23
23 11/2001 184 92 98 8.0 4.6 4.7 5731 6514 South 13.7 −16 4 −20
24 03/2014 117 64 82 7.3 5.3 5.6 3412 3126 North 9.2 −29 −1 −28
Notes. We list the cycle number, the time of the cycle maximum tmax in terms of the 13-month smoothed ISN, the amplitudes of the cycle maxima
in the ISN as well as north and south HSN, the peak growth rate during the cycle rise phase (in units of month−1 ) for the ISN, north and south
HSN, the cumulative sunspot numbers for the northern and southern hemispheres, the predominant hemisphere, the relative difference between
the cumulative sunspot numbers of the two hemispheres, the time difference between the cycle maximum (ISN) and the north HSN (∆tN ) and the
south HSN (∆tS ) as well as the time difference between the HSN maxima (∆tN−S ). For cycles where the difference between the cumulated HSN isA&A proofs: manuscript no. ms41195
350 200 y = (18.8±3.6)*x - (17.6±23.2) 350 y = (17.9±3.7)*x + (17.9±35.2)
r = 0.80 ± 0.08 r = 0.76 ± 0.12
y = (2.7±0.8)*x - (199.8±14.8) 300
300 r = 0.55±0.24
Max North SN
Max Total SN
150 250
250 200
Max ISN
100 150
200
100
150
50 50
0 5 10 0 5 10 15 20
100 Peak Growth (N) Peak growth (Total)
200 y =(14.6±2.9)*x + (14.6±17.4)
350
y =(17.6±2.5)*x - (30.6±30.3)
50 r = 0.76 ± 0.17 r = 0.88 ± 0.08
300
-30 -20 -10 0 10 20 30
Max South SN
Max Total SN
N-S Phase Shift (months) 150 250
Fig. 9. Scatter plot of the ISN cycle maxima against the time-shift be- 200
tween the maxima in the north and south HSN. The black line gives the 100 150
linear fit to the data.
100
50 50
The result of this analysis is summarised in Table 1. We list 0 5 10 0 5 10 15 20
Peak growth (S) Peak growth (N+S)
for each cycle the total cumulated north and south sunspot num-
bers, the hemisphere that is predominant over the integrated cy- Fig. 10. Solar cycle amplitude against the peak growth rates for the
cle, and the relative difference between the cumulative numbers merged hemispheric sunspot number series. Left: Cycle amplitude as a
of the two hemispheres. As one can see, 8 out of 13 cycles reveal function of peak growth rate for north (top) and south (bottom) HSN.
a difference of >10%, and 5 cycles reveal a difference of >20%. Top right: Cycle amplitude as a function of peak growth rate of the ISN.
The mean of the relative differences over all cycles is 16.4% The Bottom right: Cycle amplitude as a function of the sum of the peak
strongest asymmetries occurred in solar cycle 19, with a rela- growth rates determined separately for the north and the south HSN.
tive difference of 42% between the northern and southern hemi-
spheres in the sunspot numbers cumulated over the full cycle.
This strong asymmetry for cycle 19 and also the following cycle the ISN maximum reveals that the correlation in Fig. 9 results
20 was noted by Waldmeier (1971) in the predominant occur- purely from the north HSN.
rence of sunspots and faculae and also the higher coronal emis- In contrast to the asymmetries in the HSN peak times, the
sion in the northern solar hemisphere. overall HSN asymmetries (in terms of mean values for the north
In addition, we list in Table 1 the time-shift between the and south cumulated SN listed in Table 1) are small (N: 5483, S:
maxima (as determined from the 13-month smoothed monthly 5320), that is, their difference is about 3%, and the mean over the
mean data) of the activity in the two hemispheres, and also HSN maxima (amplitudes) is almost identical for northern and
with respect to the ISN. The phase shifts between the north southern hemispheres with a value of 97. Finally, we note that
and south HSNs can be as large as 28 months. The mean ab- there is no obvious relation between the cumulated HSN asym-
solute value of the north–south differences is 16.4 months. Con- metry and the phase shifts of the maximum activity between the
sidering the sign of the phase shifts for the cycles under study, two hemispheres.
there is a clear trend in that the northern hemisphere peaks ear-
lier than the south (in 10 out of 13 cycles), with a mean value 5.2. Hemispheric cycle growth rates and relation to solar
of the signed phase shifts of −7.6 months. This finding relates cycle amplitudes
to the more global consideration of the envelopes of the hemi-
spheric activity in McIntosh et al. (2013), who used a 120-month In this section, we investigate whether the separate considera-
moving window to cross-correlate the Greenwich hemispheric tion of the sunspot evolution in the two hemispheres can pro-
sunspot areas. These latter authors found that there exist sec- vide us with additional insight into the solar cycle process.
ular trends of one hemisphere leading over the other (see also Cameron & Schüssler (2008) studied, using different global in-
Zolotova et al. 2010). In particular, they obtained that up to about dices of solar activity (ISN, group sunspot numbers, sunspot ar-
1928 the northern hemisphere is leading; between 1928 and 1968 eas, and 10.7 cm radio flux), the statistical relationship between
the southern hemisphere is leading, and thereafter this switches the mean growth rate of activity in the early phase of a solar cy-
again to the northern hemisphere. This means that for >70% of cle and its amplitude. For all indices, these authors found distinct
the time-span under study, the northern hemisphere is leading. correlations, which means that stronger cycles tend to rise faster.
As for the maxima, we note that there also seems to exist a This can be interpreted as a dynamic variant of the Waldmeier
weak trend in that the phase shift between the two hemispheres (1935) rule, which relates the rise time of a cycle to its ampli-
is correlated to the cycle amplitude (Fig. 9). Large shifts between tude. These relations have important implications for empirical
the HSN where the southern hemisphere reaches its cycle maxi- solar cycle prediction methods.
mum first are associated with stronger cycles, whereas the oppo- Here, we make a similar type of analysis, but with two main
site is true (smaller amplitude cycles) when the northern hemi- changes. First, we apply the analysis not only to the ISN but
sphere maximum is ahead. Nevertheless, we note that this trend also separately to the HSN in order to test whether these may
strongly relies on the two data points with large positive time- lead to improved relations. Second, we do not study the mean
shifts, and a larger statistical sample is needed in order to come growth rate over a fixed amplitude range of the solar cycle but
to any firm conclusions. Also, checking the correlation of the instead we derive the peak growth rate in the cycle’s rise phase
phase shifts of the north and south HSN maxima with respect to from the time derivative of the smoothed sunspot number series.
Article number, page 8 of 12Astrid M. Veronig et al.: Hemispheric sunspot numbers 1874–2020
This is because the fixed range as used in Cameron & Schüssler 200 y = (19.3±3.7)*x - (24.2±24.4) 350 y =(17.9±3.7)*x + (17.9±35.2)
(2008) implies, for smaller cycles, that the limit is only reached r = 0.81 ± 0.07 r = 0.76 ± 0.12
300
shortly before or even at the cycle maximum, which means that
Max North SN
Max Total SN
for prediction purposes the lead time would become zero. Also, 150 250
we find that the peak growth rates give higher correlations than 200
the mean growth rates. 100 150
In Figure 10, we show the scatter plots of the solar cy-
cle amplitudes against the peak growth rates derived from the 100
13-month smoothed sunspot numbers. These numbers are also 50 50
0 5 10 0 5 10 15 20
listed in Table 1. The black lines show the linear fits to the Peak Growth (N) Peak growth (Total)
data that were derived using the least-squares bisector regression 200 350
y =(11.4±2.0)*x + (27.7±13.5)
method in order to symmetrically consider the variables on the r = 0.80 ± 0.14
y = (14.8±1.8)*x - (9.0±23.9)
300 r = 0.91 ± 0.07
x- and y-axes (Isobe et al. 1990). The inset gives the fit param-
Max South SN
Max Total SN
eters as well as the Pearson correlation coefficient. Error ranges 150 250
on the correlation coefficients were determined via the bootstrap- 200
ping method using 10,000 realisations for each of the relations
100 150
(Efron & Tibshirani 1993).
We study the cycle amplitudes for the HSNs of our merged 100
data set against the corresponding hemispheric peak growth 50 50
rates. For comparison, the same is done for the ISN data. In 0 5 10 0 5 10 15 20
Peak growth (S) Peak growth (N+S)
addition, we also evaluate the ISN cycle amplitude as a func-
tion of the sum of the peak growth rates determined separately Fig. 11. Solar cycle amplitude against the peak growth rates for the
for the north and south HSN (bottom right panel in Fig. 10). As purely area-based hemispheric sunspot number series. Left: Cycle am-
the peaks in the time derivatives of the northern and southern plitude as a function of peak growth rate for north (top) and south (bot-
sunspot numbers in general do not occur at the same time, this tom) HSN. Top right: Cycle amplitude as a function of peak growth
linear combination of the two peaks is different from calculating rate of the ISN. Bottom right: Cycle amplitude as a function of the sum
the peak growth rate of the linear combination of the hemispheric of the peak growth rates determined separately for the north and south
sunspot times series (which is equal to the ISN series). We note, HSN.
for both panels on the right hand side, we plot on the y-axis the
solar cycle amplitude as derived from the ISN. As one can see
from these scatter plots and insets, the Pearson correlation coef- the HSN, we adopt a corresponding range of 21–35. The scatter
ficient has increased from r = 0.76 ± 0.09 to r = 0.88 ± 0.08 plots of the mean growth rates against the cycle amplitude are
when deriving the peak growth rate separately for the two hemi- shown in Fig. A1. As one can see, the correlation coefficients
spheres and combining them afterwards, instead of deriving the are considerably lower than those for the peak growth rates (Fig-
peak growth rate from the total sunspot number series. These ure 11), with r = 0.53 ± 0.24 and r = 0.62 ± 0.16 for the ISN
findings imply that some information gets lost when we consider and combined HSN relations, respectively. This implies that the
the total sunspot number series and its dynamics instead of the peak growth rate encodes more information about the solar cycle
dynamics of the two hemispheres individually. amplitude than any average growth rate.
Interestingly, this phenomenon shows up even stronger when To investigate a) why the sunspot numbers derived from the
instead of the merged hemispheric sunspot series, we use the hemispheric areas give a higher correlation than the merged se-
HSN purely derived from the hemispheric sunspot areas, where ries and b) why the slopes derived for the Northern and Southern
the correlation increases from r = 0.76 ± 0.12 to r = 0.91 ± 0.07 hemispheres are different, we show in the Appendix the same
(Figure 11). What is also noticeable from these plots is that in plots as in Figs. 10 and 11, but separately for the time ranges
both cases, the dependence of the cycle amplitude from the peak where in the merged data series the HSNs are derived from the
growth rate is steeper for the northern than the southern HSN, sunspot areas (cycles 12–17) and from the T06 and SILSO data
with slopes of 19 versus 15 (Fig. 10) and 19 versus 11 (Fig. 11). (cycles 18–24). Figure A2 shows the scatter plots for cycles 18–
However, we note that this effect is strongly related to cycle 19 24 using the HSNs from the merged series. Figure A3 shows the
and its high northern HSN growth rate, which stands out even scatter plot for the same cycles but for the HSNs reconstructed
more for the reconstructed HSN. This is an interesting finding from the area data. Figure A4 shows the scatter plot for cy-
and is most probably related to the remaining non-linearity be- cles 12–17, where we only have HSNs reconstructed from the
tween direct and reconstructed HSNs (Fig. 3), which is expected area data. These plots show that the dependence between cycle
to be most significant when both the asymmetry and the activity peak amplitude and growth rate is always steeper for the north-
are high. These conditions are indeed most strongly met in cycle ern hemisphere than for the southern hemisphere, and also that
19. Overall, both data sets give similar results. this effect is stronger for the area-based data-series than for the
We also note that the peak growth rates show considerably merged series. These figures also show that, for each subset, the
closer correlations than the mean growth rates in the cycle’s rise correlation with the cycle amplitude is higher when consider-
phase. However, in this case the separate consideration of the ing the sum of the HSN peak growth rates than that of the ISN.
HSN also improves the results compared to the ISN growth rates The most specific subrange is the one covering solar cycles 12–
(though the overall level is lower). Cameron & Schüssler (2008) 17. Here we observe the largest difference in the slopes between
studied the mean growth rate of the ISN —derived within a fixed north and south, and summing the peaks of the derivatives of the
range of ISN (Version 1.0) between 30 and 50 in the cycle’s north and south hemispheric sunspot series leads to a very high
rise phase— against the cycle amplitude. Here we transform this correlation with the solar cycle amplitude of r = 0.99 ± 0.01.
range from the ISN Version 1.0 to 2.0 by multiplying it by a Combining the data sets of the different subranges, which are
mean scaling factor of 1.4, resulting in a range of 42–70. For characterised by different slopes, leads to a lower overall corre-
Article number, page 9 of 12A&A proofs: manuscript no. ms41195
lation coefficient for the full range, and has a bigger effect on the 1994; Ossendrijver et al. 1996; Tobias 1997; Norton et al. 2014;
merged data series. Schüssler & Cameron 2018). This also has implications for solar
cycle prediction methods.
The different types of solar cycle prediction methods either
6. Discussion and conclusions rely on empirical relations or are physics-based (for reviews
In this study, we created a continuous series of daily, monthly see, Pesnell 2012; Petrovay 2020). Long and continuous
mean, and smoothed monthly mean HSNs for the period 1874– sunspot number records are needed for predictions of solar
2020, fully covering solar cycles 12–24 (Figs. 6 and 7). The data activity on different timescales, covering short, medium, and
are compiled in a data catalogue that accompanies the paper.8 In long-term horizons (see the definitions in Petrova et al. (2021)).
the future, this data series will be seamlessly expanded with the Long-term prediction methods mainly focus on forecasting
HSNs that are regularly provided by SILSO.9 The hemispheric the solar cycle amplitude, and broadly use sunspot numbers in
sunspot number series is combined from three data sources: combination with other solar and geomagnetic activity indices.
Starting with the year 1945, it contains the HSN provided by A large number of methods are based on finding a particular
T06 and SILSO. The reconstructions back in time to 1874 are sunspot number precursor in the past, which can serve as an
based on the daily measurements of hemispheric sunspot areas indicator for the amplitude of the upcoming solar cycle (e.g.
from GRO and NOAA. Validating our reconstructions with the Waldmeier 1935; Ramaswamy 1977; Macpherson et al. 1995;
direct hemispheric sunspot data for the time range 1945–2016 Conway 1998; Sello 2001; Lantos 2006; Cameron & Schüssler
reveals very good agreement (see Fig. 3), with correlation co- 2008; Podladchikova et al. 2008, 2017; Aguirre et al. 2008;
efficients of r = 0.94 for the daily data and r = 0.97 for the Brajša et al. 2009; Podladchikova & Van der Linden 2011;
monthly mean data. The power-law fit indicates a relation that is Kakad et al. 2020). Other types of precursor methods are based
close to linear, except for the highest activity levels where some on the polar magnetic fields (e.g. Schatten et al. 1978, 1996;
small non-linearity effects show up. Schatten & Sofia 1987; Svalgaard et al. 2005; Schatten 2005;
Wang & Sheeley 2009; Muñoz-Jaramillo et al. 2012) and geo-
For the cumulative hemispheric sunspot number asymme-
magnetic activity indices (e.g. Ohl & Ohl 1979; Feynman 1982;
tries (Fig. 8, bottom panel) we obtain a mean value of 16%
Gonzalez & Schatten 1988; Thompson 1993; Wilson et al.
over cycles 12–24. The strongest asymmetry occurs in cycle 19
1998). In the recent decades, also physics-based prediction
(which is the highest cycle in the period under study), where the
methods were developed based on flux transport and dynamo
northern hemisphere shows a predominance as high as 42% cu-
models (e.g. Nandy & Choudhuri 2002; Dikpati & Gilman
mulated over the solar cycle. The phase shift between the peak of
2006; Cameron & Schüssler 2007; Choudhuri et al. 2007;
the solar activity in the northern and southern hemispheres may
Henney et al. 2012; Cameron & Schüssler 2015).
be as large as 28 months, with a mean value over all cycles under
Short- and medium-term predictions of solar activity are usu-
study of 16.4 months. Interestingly, there exists a distinct hemi-
ally performed for the ongoing cycle development with lead
spheric asymmetry in that, in 10 out of 13 cases, the northern
times from days to months. SILSO regularly provides updated
hemisphere reaches its cycle maximum earlier, with a mean of
predictions of sunspot numbers from 1 to 12 months ahead us-
the signed phase shift over all cycles under study of −7.6 months.
ing the ‘standard’ method (Waldmeier 1968), the ‘combined’
Also, there are indications that this hemispheric phase shift is
method (Denkmayr & Cugnon 1997; Hanslmeier et al. 1999),
correlated to the cycle amplitude. Finally, we demonstrate that
the McNish–Lincoln method (McNish & Lincoln 1949), as well
the dynamic Waldmeier rule, which relates the growth rate of a
as improvements of these prediction methods using a Kalman fil-
solar cycle to its amplitude, works better when the two hemi-
ter (Podladchikova & Van der Linden 2012). All these methods
spheres are considered separately. To this aim, we determined
are based on the ISN series.
the peak of the time derivative of the HSN during the cycle’s rise
The concluding point we want to make here is that the cata-
phase, and combined them afterwards. This yielded higher cor-
logue of hemispheric sunspot number created in this study pro-
relations with the solar cycle amplitude than calculating the peak
vides an extended record of the hemispheric activity evolution
of the time derivative of the total sunspot numbers, with correla-
over 12 solar cycles, and will be homogeneously extended with
tion coefficients of r ≈ 0.9 ± 0.08 compared to r = 0.76 ± 0.12,
future HSNs provided by SILSO. Furthermore, we demonstrate
respectively, for the total sunspot numbers (Figs. 10 and 11).
that empirical relations between the solar cycle growth rate and
It has been shown for various solar activity indices
its amplitude show higher correlations when considering the
related to surface magnetism that there exist significant
HSN. These findings provide the foundation for enhanced empir-
asymmetries and phase shifts in the evolution of the
ical solar cycle prediction methods based on the HSN to capture
two hemispheres (e.g. Newton & Milsom 1955; Waldmeier
the hemisphere’s individual evolution and dynamics.
1971; Garcia 1990; Antonucci et al. 1990; Temmer et al.
2002, 2006; Durrant & Wilson 2003; Joshi & Joshi 2004;
Knaack et al. 2005; Norton & Gallagher 2010; McIntosh et al. Appendix A: Additional Figures
2013; Deng et al. 2016; Chowdhury et al. 2019; Roy et al.
2020). In recent years, north–south asymmetries have also been
identified in Joy’s law (McClintock & Norton 2013) as well
as in east–west zonal flows and north–south meridional flows
(Zhao et al. 2013; Komm et al. 2014), which play a fundamental
role in the magnetic flux transport inside the Sun. These findings
suggest that the solar cycle evolution of the two hemispheres
is partly decoupled, and that these asymmetries are a result
of the underlying solar dynamo (e.g. Sokoloff & Nesme-Ribes
8
https://vizier.u-strasbg.fr/
9
http://sidc.be/silso/extheminum
Article number, page 10 of 12Astrid M. Veronig et al.: Hemispheric sunspot numbers 1874–2020
200 y = (23.2±13.5)*x + (42.5±32.8) 350 y = (43.8±13.3)*x - (22.8±62.7) 200 350
y =(20.9±7.3)*x - (33.9±53.1) y =(22.2±6.0)*x - (13.3±60.1)
r = 0.28 ± 0.22 r = 0.53 ± 0.24 r = 0.72 ± 0.19 r = 0.81 ± 0.18
300 300
Max North SN
Max North SN
Max Total SN
Max Total SN
150 250 150 250
200 200
100 150 100 150
100 100
50 50 50 50
0 2 4 6 0 5 10 0 5 10 0 5 10 15 20
Mean Growth Rate (North) Mean Growth Rate (Total) Peak Growth (N) Peak growth (Total)
200 y =(21.4±10.6)*x + (46.8±26.2)
350 200 350
y = (47.4±13.0)*x - (44.2±62.3) y = (10.4±2.6)*x + (37.0±19.8) y =(15.5±3.7)*x - (18.0±55.0)
r = 0.29 ± 0.29 r = 0.62 ± 0.17 r = 0.83 ± 0.17 r = 0.86 ± 0.16
300 300
Max South SN
Max South SN
Max Total SN
Max Total SN
150 250 150 250
200 200
100 150 100 150
100 100
50 50 50 50
0 2 4 6 0 5 10 0 5 10 0 5 10 15 20
Mean Growth Rate (South) Mean Growth Rate (N+S) Peak growth (S) Peak growth (N+S)
Fig. A1. Same as Fig. 10 (merged hemispheric sunspot number series) Fig. A3. Same as Fig. 11 (purely area-based hemispheric sunspot num-
but for mean growth rates. ber series) but solely for cycles 18–24.
200 350 200 y = (15.9±4.1)*x - (5.9±24.3) 350 y = (10.3±3.4)*x + (66.3±29.8)
y =(18.9±6.3)*x - (14.2±42.6) y = (22.2±6.0)*x - (13.3±60.1)
r = 0.74 ± 0.18 r = 0.81 ± 0.17 r = 0.75 ± 0.41 r = 0.79 ± 0.19
300 300
Max North SN
Max Total SN
Max North SN
Max Total SN
150 250 150 250
200 200
100 150 100 150
100 100
50 50 50 50
0 5 10 0 5 10 15 20 0 5 10 0 5 10 15 20
Peak Growth (N) Peak growth (Total) Peak Growth (N) Peak growth (Total)
200 350 200 y =(10.6±5.6)*x + (30.1±29.7) 350
y = (13.7±3.2)*x + (23.9±20.9) y = (18.1±4.3)*x - (28.2±56.3) y =(12.5±0.9)*x + (15.1±10.2)
r = 0.86 ± 0.12 r = 0.56 ± 0.43 r = 0.99 ± 0.01
300 r = 0.86 ± 0.17 300
Max South SN
Max South SN
Max Total SN
Max Total SN
150 250 150 250
200 200
100 150 100 150
100 100
50 50 50 50
0 5 10 0 5 10 15 20 0 5 10 0 5 10 15 20
Peak growth (S) Peak growth (N+S) Peak growth (S) Peak growth (N+S)
Fig. A2. Same as Fig. 10 (merged hemispheric sunspot number series) Fig. A4. Same as Fig. 11 (purely area-based hemispheric sunspot num-
but solely for cycles 18–24. ber series) but solely for cycles 12–17.
In this Appendix A, we show more investigations on the References
relation between the total and hemispheric solar cycle growth Aguirre, L. A., Letellier, C., & Maquet, J. 2008, Sol. Phys., 249, 103
rates with the solar cycle amplitudes. Figure A1 shows the scat- Antonucci, E., Hoeksema, J. T., & Scherrer, P. H. 1990, ApJ, 360, 296
ter plots for the mean cycle growth rates. Figures A2– A4 show Berdyugina, S. V. & Usoskin, I. G. 2003, A&A, 405, 1121
the relations of the peak growth rates and the cycle amplitudes Brajša, R., Wöhl, H., Hanslmeier, A., et al. 2009, Cent. Eur. Astrophys. Bull.,
33, 95
separately for the different time-spans, for which we have direct Cameron, R. & Schüssler, M. 2007, Astrophys. J., 659, 801
measurements of HSN available (cycles 18–24; Figs. A2, A3) Cameron, R. & Schüssler, M. 2008, ApJ, 685, 1291
and where we have only hemispheric area measurements avail- Cameron, R. & Schüssler, M. 2015, Science, 347, 1333
able (cycles 12–17; Fig. A4). Carbonell, M., Oliver, R., & Ballester, J. L. 1993, A&A, 274, 497
Choudhuri, A. R., Chatterjee, P., & Jiang, J. 2007, Physical Review Letters, 98,
Acknowledgements. The World Data Center SILSO, which produces the in- 131103
ternational sunspot number used in this study, is supported by Belgian Solar- Chowdhury, P., Kilcik, A., Yurchyshyn, V., Obridko, V. N., & Rozelot, J. P. 2019,
Terrestrial Center of Excellence (STCE, http://www.stce.be) funded by the Sol. Phys., 294, 142
Belgian Science Policy Office (BelSPo). This research has received financial sup- Clette, F., Berghmans, D., Vanlommel, P., et al. 2007, Advances in Space Re-
port from the European Union’s Horizon 2020 research and innovation program search, 40, 919
under grant agreement No. 824135 (SOLARNET). Clette, F. & Lefèvre, L. 2016, Sol. Phys., 291, 2629
Article number, page 11 of 12A&A proofs: manuscript no. ms41195 Clette, F., Svalgaard, L., Vaquero, J. M., & Cliver, E. W. 2014, Space Sci. Rev., Waldmeier, M. 1968, Astronomische Mitteilungen der Eidgenössischen Stern- 186, 35 warte, Zürich, 286 Conway, A. J. 1998, New A Rev., 42, 343 Waldmeier, M. 1971, Sol. Phys., 20, 332 Deng, L. H., Xiang, Y. Y., Qu, Z. N., & An, J. M. 2016, AJ, 151, 70 Wang, Y.-M. & Sheeley, N. R. 2009, The Astrophysical Journal Letters, 694, L11 Denkmayr, K. & Cugnon, P. 1997, in Proceedings of the 5th Solar–Terrestrial Wilson, R. M. & Hathaway, D. H. 2006, On the Relation Between Sunspot Area Prediction Workshop, ed. G. Heckman, K. Maruboshi, M. A. Shea, D. F. and Sunspot Number, NASA STI/Recon Technical Report N Smart, & R. Thompson (Hiraiso Solar Terrestrial Research Center, Japan), Wilson, R. M., Hathaway, D. H., & Reichmann, E. J. 1998, J. Geophys. Res., 103 103, 6595 Dikpati, M. & Gilman, P. A. 2006, ApJ, 649, 498 Wolf, R. 1856, Astronomische Mitteilungen der Eidgenössischen Sternwarte Dudok de Wit, T., Lefèvre, L., & Clette, F. 2016, Sol. Phys., 291, 2709 Zürich, 1, 3 Durrant, C. J. & Wilson, P. R. 2003, Sol. Phys., 214, 23 Zhao, J., Bogart, R. S., Kosovichev, A. G., Duvall, T. L., J., & Hartlep, T. 2013, Efron, B. & Tibshirani, R. J. 1993, An Introduction to the Bootstrap, Mono- ApJ, 774, L29 graphs on Statistics and Applied Probability No. 57 (Boca Raton, Florida, Zolotova, N. V., Ponyavin, D. I., Arlt, R., & Tuominen, I. 2010, Astronomische USA: Chapman & Hall/CRC) Nachrichten, 331, 765 Feynman, J. 1982, J. Geophys. Res., 87, 6153 Garcia, H. A. 1990, Sol. Phys., 127, 185 Gonzalez, G. & Schatten, K. H. 1988, Sol. Phys., 114, 189 Hanslmeier, A., Denkmayr, K., & Weiss, P. 1999, Sol. Phys., 184, 213 Hathaway, D. H. 2015, Living Reviews in Solar Physics, 12, 4 Henney, C. J., Toussaint, W. A., White, S. M., & Arge, C. N. 2012, Space Weather, 10, S02011 Isobe, T., Feigelson, E. D., Akritas, M. G., & Babu, G. J. 1990, ApJ, 364, 104 Joshi, B. & Joshi, A. 2004, Sol. Phys., 219, 343 Kakad, B., Kumar, R., & Kakad, A. 2020, Sol. Phys., 295, 88 Knaack, R., Stenflo, J. O., & Berdyugina, S. V. 2005, A&A, 438, 1067 Komm, R., Howe, R., González Hernández, I., & Hill, F. 2014, Sol. Phys., 289, 3435 Lantos, P. 2006, Sol. Phys., 236, 199 Macpherson, K. P., Conway, A. J., & Brown, J. C. 1995, J. Geophys. Res., 100, 21735 Maunder, E. W. 1904, MNRAS, 64, 747 McClintock, B. H. & Norton, A. A. 2013, Sol. Phys., 287, 215 McIntosh, S. W., Leamon, R. J., Gurman, J. B., et al. 2013, ApJ, 765, 146 McNish, A. G. & Lincoln, J. V. 1949, Transactions, American Geophysical Union, 30, 673 Muñoz-Jaramillo, A., Sheeley, N. R., Zhang, J., & DeLuca, E. E. 2012, ApJ, 753, 146 Nandy, D. & Choudhuri, A. R. 2002, Science, 296, 1671 Newton, H. W. & Milsom, A. S. 1955, MNRAS, 115, 398 Norton, A. A., Charbonneau, P., & Passos, D. 2014, Space Sci. Rev., 186, 251 Norton, A. A. & Gallagher, J. C. 2010, Sol. Phys., 261, 193 Ohl, A. I. & Ohl, G. I. 1979, in NOAA Solar-Terr. Pred. Proc., ed. R. F. Donnelly, Vol. 2, 258–263 Ossendrijver, A. J. H., Hoyng, P., & Schmitt, D. 1996, A&A, 313, 938 Pesnell, W. D. 2012, Sol. Phys., 281, 507 Petrova, E., Podladchikova, T., Veronig, A. M., et al. 2021, arXiv e-prints, arXiv:2103.08059 Petrovay, K. 2020, Living Reviews in Solar Physics, 17, 2 Podladchikova, T., Lefebvre, B., & Van der Linden, R. 2008, J. Atm. Sol-Terr. Phys., 70, 277 Podladchikova, T. & Van der Linden, R. 2011, Journal of Space Weather and Space Climate, 1, A260000 Podladchikova, T. & Van der Linden, R. 2012, Sol. Phys., 277, 397 Podladchikova, T., Van der Linden, R., & Veronig, A. M. 2017, ApJ, 850, 81 Pötzi, W., Veronig, A. M., Temmer, M., et al. 2016, Sol. Phys., 291, 3103 Ramaswamy, G. 1977, Nature, 265, 713 Ravindra, B., Pichamani, K., Selvendran, R., et al. 2020, Ap&SS, 365, 14 Roy, S., Prasad, A., Ghosh, K., Panja, S. C., & Patra, S. N. 2020, Sol. Phys., 295, 100 Rybák, J., Bendík, P., Temmer, M., Veronig, A., & Hanslmeier, A. 2004, Hvar Observatory Bulletin, 28, 63 Schatten, K., Myers, D. J., & Sofia, S. 1996, Geophys. Res. Lett., 23, 605 Schatten, K. H. 2005, Geophys. Res. Lett., 32, L21106 Schatten, K. H., Scherrer, P. H., Svalgaard, L., & Wilcox, J. M. 1978, Geo- phys. Res. Lett., 5, 411 Schatten, K. H. & Sofia, S. 1987, Geophys. Res. Lett., 14, 632 Schüssler, M. & Cameron, R. H. 2018, A&A, 618, A89 Sello, S. 2001, A&A, 377, 312 Sokoloff, D. & Nesme-Ribes, E. 1994, A&A, 288, 293 Spoerer, F. W. G. 1889, Astronomische Nachrichten, 121, 105 Svalgaard, L., Cliver, E. W., & Kamide, Y. 2005, Geophys. Res. Lett., 32, 1104 Svalgaard, L. & Kamide, Y. 2013, ApJ, 763, 23 Temmer, M., Rybák, J., Bendík, P., et al. 2006, A&A, 447, 735 Temmer, M., Veronig, A., & Hanslmeier, A. 2002, A&A, 390, 707 Temmer, M., Veronig, A., Hanslmeier, A., Otruba, W., & Messerotti, M. 2001, A&A, 375, 1049 Thompson, R. J. 1993, Sol. Phys., 148, 383 Tobias, S. M. 1997, A&A, 322, 1007 Waldmeier, M. 1935, Astronomische Mitteilungen der Eidgenössischen Stern- warte Zürich, 14, 105 Article number, page 12 of 12
You can also read