Herc Holdings Inc. Investor Presentation - San Francisco - Los Angeles Larry Silber, President & CEO Mark Irion, SVP & CFO Elizabeth Higashi, VP ...

Page created by Zachary Klein
 
CONTINUE READING
Herc Holdings Inc. Investor Presentation - San Francisco - Los Angeles Larry Silber, President & CEO Mark Irion, SVP & CFO Elizabeth Higashi, VP ...
Herc Holdings Inc.
Investor Presentation

 Larry Silber, President & CEO
        Mark Irion, SVP & CFO
      Elizabeth Higashi, VP, IR

San Francisco - Los Angeles

                August 27-28, 2018

           ©2018 Herc Rentals Inc. All Rights Reserved.
Herc Holdings Inc. Investor Presentation - San Francisco - Los Angeles Larry Silber, President & CEO Mark Irion, SVP & CFO Elizabeth Higashi, VP ...
Safe Harbor Statements

Forward-Looking Statements
This presentation contains statements that are not statements of historical fact, but instead are forward-looking statements within the
meaning of the Private Securities Litigation Reform Act of 1995. We caution readers not to place undue reliance on these statements,
which speak only as of the date hereof. There are a number of risks, uncertainties and other important factors that could cause our actual
results to differ materially from those suggested by our forward-looking statements, including:

•   Risks related to material weaknesses in our internal control over financial reporting and the restatement of financial statements
    previously issued by Hertz Global Holdings, Inc. (in its form prior to the spin-off that effected the separation of the car rental business
    from us, “Hertz Holdings”), including that: we have identified material weaknesses in our internal control over financial reporting that
    may adversely affect our ability to report our financial condition and results of operations in a timely and accurate manner, which may
    adversely affect investor and lender confidence in us and, as a result, the value of our common stock and our ability to obtain future
    financing on acceptable terms, and we may identify additional material weaknesses; our efforts to design and implement an effective
    control environment may not be sufficient to remediate the material weaknesses, or to prevent future material weaknesses; such
    material weaknesses could result in a material misstatement of our consolidated financial statements that would not be prevented or
    detected; we continue to expend significant costs and devote management time and attention and other resources to matters related to
    our internal control over financial reporting; our material weaknesses could expose us to additional risks that could materially adversely
    affect our ability to execute our strategic plan and our financial position, results of operations and cash flows; any significant disruption
    or deficiency in the design of or implementing new information technology ("IT") systems, including the financial system migrated from
    Hertz Rental Car Holding Company, Inc. which has been re-named Hertz Global Holdings, Inc. ("New Hertz"), could materially
    adversely affect our ability to accurately maintain our books and records or otherwise operate our business; and Hertz Holdings'
    restatement has been costly and has resulted in government investigations and other legal actions, and could result in government
    enforcement actions and private litigation that could have a material adverse impact on our results of operations, financial condition,
    liquidity and cash flows;

• Business risks could have a material adverse effect on our business, results of operations, financial condition and/or liquidity, including:
  ◦ the cyclicality of our business and its dependence on levels of capital investment and maintenance expenditures by our customers; a
    slowdown in economic conditions or adverse changes in the level of economic activity or other economic factors specific to our
    customers or their industries, in particular, contractors and industrial customers;
  ◦ our business is heavily reliant upon communications networks and centralized IT systems and the concentration of our systems
    creates or increases risks for us, including the risk of the misuse or theft of information we possess, including as a result of cyber
    security breaches or otherwise, which could harm our brand, reputation or competitive position and give rise to material liabilities;
  ◦ we may fail to maintain, upgrade and consolidate our IT networks;
  ◦ we may fail to respond adequately to changes in technology and customer demands;
  ◦ intense competition in the industry, including from our own suppliers, that may lead to downward pricing or an inability to increase
    prices;

                                                                   NYSE: HRI                            ©2018 Herc Rentals Inc. All Rights Reserved.   2   2
Herc Holdings Inc. Investor Presentation - San Francisco - Los Angeles Larry Silber, President & CEO Mark Irion, SVP & CFO Elizabeth Higashi, VP ...
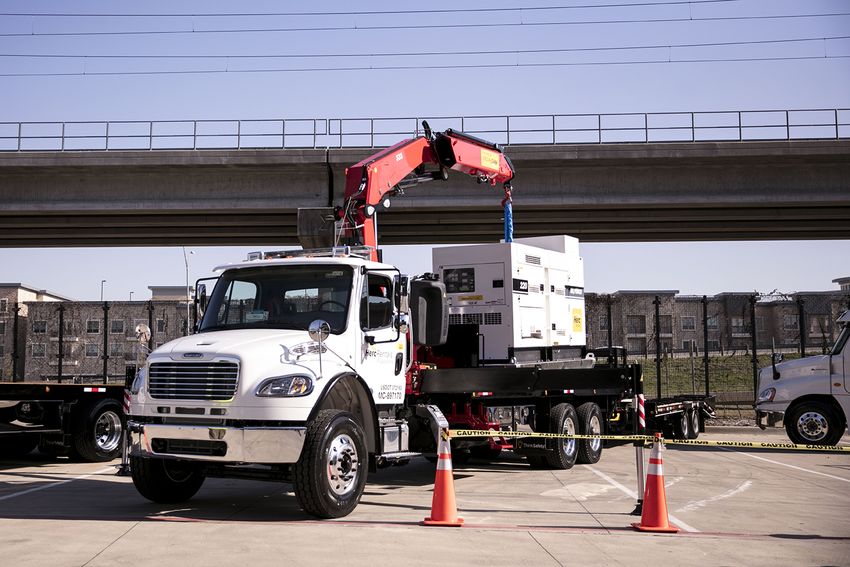
Business Risks - Continued

    ◦   our success depends on our ability to attract and retain key management and other key personnel, and the ability of new employees
        to learn their new roles;
    ◦   we may have difficulty obtaining the resources that we need to operate, or our costs to do so could increase significantly;
    ◦   any occurrence that disrupts rental activity during our peak periods, given the seasonality of the business, especially in the
        construction industry;
    ◦   doing business in foreign countries exposes us to additional risks, including under laws and regulations that may conflict with U.S.
        laws and those under anticorruption, competition, economic sanctions and anti-boycott regulations;
    ◦   some or all of our deferred tax assets could expire if we experience an “ownership change” as defined in the Internal Revenue Code;
    ◦   changes in the legal and regulatory environment that affect our operations, including with respect to taxes, consumer rights, privacy,
        data security and employment matters, could disrupt our business and increase our expenses;
    ◦   an impairment of our goodwill or our indefinite lived intangible assets could have a material non-cash adverse impact;
    ◦   other operational risks such as: any decline in our relations with our key national account customers or the amount of equipment they
        rent from us; our equipment rental fleet is subject to residual value risk upon disposition, and may not sell at the prices we expect;
        maintenance and repair costs associated with our equipment rental fleet could materially adversely affect us; we may be unable to
        protect our trade secrets and other intellectual property rights; we are exposed to a variety of claims and losses arising from our
        operations, and our insurance may not cover all or any portion of such claims; we may face issues with our union employees;
        environmental, health and safety laws and regulations and the costs of complying with them, or any change to them impacting our
        markets, could materially adversely affect us; and strategic acquisitions could be difficult to identify and implement and could disrupt
        our business or change our business profile significantly;

•   Risks related to the spin-off, which effected our separation from New Hertz, such as: the liabilities we have assumed and will share with
    New Hertz in connection with the spin-off could have a material adverse effect on our business, financial condition and results of
    operations; if there is a determination that any portion of the spin-off transaction is taxable for U.S. federal income tax purposes,
    including for reasons outside of our control, then we and our stockholders could incur significant tax liabilities, and we could also incur
    indemnification liability if we are determined to have caused the spin-off to become taxable; if New Hertz fails to pay its tax liabilities
    under the tax matters agreement or to perform its obligations under the separation and distribution agreement, we could incur significant
    tax and other liability; we have limited operating history as a stand-alone public company, and our historical financial information for
    periods prior to July 1, 2016 is not necessarily representative of the results that we would have achieved as a separate, publicly traded
    company, and may not be a reliable indicator of our future results; our ability to engage in financings, acquisitions and other strategic
    transactions using equity securities is limited due to the tax treatment of the spin-off; and the spin-off may be challenged by creditors as
    a fraudulent transfer or conveyance;

•   Risks related to our substantial indebtedness, such as: our substantial level of indebtedness exposes us or makes us more vulnerable
    to a number of risks that could materially adversely affect our financial condition, results of operations, cash flows, liquidity and ability to
    compete; the secured nature of our indebtedness, which is secured by substantially all of our consolidated assets, could materially
    adversely affect our business and holders of our debt and equity; an increase in interest rates or in our borrowing margin would increase
    the cost of servicing our debt and could reduce our profitability; and any additional debt we incur could further exacerbate these risks;

                                                                    NYSE: HRI                             ©2018 Herc Rentals Inc. All Rights Reserved.   3   3
Herc Holdings Inc. Investor Presentation - San Francisco - Los Angeles Larry Silber, President & CEO Mark Irion, SVP & CFO Elizabeth Higashi, VP ...
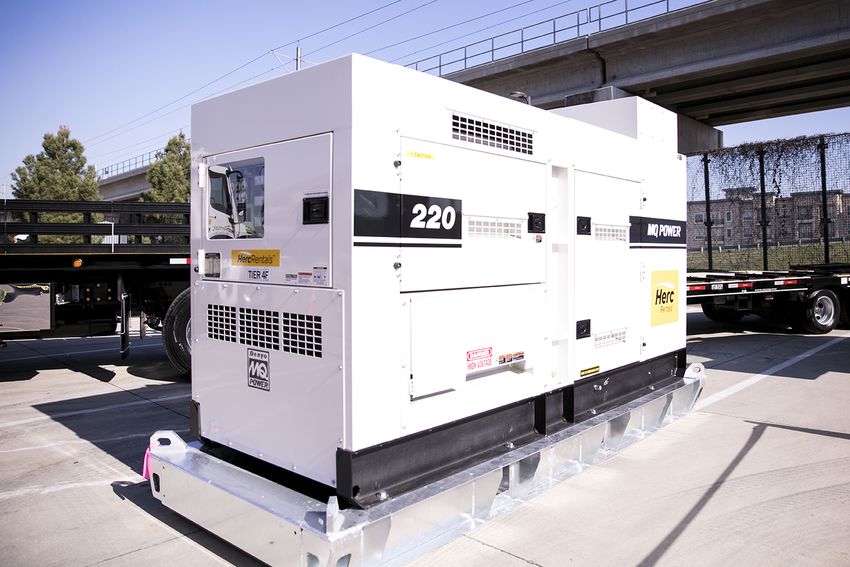
Business Risks- Continued and Non-GAAP Financial Measures

•   Risks related to the securities market and ownership of our stock, including that: the market price of our common stock could decline as
    a result of the sale or distribution of a large number of our shares or the perception that a sale or distribution could occur and these
    factors could make it more difficult for us to raise funds through future stock offerings; provisions of our governing documents could
    discourage potential acquisition proposals and could deter or prevent a change in control; and the market price of our common stock
    may fluctuate significantly; and

•   Other risks and uncertainties set forth in our Annual Report on Form 10-K for the year ended December 31, 2017 under Item 1A "Risk
    Factors" and in our other filings with the Securities and Exchange Commission (“SEC”).

All forward-looking statements are expressly qualified in their entirety by such cautionary statements. We do not undertake any
obligation to release publicly any update or revision to any of the forward-looking statements.

Information Regarding Non-GAAP Financial Measures

In addition to results calculated according to accounting principles generally accepted in the United States (“GAAP”), the Company has
provided certain information in this presentation which is not calculated according to GAAP (“non-GAAP”), such as adjusted EBITDA,
adjusted EBITDA margin, net leverage and free cash flow. Management uses these non-GAAP measures to evaluate operating
performance and period-over-period performance of our core business without regard to potential distortions, and believes that investors
will likewise find these non-GAAP measures useful in evaluating the Company’s performance. These measures are frequently used by
security analysts, institutional investors and other interested parties in the evaluation of companies in our industry.

Non-GAAP measures should not be considered in isolation or as a substitute for our reported results prepared in accordance with GAAP
and, as calculated, may not be comparable to similarly titled measures of other companies. For the definitions of these terms, further
information about management’s use of these measures as well as a reconciliation of these non-GAAP measures to the most comparable
GAAP financial measures, please see the Appendix to this presentation.

                                                                 NYSE: HRI                           ©2018 Herc Rentals Inc. All Rights Reserved.   4   4
Herc Holdings Inc. Investor Presentation - San Francisco - Los Angeles Larry Silber, President & CEO Mark Irion, SVP & CFO Elizabeth Higashi, VP ...
A Leading Equipment Rental Company

• Leveraging 50+ years of experience
  in the equipment rental industry

• Separated from Hertz's car rental
  business and listed on the New York
  Stock Exchange on July 1, 2016
  under the symbol "HRI"

• Rolled out Herc Rentals branding in
  Canada on July 3, 2018

• Completed the final step of our
  information technology separation
  from Hertz in July 2018

                                      NYSE: HRI    ©2018 Herc Rentals Inc. All Rights Reserved.   5   5
Herc Holdings Inc. Investor Presentation - San Francisco - Los Angeles Larry Silber, President & CEO Mark Irion, SVP & CFO Elizabeth Higashi, VP ...
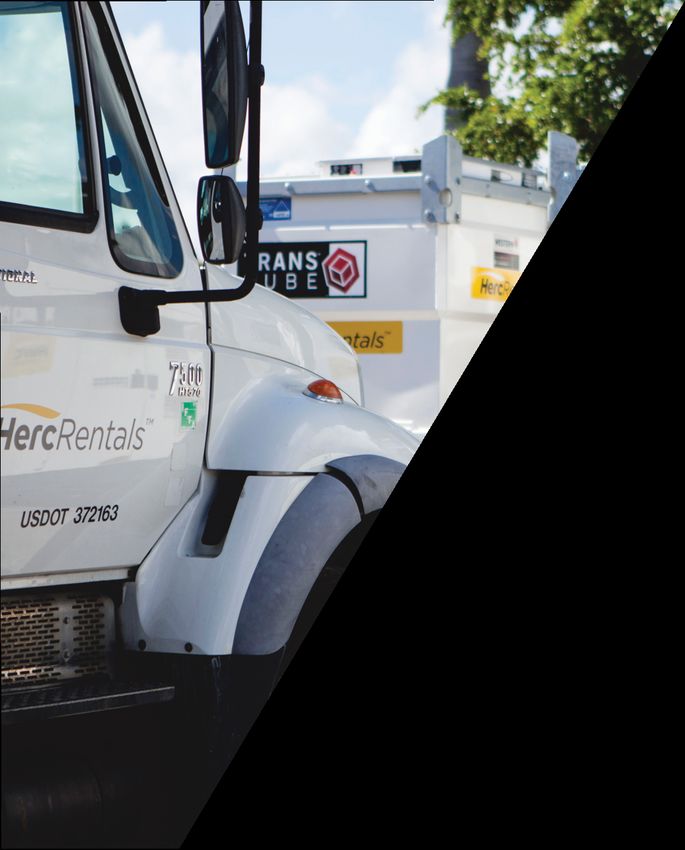
We are a customer-centric                             Our
 organization focused on                             Vision
  safety, efficiency and                        We aspire to be the
    profitable growth                           supplier, employer
                                                 and investment of
                                               choice in our industry.

                              Our                                                    Our
                             Values                                                Mission
                          We do what’s right.                                 To ensure that end
                        We’re in this together.                             users of our equipment
                        We take responsibility.                              and services achieve
                         We achieve results.                                 optimal performance
                     We prove ourselves every day.                           safely, efficiently and
                                                                                  effectively.

                               NYSE: HRI                  ©2018 Herc Rentals Inc. All Rights Reserved.   6   6
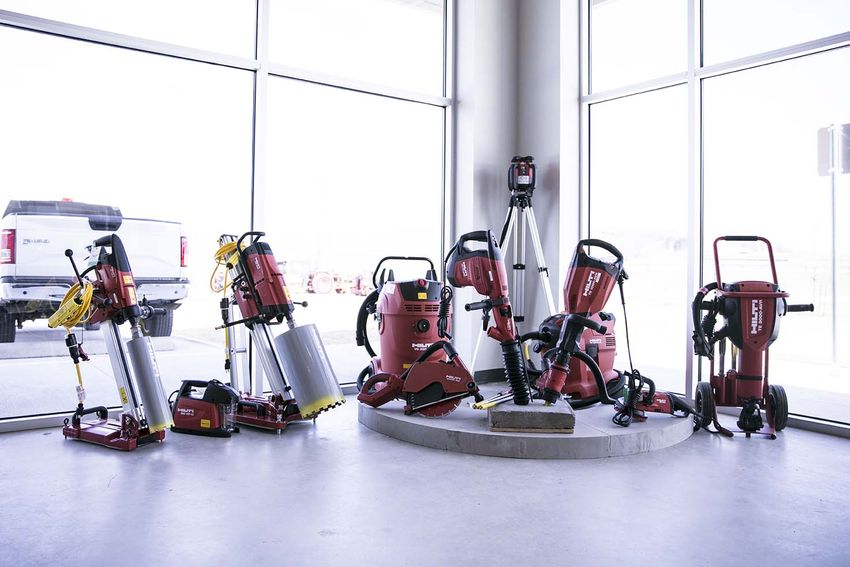
Herc Holdings Inc. Investor Presentation - San Francisco - Los Angeles Larry Silber, President & CEO Mark Irion, SVP & CFO Elizabeth Higashi, VP ...
Focus on Safety

                                              • 10% reduction in Total Recordable
                                                Incident Rate (TRIR) YoY for the LTM
                                                period ending June 30, 2018

                                              • Continued focus on a goal of 100%
                                                Perfect Days – defined as:
                                                ◦ No OSHA recordable incidents
                                                ◦ No "at fault" motor vehicle accidents
                                                ◦ No DOT violations

                                              • Recorded at least 75% Perfect Days
                                                for the first six months of 2018 in each
                                                region

                                              • Focused on communications and
                                                training programs designed to ensure
                                                our team and customers operate
                                                safely, efficiently and effectively

Herc Rentals team in Newark, NJ

                                  NYSE: HRI                 ©2018 Herc Rentals Inc. All Rights Reserved.   7
Herc Holdings Inc. Investor Presentation - San Francisco - Los Angeles Larry Silber, President & CEO Mark Irion, SVP & CFO Elizabeth Higashi, VP ...
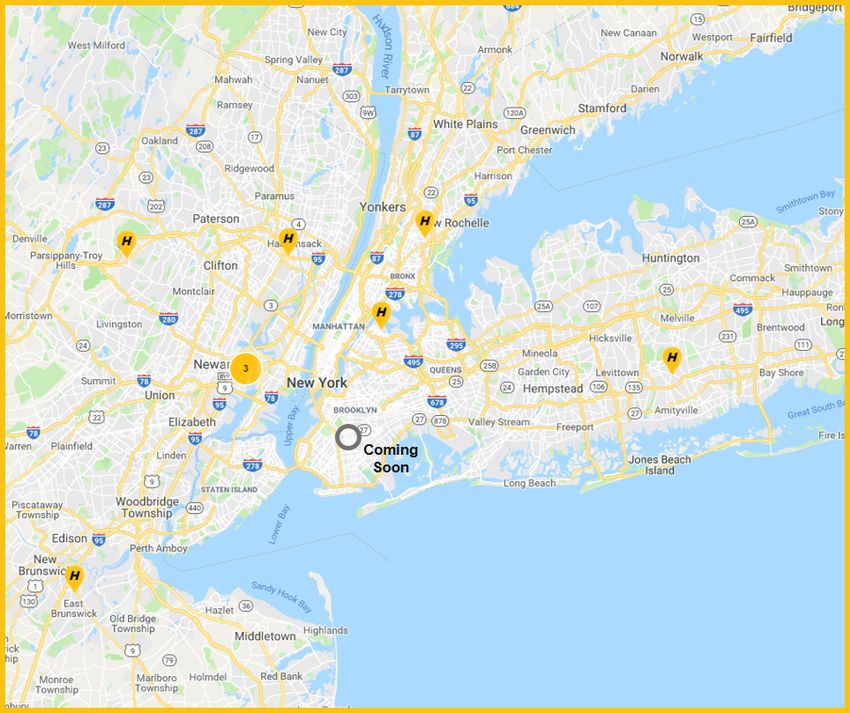
Our Strategic Initiatives

                                                             Enhance
   Expand and           Improve Operating                                           Disciplined Capital
                                                             Customer
Diversify Revenues        Effectiveness                                                Management
                                                            Experience

ü Broaden customer      ü Focus on safety,            ü Provide premium            ü Drive EBITDA
  base                    labor productivity,           products and                 margin growth
                          and warranty                  solutions-based
ü Expand products and     recovery                      services                   ü Improve key financial
  services                                                                           metrics
                        ü Increase density in         ü Introduce innovative
ü Grow pricing and        large urban markets           technology solutions       ü Maximize fleet
  ancillary revenues                                                                 management and
                        ü Improve vendor              ü Maintain customer            utilization
ü Improve sales force     management and                friendly showrooms
  effectiveness           fleet availability            and facilities

                                                NYSE: HRI                 ©2018 Herc Rentals Inc. All Rights Reserved.   8   8
Herc Holdings Inc. Investor Presentation - San Francisco - Los Angeles Larry Silber, President & CEO Mark Irion, SVP & CFO Elizabeth Higashi, VP ...
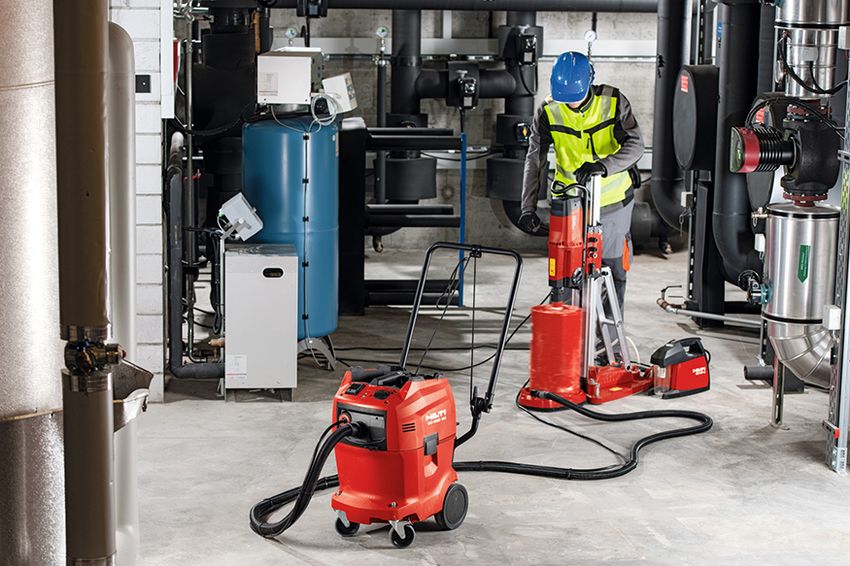
Our Strategy is Delivering Results

ü   Our strategic initiatives drove volume growth and
    improved price and mix

ü   Focus on ProSolutionsTM and ProContractor equipment
    continues to drive new customer and local account growth

ü   We continue to invest in people, training and
    operations to drive operational effectiveness

ü   We are focused on improving operating
    efficiencies to increase EBITDA margin

                                      NYSE: HRI          ©2018 Herc Rentals Inc. All Rights Reserved.   9   9
Herc Holdings Inc. Investor Presentation - San Francisco - Los Angeles Larry Silber, President & CEO Mark Irion, SVP & CFO Elizabeth Higashi, VP ...
Summary of Q2 2018 Results

                                                                                                   $392.5 million
           Equipment Rental Revenue
                                                                                                    +11.9% YoY

               Average Fleet1 Growth                                                                  +5.7% YoY

                           Pricing1                                                                   +2.9% YoY

                                                                                                  $(0.3) million
                  Net Income (Loss)
                                                                                                +$27.3 million YoY

                                                                                               $152.2 million
                  Adjusted EBITDA2
                                                                                         31.3% Margin, (70) bps YoY

                                                                                                      35.4%
                   Dollar Utilization1
                                                                                                   +140 bps YoY

1.   Based on ARA guidelines
2.   For a reconciliation to the most comparable GAAP financial measure, see the Appendix beginning on Slide 29

                                                                NYSE: HRI                             ©2018 Herc Rentals Inc. All Rights Reserved.   10 10
Strong Q2 2018 Performance

          YoY Rental Revenue Growth                                               YoY Pricing1

                      2017           2018
                                                                                       2017          2018

                                            16.2%
    15.1%                    14.7%                                                                            3.0%
                                                                        2.8%          2.9%
                     11.9%
                                                                                              1.7%
              7.0%                                                             1.4%
                                                                 1.1%
4.2%

                                                                     Q1           Q2             Q3               Q4
   Q1            Q2             Q3             Q4

 YoY Change in Average Fleet at OEC1                            YoY Change in Average OEC Fleet on Rent1

                      2017           2018

                                                                                       2017          2018

                     5.7%                                                                                     7.7%
5.3%                                                                    7.1%                  6.6%
              4.7%
       3.3%                  3.2%           3.6%                                      4.8%

                                                                               2.5%

   Q1            Q2             Q3             Q4
                                                                 (0.6)%
                                                                     Q1           Q2              Q3              Q4
1. Based on ARA guidelines

                                                    NYSE: HRI                     ©2018 Herc Rentals Inc. All Rights Reserved.   11 11
Successfully Expanding Products and Services

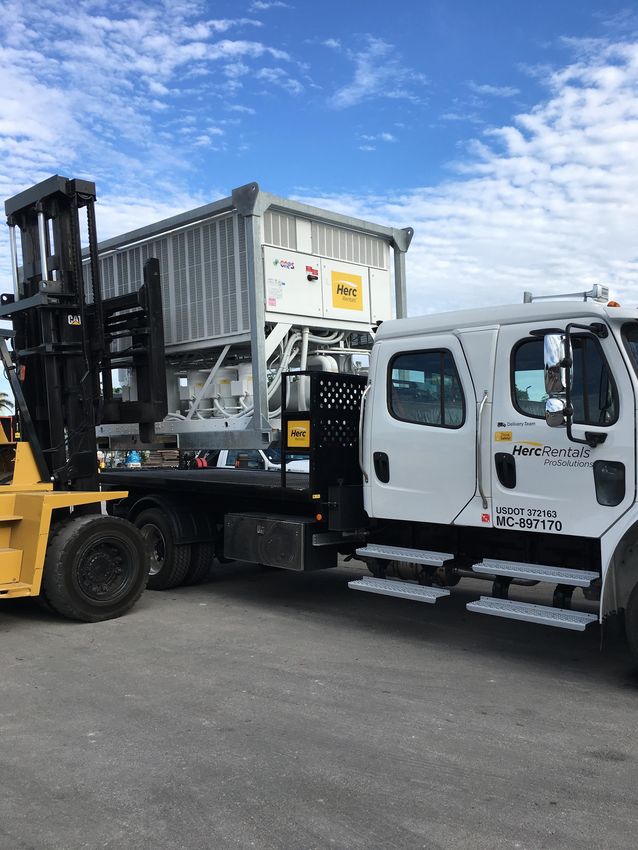
Classic                            ProSolutionsTM                     ProContractor
Our Classic fleet includes         Our industry-specific solutions-   A wide variety of tools and
aerial, earthmoving, material      based services include:            equipment that supports
handling, trucks and trailers,     • Power Generation                 various types of contractors
air compressors, compaction        • Climate Control                  that fit our urban market
and lighting                       • Remediation & Restoration        strategy and "square footage
                                   • Studio & Production              under roof" focus
                                     Equipment

                                              NYSE: HRI               ©2018 Herc Rentals Inc. All Rights Reserved.   12
Improving Fleet Mix to Drive Growth

     YoY Basis Point Change in $ Utilization1
                                                                                    • $ Utilization increased 140 bps YoY to 35.4%
                                2017            2018
                                                                                    • Continued to diversify equipment in key
                                                                                      categories to drive higher $ utilization
                                         350           360
           330
                                                                                        ◦ Increased mix of ProSolutionsTM and
                                                                                          ProContractor fleet YoY
                            140                                                         ◦ Continued to optimize Classic fleet categories
                      50
                                                                                    • Average fleet age improved to 46 months in Q2
                                                                                      2018 from 48 months in Q2 2017
     (40)
         Q1                Q2                 Q3           Q4

                    Fleet Composition                                                 % of Selected Fleet at OEC1 vs. Prior Year
As of June 30, 2018                    $3.87 billion at OEC 1                                                           2017                2018
                                                                                   As of June 30,

                    Trucks &
                     Trailers      Other                                                                                       13.4%
                                   8.5%                ProSolutions™                 ProSolutions™
         Material     12.7%                                                                                                                            13.5%
         Handling                                         13.5%
          17.2%                                                                                                              12.3%
                                                                                         Trucks and
                                                                                            Trailers                                                12.7%
                                        Specialty
                                         19.9%                                        Earthmoving -            7.6%
     Earthmoving                                                                           Compact                                   8.5%
        15.1%
                                                       ProContractor                                       7.2%
                                                                                    Aerial - Scissors
                      Aerial                               6.4%                                                               7.7%
                      26.6%
                                                                                                        5.7%
                                                                                      ProContractor
                                                                                                                      6.4%

1. Based on ARA guidelines

                                                                       NYSE: HRI                                ©2018 Herc Rentals Inc. All Rights Reserved.   13 13
Market Leader with Significant Scale and Broad Footprint

                                           Driving Urban Market Density
                                Approximately 275 locations, principally in North America1

Source: ARA HIS Global Insights May 2018
1. Locations as of June 30, 2018

                                                      NYSE: HRI                ©2018 Herc Rentals Inc. All Rights Reserved.   14
Ongoing Strategy: Driving Urban Market Density

• Diversification of fleet and customers
 ◦   Drives new customer revenue
 ◦   Increases branch fleet on rent (volume)
 ◦   Improves mix, drives yield and $ utilization
 ◦   Improves branch operating efficiencies

• Local branch footprint = “One Stop Shop”
 ◦ Makes doing business easier
 ◦ Improves customer service

• Urban market density accelerates conversion
  to rental versus ownership
 ◦ Reduces customer costs, eliminates storage
   and staff requirements
 ◦ Time = $$$ for our customers

• Encourages internal “Just Say Yes” customer
  service culture

                                                                                   NYC / NJ District

                                           NYSE: HRI    ©2018 Herc Rentals Inc. All Rights Reserved.   15
Improving Customer Mix and Diversification

         Local vs National % Mix in Q21                                      Q2 Revenue by Customer

                         2017      2018                                 Other: 21%

                                                                                                             Contractors: 34%
                 57%
           53%
                                    47%
                                          43%
                                                            Infrastructure and
                                                             Goverment: 16%

                                                                                                Industrial: 29%
              Local                  National

    Strong Q2 YoY Local Revenue1 Growth

                         2017      2018

                 18.0%

         10.9%

                                          2.7%
                                   1.0%

             Local                   National

1. North America rental revenues

                                                      NYSE: HRI                      ©2018 Herc Rentals Inc. All Rights Reserved.   16
Enhancing Operating Effectiveness

• Focusing on reduction/control of direct
  operating expense and selling, general
  and administrative costs
 ◦ Rolling out XPO Logistics to improve
   efficiency, reduce delivery costs and
   capture related ancillary revenues
 ◦ Continuing to focus on maintenance and
   spare parts cost controls and reductions
 ◦ Implementing centralized fuel purchasing
   programs to minimize costs and maximize
   efficiency
• Focusing on reducing turnover to
  increase productivity
 ◦ Investing in training programs to improve
   operational effectiveness

                                           NYSE: HRI         ©2018 Herc Rentals Inc. All Rights Reserved.   17 17
Enhancing Operating Effectiveness

                                       • Completed multi-phase IT separation from Hertz to
                                         establish our own dedicated ERP platform

                                                                       October 2017
                                                                   RentalMan operational
                                                                   system established on
                                                                      Herc IT platform
                           June 30, 2016
                       Herc Holdings and "New
                           Hertz" separate

                                                                                                                  July 2018
                                                                                                             Herc completes final
                                                                                                          separation of all IT systems
                                                                                                          from "New Hertz," finalizing
                                                                                                             Herc's independence

                                                          June 2017
                                                    Herc makes decision
                                                to move forward with existing
                                                   operational and financial
           May 2015                                       IT systems
Preparations begin to separate
Hertz rental car and equipment
       rental businesses

                                                 NYSE: HRI                            ©2018 Herc Rentals Inc. All Rights Reserved.       18 18
Enhancing Customer Experience through Technology

ProControl

•   ProControl provides account management,
    location tracking, utilization and service
    updates

•   Rolled out new training programs for
    ProControl Telematics and Account
    Management

Herc on the Go

•   “Herc On the Go” rolled out across the U.S.
    at the beginning of 2018

•   Over ~80% of U.S.Classic and ProSolutions
    locations used “Herc On the Go” to make
    over 80% of their deliveries in Q2
                                                            Herc On the Go
•   “Herc On the Go” is improving customer                  Provides “estimated
    service and operating efficiencies by                   time of arrival” for the
    supplying up-to-date delivery and pick-up               customer and electronic
    information                                             signing capabilities and
                                                            text messages

                                                NYSE: HRI                 ©2018 Herc Rentals Inc. All Rights Reserved.   19 19
Strong Industry Outlook Supports Our Growth

                                                           1
                                             Starts 3Index
                               Architecture Billings
                             Non-Residential                                                                                                                      N.A. Equipment Rental Market 2
 as of July 2018                                                                                                                                ($ in billions)
                                                                                                                                                as of August 2018
                                                                                                                                                                                                                                   : 5.6%
                                                                                                                           June                                                                                       2E    CAGR
                                                                                                                                                                                                                ’17-‘2
                                                                                                                           51.3                                                                                                   $64
                                                                                                                                                                                                                                        $67
                                                                                                                                                                                                                            $61
                                                                                                                                                                                                                      $58
                                                                                                                                                                                                               $55
                                                                                                                                                                                                   $51
50                                                                                                                                                                                         $47 $49
                                                                                                                                                                                     $44
                                                                                                                                                                               $41
                                                                                                                                                $38                     $38
                                                                                                                                                                  $35
                                                                                                                                                      $31 $32
                                                            Jan-11
 Jan-05

           Jan-06

                    Jan-07

                               Jan-08

                                        Jan-09

                                                 Jan-10

                                                                     Jan-12

                                                                              Jan-13

                                                                                       Jan-14

                                                                                                Jan-15

                                                                                                         Jan-16

                                                                                                                  Jan-17

                                                                                                                           Jan-18
                                                                                                                                                08    09   10     11     12    13    14     15       16   17   18E 19E 20E 21E 22E

                Non-Residential Construction Spending3                                                                                                                        Industrial Spending4

(in billions)                                                                                                                                   ($ in billions)
as of August 2018                                                                               $298.5                                          as of July 2018
                                                          + 5.3%                                                                                                                          + 8.2
                                                                                                                                                                                                 %
                                                                                                                                                                                                                     $337
                              $283.6

                                                                                                                                                                  $311.4

                              2017                                                              2018E

                                                                                                                                                                  2017                                           2018E
 1.       The American Institute of Architects (AIA)
 2.       ARA / IHS Global Insight as of August 2018, excludes Party & Event data
 3.       Dodge Analytics U.S.
 4.       Industrial information resources U.S.

                                                                                                                                    NYSE: HRI                                 ©2018 Herc Rentals Inc. All Rights Reserved.                    20 20
Q2 2018
              Financials

NYSE: HRI   ©2018 Herc Rentals Inc. All Rights Reserved.   21 21
Q2 and Six Months Financial Summary

$ in millions, except EPS                               Three Months Ended June 30,                         Six Months Ended June 30,

                                                         2018             2017           % Chg.             2018              2017            % Chg.

Equipment Rental Revenue                                $392.5           $350.8           11.9%           $761.6            $671.4             13.4%

Total Revenues                                           485.5            415.8           16.8%            916.8             805.2             13.9%

Net Income (Loss)                                        (0.3)           (27.6)             NM             (10.4)            (66.8)              NM

Diluted Loss Per Share                                   (0.01)          (0.98)             NM             (0.37)            (2.36)              NM

Adjusted EBITDA1                                        $152.2           $133.1           14.4%           $284.9            $230.9             23.4%

      NM = not meaningful

     1.   For a reconciliation to the most comparable GAAP financial measure, see the Appendix beginning on Slide 29

                                                                    NYSE: HRI                             ©2018 Herc Rentals Inc. All Rights Reserved.   22 22
Q2 and Six Months Total Revenues

                                                                                                           Q2 YoY Total Revenues
                               Q2 Total Revenues Bridge
 $ in millions
                                                                                               •   Total revenues increased 16.8%, or $69.7
                                                       $31.5                          $485.5
                                     $39.7
                                                                                                   million, in Q2 2018
                                                                         $(4.0)
   $415.8          $2.5

                                                                                               •   Equipment rental revenue increased 11.9% in
                                                                                                   Q2 2018
                                                                                                     ◦   Continued improvements in volume,
                                                                                                         price and mix
                                                                                                     ◦   Substantial growth from ProSolutionsTM
     2017         Currency
                 translation
                                 Equipment rental Sales of revenue
                                    revenue       earning equipment
                                                                       Sales of new
                                                                      equipment and
                                                                                       2018              and ProContractor
                                                                          other
                                                                                                     ◦   Strong growth across North America

                                                                                               •   Pricing1 improved 2.9%, OEC on rent1
                    Six Months Total Revenues Bridge
                                                                                                   increased 4.8% and mix and other contributed
 $ in millions                                                                                     the remainder of the improvement in Q2 2018

                                                       $24.1                          $916.8
                                      $86.1                                                    •   Sales of revenue earning equipment increased
    $805.2          $5.0                                                 $(3.6)                    68.5%, or $31.8 million, in Q2 2018
                                                                                                    ◦    In Q2 2018, total OEC1 of $179 million
                                                                                                         was sold and generated ~44% proceeds
                                                                                                         as a % of OEC1
      2017        Currency       Equipment rental Sales of revenue     Sales of new    2018
                 translation        revenue       earning equipment   equipment and
                                                                          other

1. Based on ARA guidelines.

                                                                                  NYSE: HRI               ©2018 Herc Rentals Inc. All Rights Reserved.   23 23
Q2 and Six Months Adjusted EBITDA1

                               Q2 Adjusted EBITDA Bridge                                                                Q2 Adjusted EBITDA
$ in millions
                                                                                                           •   YoY adjusted EBITDA increased $19.1
                                                                                                               million or 14.4% in Q2 2018
                                 $39.7          $7.4
                                                                                               $152.2      •   Higher equipment rental revenue of $39.7
       $133.1      $0.5                                                                                        million was the largest contributor to the
                                                           $(23.6)        $(4.7)   $(0.2)
                                                                                                               improvement

                                                                                                           •   Improved results from sales of revenue
                                                                                                               earning equipment related to increased
                                                                                                               volume
         2017    Currency       Equipment Gain/loss    Direct operating   SG&A     All other    2018
                 translation    Rental    on sales of     expenses
                                Revenue   revenue earning
                                          equipment                                                        •   DOE accounted for $23.6 million of additional
                                                                                                               expense, due to increases in fleet and
                                                                                                               related expenses, and personnel costs
                    Six Months Adjusted EBITDA Bridge                                                          associated with higher rental activities
 $ in millions                                $13.1
                                 $86.1                                                                     •   SG&A increase was driven primarily by
                                                                          $1.2                 $284.9
                                                                                                               increases in sales personnel and related
      $230.9       $1.1                                   $(47.2)                  $(0.3)                      commissions on increased revenue growth

        2017     Currency       Equipment Gain/loss    Direct operating   SG&A     All other    2018
                 translation    Rental    on sales of     expenses
                                Revenue   revenue earning
                                          equipment

1. For a reconciliation to the most comparable GAAP financial measure, see the Appendix beginning on Slide 29

                                                                                               NYSE: HRI               ©2018 Herc Rentals Inc. All Rights Reserved.   24 24
Q2 and Six Months Net Results

                                  Q2 Net Results Bridge                                                                        Q2 Net Results
$ in millions
                                                                                                           •   Net results improved to a loss of $0.3 million in
                                                                           $16.7                               Q2 2018 compared to a loss of $27.6 million in
                                                                                            $(0.3)             the prior year
                                                             $29.2
                                                                                                           •   Income taxes increased $23.0 million

  $(27.6)                                                                                                  •   Estimated effective tax rate of ~28% for the full
                                               $5.2                                                            year

                ($23.0)         ($0.8)                                                                     •   Interest expense increased slightly primarily due
   2017         Income tax      Interest      Spin-off      Impairment   Currency           2018
                                expense       costs                      translation                           to an increase in average outstanding
                                                                         and all other                         borrowings and a higher average interest rate
                                                                                                               on the revolving credit facility during the quarter
                                                                                                               compared with last year
  $ in millions

                              Six Months Net Results Bridge                                                •   Spin-off costs declined $5.2 million in Q2 2018
                                                                                                               as IT professional fees were reduced

                                                                               $47.3                       •   Last year's impairment charge was due to the
                                                                                                               write-off of intangible assets related to the
                                                                                              $(10.4)
                                                                                                               development of information technology systems
                                                                $29.2
                                                                                                           •   Currency translation and all other includes the
     $(66.8)                                      $7.9                                                         positive impact of our improved operating results
                                    $5.0
                                                                                                               (See Slide 36 in the Appendix for additional
                    ($33.0)                                                                                    details)
      2017         Income tax      Interest      Spin-off     Impairment    Currency           2018
                                   expense       costs                      translation
                                                                            and all other

                                                                                            NYSE: HRI                  ©2018 Herc Rentals Inc. All Rights Reserved.   25 25
Fleet at Original Equipment Cost (OEC)1

                   Fleet Ending Balance at OEC
                                                                                 •      Total fleet at OEC was $3.87 billion as of June 30,
   $ in billions
                                                                                        2018
                                       2017            2018

                                                                                 •      Average fleet at OEC increased 5.7% in Q2 2018
                                    $3.87                                               over the prior-year quarter
                   $3.73                       $3.75
                            $3.65                              $3.65
         $3.56                                                                   •      Fleet expenditures at OEC in Q2 2018 were $321.0
                                                                                        million, an increase of 47.9% over the prior-year
                                                                                        quarter

                                                                                 •      Average fleet age improved to 46 months in Q2 2018
                                                                                        compared with 48 months in Q2 2017
                 Q1               Q2                 Q3              Q4

                      Fleet Expenditures at OEC                                                         Fleet Disposals at OEC
 $ in millions                                                                       $ in millions
                                   2017              2018
                                                                                                                   2017          2018

                                  $321

                           $217
                 $198                                                                                             $179
                                                                                                                                           $145
        $119                                  $126                                          $120 $109      $111
                                                              $62                                                          $66

            Q1               Q2                 Q3              Q4                              Q1           Q2               Q3               Q4

1. Original equipment cost based on ARA guidelines

                                                                            NYSE: HRI                         ©2018 Herc Rentals Inc. All Rights Reserved.   26
Disciplined Capital Management

                      Net Leverage1                                                                              Liquidity
                                                                                  $ in millions, as of 06/30/2018

            4.1x                                                                       ABL Facility                                        $1,750.0
                            3.6x
                                            3.3x
                                                                                       Outstanding                                         (1,110.0)
                                                                                       Letters of Credit                                        (22.8)
                                                                                       Availability from ABL                                   $617.2
                                                                                       Cash & Cash Equivalents                                   44.0
                                                                                      Total Liquidity                                          $661.2
            Q2 2017           Q4 2017           Q2 2018

• Net leverage improved to ~3.3x1                                                                              Maturities
    ◦ Stable debt of ~$2.15 billion                                               $ in millions, as of 06/30/2018

                                                                                                                    ABL Credit
• Ample liquidity and long dated maturities                                                                          Facility
  provide financial flexibility                                                                                      $1,110
                                                                                                                                   Senior Secured
    ◦ $661 million of liquidity                                                           Capital Leases and                     Second Priority Notes
                                                                                           Other Borrowings
    ◦ No near term maturities                                                                    $49.2

• Net cash from operating activities totaled
  $233 million, with net fleet capex1 of $170                                                                                    $488             $500

  million and free cash flow1 of $32 million
                                                                                        '18       '19      '20         '21       '22     '23      '24
• Partial redemption of our senior secured
  second priority notes in July 2018
   1. For a definition and reconciliation to the most comparable GAAP financial measure, see the Appendix beginning on Slide 29

                                                                   NYSE: HRI                              ©2018 Herc Rentals Inc. All Rights Reserved.   27 27
Initiatives to Drive Adjusted EBITDA Growth

         Revenue Growth Initiatives                                       Operating Initiatives

                                        TM                     ü Focus on safety and training initiatives to
ü Diversify fleet through ProSolutions       and
  ProContractor                                                  continue to improve safety metrics

ü Focus on premium brands                                      ü Continue to implement the Herc Way
                                                                 operating model
ü Diversify customer mix
                                                               ü Focus on reducing logistics costs
ü Increase density in high growth urban
  markets                                                      ü Work with regional fuel providers to
                                                                 centralize purchases
ü Optimize pricing though proprietary
  technology                                                   ü Improve labor productivity through training
                                                                 programs
ü Improve ancillary revenues
                                                               ü Enhance maintenance efficiency, warranty
ü Enhance online and mobile initiatives                          recovery and inventory management

ü Improve ProControl Telematics services for                   ü Continue to enhance scale through density
  strategic customers                                            in large urban markets

                                                   NYSE: HRI                  ©2018 Herc Rentals Inc. All Rights Reserved.   28 28
Q4 and FY 2017
             Appendix
              Financials

NYSE: HRI     ©2018 Herc Rentals Inc. All Rights Reserved.   29
Glossary of Terms Commonly Used in the Industry

1   OEC: Original Equipment Cost which is an operating measure based on the guidelines of the American Rental
    Association (ARA), which is calculated as the cost of the asset at the time it was first purchased plus additional
    capitalized refurbishment costs (with the basis of refurbished assets reset at the refurbishment date).

2    Fleet Age: The OEC weighted age of the entire fleet, based on ARA guidelines.

3   Net Fleet Capital Expenditures: Capital expenditures of revenue earning equipment minus the proceeds from disposal
    of revenue earning equipment, based on ARA guidelines.

4   Dollar Utilization ($ UT): Dollar utilization is an operating measure calculated by dividing rental revenue by the average
    OEC of the equipment fleet for the relevant time period, based on ARA guidelines.

5   Pricing: Change in pure pricing achieved in one period versus another period. This is applied both to year-over-year
    and sequential comparisons. Rental rates are based on ARA guidelines and are calculated based on the category class
    rate variance achieved either year-over-year or sequentially for any fleet that qualifies for the fleet base and weighted by
    the prior year revenue mix.

6
    FUR: Fleet unavailable for rent.

                                                           NYSE: HRI                      ©2018 Herc Rentals Inc. All Rights Reserved.   30 30
Reconciliation of Net Income to EBITDA & Adj. EBITDA
                                   and Adj. EBITDA Margin and Flow-Through
EBITDA and Adjusted EBITDA are not recognized terms under GAAP and should not be considered
in isolation or as a substitute for our reported results prepared in accordance with GAAP. Further,
since all companies do not use identical calculations, our definition and presentation of these
measures may not be comparable to similarly titled measures reported by other companies.
EBITDA and Adjusted EBITDA - EBITDA represents the sum of net income (loss), provision (benefit)
for income taxes, interest expense, net, depreciation of revenue earning equipment and non-rental
depreciation and amortization. Adjusted EBITDA represents EBITDA plus the sum of merger and
acquisition related costs, restructuring and restructuring related charges, spin-off costs, non-cash stock
based compensation charges, loss on extinguishment of debt (which is included in interest expense,
net), impairment charges, gain on disposal of a business and certain other items. Management uses
EBITDA and Adjusted EBITDA to evaluate operating performance and period-over-period performance
of our core business without regard to potential distortions, and believes that investors will likewise find
these non-GAAP measures useful in evaluating the Company’s performance. However, EBITDA and
Adjusted EBITDA do not purport to be alternatives to net income as an indicator of operating
performance. Additionally, neither measure purports to be an alternative to cash flows from operating
activities as a measure of liquidity, as they do not consider certain cash requirements such as interest
payments and tax payments.
Adjusted EBITDA Margin and Flow-Through - Adjusted EBITDA Margin (Adjusted EBITDA/Total
Revenues) and Flow-Through (the year-over-year change in Adjusted EBITDA/the year-over-year
change in Total Revenues) are commonly-used profitability ratios. Adjusted EBITDA Margin and Flow-
Through do not purport to be alternatives to Net Margin (Net Income/Total Revenues as calculated
under GAAP) as an indicator of profitability, as they do not account for GAAP reportable expenses such
as depreciation and interest or the expense or benefit from income taxes.
These measures are frequently used by security analysts, institutional investors and other interested
parties in the evaluation of companies in our industry.

                                                NYSE: HRI                 ©2018 Herc Rentals Inc. All Rights Reserved.   31 31
Reconciliation of Net Income to EBITDA & Adj. EBITDA and
                                                  Adj. EBITDA Margin and Flow-Through
$ in millions
                                                                         Three Months Ended June 30,                                       Six Months Ended June 30,

                                                                                 2018                            2017                           2018                            2017
Net income (loss)                                                                          ($0.3)                       ($27.6)                         ($10.4)                         ($66.8)
Income tax provision (benefit)                                                                0.8                         (22.2)                            (4.3)                         (37.3)
Interest expense, net                                                                       32.4                           31.6                            64.4                            69.4
Depreciation of revenue earning equipment                                                   97.0                           94.3                          190.3                           187.2
Non-rental depreciation and amortization                                                    13.7                           12.6                            27.5                            24.3
EBITDA                                                                                    143.6                            88.7                          267.5                           176.8
Restructuring and restructuring related                                                        —                             2.2                             1.0                             2.8
Spin-off costs                                                                                3.9                            9.1                             8.8                           16.7
Non-cash stock-based compensation charges                                                     3.8                            3.0                             6.6                             4.5
Impairment                                                                                    0.1                          29.3                              0.1                           29.3
Other1                                                                                        0.8                            0.8                             0.9                             0.8
Adjusted EBITDA                                                                         $152.2                          $133.1                         $284.9                          $230.9

Total Revenues                                                                          $485.5                          $415.8                         $916.8                          $805.2
Adjusted EBITDA                                                                         $152.2                          $133.1                         $284.9                          $230.9
Adjusted EBITDA Margin                                                                      31.3%                          32.0%                           31.1%                           28.7%

YOY Change in Adjusted EBITDA                                                                                             $19.1                                                          $54.0
YOY Change in Total Revenues                                                                                              $69.7                                                        $111.6
Flow-Through                                                                                                               27.4%                                                           48.4%
(1) Comprised primarily of a one-time cash separation benefit paid to our former Chief Financial Officer as part of her Retirement and Separation Agreement for the three and six months ended June
30, 2018 and transaction costs for the three and six months ended June 30, 2017.

                                                                                         NYSE: HRI                                       ©2018 Herc Rentals Inc. All Rights Reserved.                 32 32
Reconciliation of Net Leverage Ratio

Net Leverage Ratio –The Company has defined its net leverage ratio as net debt, as calculated
below, divided by adjusted EBITDA for the trailing twelve-month period. This measure should be
considered supplemental to and not a substitute for financial information prepared in accordance with
GAAP. The Company’s definition of this measure may differ from similarly titled measures used by
other companies.

 $ in millions                                              Q2 2018          Q4 2017                    Q2 2017

  Long-Term Debt, Net                                       $2,109.6          $2,137.1                   $2,145.4

  (Plus) Current maturities of long-term debt                   24.2                22.7                       16.0

  (Plus) Unamortized debt issuance costs                        13.4                14.5                       17.7

  (Less) Cash and Cash Equivalents                             (44.0)              (41.5)                     (22.3)

  Net Debt                                                  $2,103.2          $2,132.8                   $2,156.8

  Trailing Twelve-Month Adjusted EBITDA                       $639.4             $585.4                     $528.7

  Net Leverage                                                3.3x               3.6x                       4.1x

                                                NYSE: HRI               ©2018 Herc Rentals Inc. All Rights Reserved.   33 33
Reconciliation of Free Cash Flow

Free cash flow is not a recognized term under GAAP and should not be considered in isolation
or as a substitute for our reported results prepared in accordance with GAAP. Further, since all
companies do not use identical calculations, our definition and presentation of this measure may
not be comparable to similarly titled measures reported by other companies.

Free cash flow represents net cash provided by (used in) operating activities less revenue
earning equipment expenditures and non-rental capital expenditures, plus proceeds from
disposal of revenue earning equipment, proceeds from disposal of property and equipment, and
other investing activities. Free cash flow is used by management in analyzing the Company’s
ability to service and repay its debt and to forecast future periods. However, this measure does
not represent funds available for investment or other discretionary uses since it does not deduct
cash used to service debt or for other non-discretionary expenditures.

                                                                      Six Months Ended June 30,

$ in millions                                                        2018                          2017
 Net cash provided by operating activities                            $232.9                        $126.3

 Revenue earning equipment expenditures                               (300.5)                        (160.8)

 Proceeds from disposal of revenue earning equipment                   130.1                           88.6

 Net Fleet Capital Expenditures                                       (170.4)                         (72.2)

 Non-rental capital expenditures                                       (33.2)                         (26.0)

 Proceeds from disposal of property and equipment                        2.4                             1.7

 Free Cash Flow                                                        $31.7                          $29.8

                                                       NYSE: HRI            ©2018 Herc Rentals Inc. All Rights Reserved.   34 34
Historic Fleet at OEC1

                                        Q1        Q2        Q3        Q4       FY       Q1       Q2        Q3         Q4        FY         Q1           Q2
         $ in millions                 2016      2016      2016      2016     2016     2017     2017      2017       2017      2017       2018         2018

Beginning Balance – Fleet at OEC       $3,384 $3,391 $3,537 $3,616 $3,384 $3,556 $3,556 $3,653 $3,752 $3,556 $3,651 $3,732

Expenditures – Fleet at OEC               $90     $220      $142       $43     $495     $119     $217       $126        $62      $524      $198         $321

Disposals – Fleet at OEC                 ($96)     ($85)    ($57)     ($90)   ($328)   ($120)   ($111)      ($66)    ($145)     ($442)    ($109)       ($179)

Foreign Currency / Other                  $13      $11       ($6)     ($13)      $5       $1      ($9)       $39       ($18)      $13        ($8)        ($1)

Ending Balance – Fleet at OEC          $3,391 $3,537 $3,616 $3,556 $3,556 $3,556 $3,653 $3,752 $3,651 $3,651 $3,732 $3,873

   1. Original equipment cost based on ARA guidelines

                                                                    NYSE: HRI                           ©2018 Herc Rentals Inc. All Rights Reserved.      35 35
Net Results Bridge

                                                       Three Months Ended June 30,                                                 Elements of Net Income (Loss) Bridge

                                                                                                           Currency
$ in millions                                        2018             2017             $ Change           translation         Income tax         Spin-off costs      Impairment       Interest Expense    All Other

   Total revenues                                           $485.5           $415.8           $69.7                 $2.5               $—                    $—               $—                   $—            $67.2

Direct operating                                             194.5            168.6               25.9                  1.3                —                  —               —                     —             24.6

Depreciation of revenue earning equipment                     97.0             94.3                2.7                  0.5                —                  —               —                     —                 2.2

Cost of sales of revenue earning equipment                    75.8             51.4               24.4                  0.3                                   —               —                     —             24.1

Cost of sales of new equipment, parts and supplies             8.1             11.1               (3.0)                 0.1                —                  —               —                     —                 (3.1)

Selling, general and administrative                           77.3             78.8               (1.5)                 0.4                —                 (5.2)            —                     —                 3.3

Impairment                                                     0.1             29.3           (29.2)                    —                  —                  —             (29.2)                  —                 —
Interest expense, net                                         32.4             31.6                0.8                  —                  —                  —               —                    0.8                 —

Other expense (income), net                                   (0.2)             0.5               (0.7)                 0.1                —                  —               —                     —                 (0.8)

   Income (loss) before income taxes                           0.5            (49.8)              50.3              (0.2)                  —                 5.2             29.2                 (0.8)           16.9

Income tax benefit (provision)                                (0.8)            22.2           (23.0)                    —             (23.0)                  —                   —                 —                  —

   Net income (loss)                                         ($0.3)          ($27.6)          $27.3                ($0.2)            ($23.0)                $5.2            $29.2                ($0.8)          $16.9

                                                        Six Months Ended June 30,                                                  Elements of Net Income (Loss) Bridge

                                                                                                           Currency
$ in millions                                        2018             2017             $ Change           translation         Income tax         Spin-off costs      Impairment       Interest Expense    All Other

   Total revenues                                           $916.8           $805.2          $111.6                $5.0                $—                   $—                $—                  $—           $106.6

Direct operating                                             390.5            337.5               53.0              2.7                    —                  —               —                     —             50.3

Depreciation of revenue earning equipment                    190.3            187.2                3.1              1.1                    —                  —               —                     —                 2.0

Cost of sales of revenue earning equipment                   117.8            106.3               11.5              0.5                                       —               —                     —             11.0

Cost of sales of new equipment, parts and supplies            17.1             19.5               (2.4)             0.1                    —                  —               —                     —                 (2.5)

Selling, general and administrative                          151.8            159.9               (8.1)             0.7                    —                (7.9)             —                     —                 (0.9)

Impairment                                                     0.1             29.3           (29.2)                    —                  —                  —             (29.2)                  —                  —

Interest expense, net                                         64.4             69.4               (5.0)                 —                  —                  —               —                   (5.0)                —

Other expense (income), net                                   (0.5)             0.2               (0.7)             0.1                    —                  —               —                     —                 (0.8)

   Income (loss) before income taxes                         (14.7)          (104.1)              89.4              (0.2)                  —                 7.9             29.2                  5.0            47.5

Income tax benefit (provision)                                 4.3             37.3           (33.0)                    —            (33.0)                   —                   —                 —                  —

   Net income (loss)                                        ($10.4)          ($66.8)          $56.4               ($0.2)            ($33.0)                 $7.9            $29.2                $5.0            $47.5

                                                                                       NYSE: HRI                                               ©2018 Herc Rentals Inc. All Rights Reserved.                                   36
SG&A Excluding Spin-off Costs

$ in millions               Q1 2017         Q2 2017           Q3 2017            Q4 2017            FY 2017               Q1 2018               Q2 2018

 SG&A                         $81.2              $78.8              $84.6               $76.0          $320.6                   $74.5                 $77.3

 Spin-off costs               ($7.6)             ($9.1)             ($10.3)             ($8.2)           ($35.2)                ($4.9)                ($3.9)

 SG&A excluding
                              $73.6              $69.7              $74.3               $67.8          $285.4                   $69.6                 $73.4
 Spin-off costs

        % of Total
                               18.9%              16.8%              16.2%               13.8%             16.3%                 16.1%                    15.1%
        Revenue

                                                 SG&A Expense (excluding Spin-off costs)
                                                        as % of Total Revenue
   20.0%
                  18.9%

   18.0%
                                       16.8%
                                                          16.2%                                  16.3%                 16.1%
   16.0%                                                                                                                                     15.1%

                                                                              13.8%
   14.0%

   12.0%

   10.0%
                  Q1 2017              Q2 2017            Q3 2017             Q4 2017            FY 2017              Q1 2018               Q2 2018

                                                                       NYSE: HRI                           ©2018 Herc Rentals Inc. All Rights Reserved.      37 37
Expand and Diversify Revenues: Driving $ Utilization

                           OEC as of 06/30/17 1                                                                          OEC as of 06/30/18 1
                              $3.65 billion                                                                                     $3.87 billion
                              Lighting
                                                                                                                          Lighting
                                 1.8%
                                          Compaction                                                                         1.7%       Compaction
                            Other
                             2.6%         1.7%                                                                    Other                 1.6%
              Air Compressors                                                                                     2.7%
                         2.8%                                                                       Air Compressors
           ProContractor                                  Aerial - Booms                                       2.5%                                       Aerial - Booms
                    5.7%                                  18.9%                                  ProContractor                                            18.9%
                                                                                                          6.4%

ProSolutions™
         13.4%
                                                                                       ProSolutions™
                                                                                                13.5%                                                                  Aerial -
                                                                   Aerial -
                                                                                                                                                                       Scissors &
                                                                   Scissors &
                                                                                                                                                                       Other
                                                                   Other
                                                                                                                                                                       7.7%
                                                                   7.2%

                                                                                                                                                                      Earthmoving -
   Trucks and
                                                                 Earthmoving -                                                                                        Heavy
      Trailers
                                                                 Heavy                       Trucks and                                                               6.6%
        12.3%
                                                                 9.3%                           Trailers
                                                                                                  12.7%
               Material                                                                                                                                         Earthmoving -
            Handling -                                 Earthmoving -                                                                                            Compact
                                                                                                              Material
             Industrial                                Compact                                                                                                  8.5%
                               Material                                                                    Handling -
                 3.3%                                  7.6%
                            Handling -                                                                      Industrial
                                                                                                                                          Material Handling -
                          Telehandlers                                                                          4.1%
                                                                                                                                          Telehandlers
                                13.4%                                                                                                     13.1%

       Increased                                                                         Reduced
       • Aerial – Scissors & Other                                                       • Earthmoving - Heavy
       • Material Handling - Industrial                                                  • Material Handling - Telehandlers
       • ProContractor and ProSolutionsTM                                                • Air Compressors
            1. Original equipment cost based on ARA guidelines

                                                                                 NYSE: HRI                                  ©2018 Herc Rentals Inc. All Rights Reserved.            38 38
Investor Contact:
            Elizabeth M. Higashi, CFA
            Vice President, Investor Relations
            elizabeth.higashi@hercrentals.com
            239-301-1024 office

NYSE: HRI
You can also read