Hertsmere Borough Council: Local Plan Analysis Hertfordshire County Council - TIPSF Additional Modelling Support
←
→
Page content transcription
If your browser does not render page correctly, please read the page content below
7

Hertsmere Borough Council: Local Plan
Analysis

Hertfordshire County Council – TIPSF
Additional Modelling Support
Final Report
Project Number: 60639133

19th January 2021
Quality information
Prepared by            Checked by                Verified by             Approved by
HG/HK/XK               CW                        SK                      SK
Consultant and         Principal Consultant      Regional Director       Regional Director
Senior Consultants

Revision History
Revision       Revision date Details                           Authorized Position
V1             19th Oct 2020   Draft for client comment        SK         RD
V2             14th Dec 2020 Final incorporating client        CW         PC
                             (HBC/HCC) comments
V3             18th Jan 2021   Revised final incorporating  CW            PC
                               minor HBC/HCC clarifications

Distribution List
# Hard Copies PDF Required Association / Company Name

                                                                                         AECOM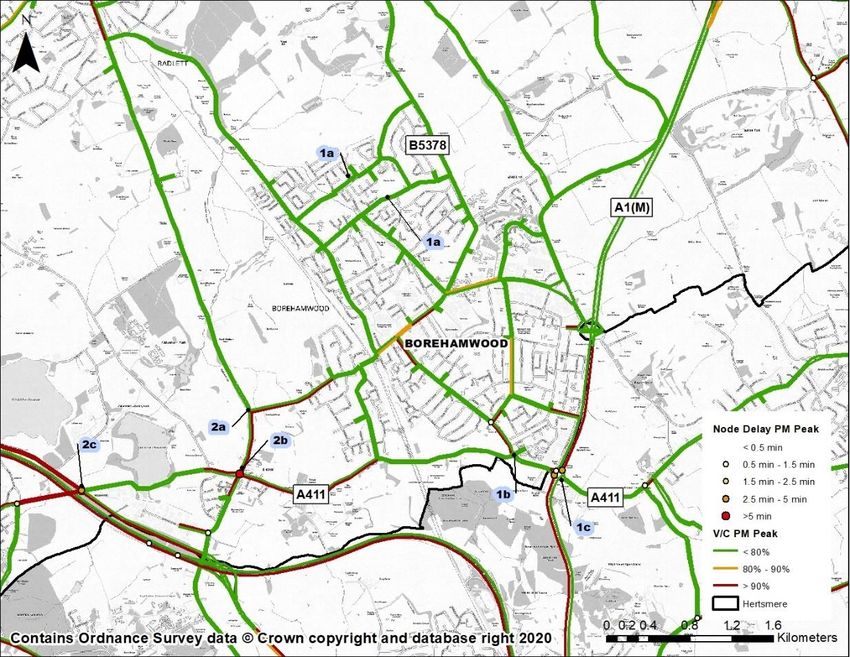
Prepared for:
Michael Scanlon
Hertsmere Borough Council

Prepared by:

AECOM Limited
AECOM House
63-77 Victoria Street
St Albans
Hertfordshire AL1 3ER
United Kingdom

T: +44(0)1727 535000
aecom.com

© 2021 AECOM Limited. All Rights Reserved.

This document has been prepared by AECOM Limited (“AECOM”) for sole use of our client (the “Client”) in
accordance with generally accepted consultancy principles, the budget for fees and the terms of reference
agreed between AECOM and the Client. Any information provided by third parties and referred to herein has not
been checked or verified by AECOM, unless otherwise expressly stated in the document. No third party may rely
upon this document without the prior and express written agreement of AECOM.

                                                                                                      AECOM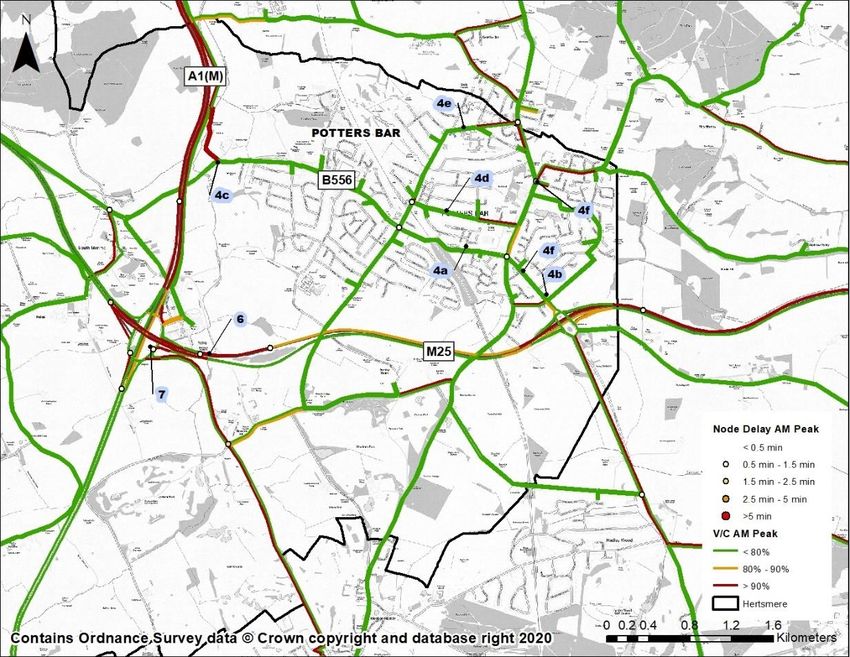
Table of Contents
1.           Executive Summary ......................................................................................... 7
Borehamwood and Elstree ................................................................................................................................ 8
Bushey ............................................................................................................................................................. 9
Potters Bar ..................................................................................................................................................... 10
Radlett and Shenley........................................................................................................................................ 11
Summary ........................................................................................................................................................ 12
2.           Introduction .................................................................................................... 13
Background and Model Versions ..................................................................................................................... 13
Caveats .......................................................................................................................................................... 17
Glossary ......................................................................................................................................................... 18
Purpose of This Report ................................................................................................................................... 19
3.           High-Level Base Model Review ..................................................................... 20
Base Year Review Conclusion ......................................................................................................................... 22
4.           Settlement Based Distribution Plots .............................................................. 23
Potters Bar ..................................................................................................................................................... 24
Elstree............................................................................................................................................................ 26
Borehamwood ................................................................................................................................................ 29
Bushey ........................................................................................................................................................... 32
Shenley .......................................................................................................................................................... 34
Radlett ........................................................................................................................................................... 36
South Mimms ................................................................................................................................................. 38
Summary ........................................................................................................................................................ 39
5.           Bowmans Cross Trip Distribution Analysis..................................................... 40
6.           2036 Traffic Conditions in Hertsmere............................................................. 43
Scenario 2 Node Delay and Link Stress ........................................................................................................... 44
Scenario 2 and Scenario 1 Comparison ........................................................................................................... 46
Scenario 2 and Base Year Comparison............................................................................................................ 48
Summary ........................................................................................................................................................ 50
7.           Journey Time Analysis ................................................................................... 57
Bowmans Cross Journey Time Analysis........................................................................................................... 62
8.           Scheme Assessment ..................................................................................... 64
9.           Public Transport Patronage ........................................................................... 67
10.          Conclusion, Summary & Discussion .............................................................. 69
Summary ........................................................................................................................................................ 69
Discussion ...................................................................................................................................................... 70
Appendix A : Scenario 2 Traffic Conditions ............................................................... 72
Appendix B : Scenario 1 Traffic Conditions .............................................................. 75
Appendix C : Scenario 2 and Scenario 1 Traffic Condition Comparison................... 81
Appendix D : Scenario 2 and Base Year Traffic Condition Comparison ................... 88

Figures
Figure 1-1: Scenario 2 Node Delay and Link Stress in Borehamwood - PM Peak ................................................ 8
Figure 1-2: Scenario 2 Node Delay and Link Stress in Watford - PM Peak .......................................................... 9
Figure 1-3: Scenario 2 Node Delay and Link Stress in Potters Bar - AM Peak ................................................... 10
Figure 1-4: Scenario 2 Node Delay and Link Stress in Radlett - AM Peak ......................................................... 11
Figure 3-1: COMET v5 Cordons and Screenlines (Hertsmere area highlighted .................................................. 20

                                                                                                                                                          AECOM
Figure 3-2: COMET v5 Journey Time Routes (Hertsmere area highlighted)....................................................... 21
Figure 4-1: Routeing Analysis from Potters Bar (AM peak) ............................................................................... 24
Figure 4-2: Routeing Analysis to Potters Bar (AM peak) ................................................................................... 24
Figure 4-3: Routeing Analysis from Potters Bar (PM peak) ............................................................................... 25
Figure 4-4: Routeing Analysis to Potters Bar (PM peak) ................................................................................... 25
Figure 4-5: Routeing Analysis from Elstree (AM peak) ...................................................................................... 26
Figure 4-6: Routeing Analysis to Elstree (AM peak) .......................................................................................... 27
Figure 4-7: Routeing Analysis from Elstree (PM peak) ...................................................................................... 27
Figure 4-8: Routeing Analysis to Elstree (PM peak) .......................................................................................... 28
Figure 4-9: Routeing Analysis from Borehamwood (AM peak) .......................................................................... 29
Figure 4-10: Routeing Analysis to Borehamwood (AM peak) ............................................................................ 30
Figure 4-11: Routeing Analysis from Borehamwood (PM peak) ......................................................................... 30
Figure 4-12: Routeing Analysis to Borehamwood (PM peak) ............................................................................ 31
Figure 4-13: Routeing Analysis from Bushey (AM peak) ................................................................................... 32
Figure 4-14: Routeing Analysis to Bushey (AM peak) ....................................................................................... 32
Figure 4-15: Routeing Analysis from Bushey (PM peak) ................................................................................... 33
Figure 4-16: Routeing Analysis to Bushey (PM peak) ....................................................................................... 33
Figure 4-17: Routeing Analysis from Shenley (AM peak) .................................................................................. 34
Figure 4-18: Routeing Analysis to Shenley (AM peak) ...................................................................................... 34
Figure 4-19: Routeing Analysis from Shenley (PM peak) .................................................................................. 35
Figure 4-20: Routeing Analysis to Shenley (PM peak) ...................................................................................... 35
Figure 4-21: Routeing Analysis from Radlett (AM peak) .................................................................................... 36
Figure 4-22: Routeing Analysis to Radlett (AM peak)........................................................................................ 36
Figure 4-23: Routeing Analysis from Radlett (PM peak).................................................................................... 37
Figure 4-24: Routeing Analysis to Radlett (PM peak)........................................................................................ 37
Figure 4-25: Routeing Analysis on the B556 Through South Mimms (AM peak) ................................................ 38
Figure 4-26: Routeing Analysis on the B556 Through South Mimms (PM peak) ................................................ 38
Figure 5-1: Routeing Analysis from Bowmans Cross (AM peak)........................................................................ 41
Figure 5-2: Routeing Analysis from Bowmans Cross (PM peak)........................................................................ 41
Figure 5-3: Routeing Analysis to Bowmans Cross (AM peak)............................................................................ 42
Figure 5-4: Routeing Analysis to Bowmans Cross (PM peak)............................................................................ 42
Figure 6-1: Scenario 2 Node Delay and Link Stress in Hertsmere - AM Peak .................................................... 45
Figure 6-2: Scenario 2 Node Delay and Link Stress in Hertsmere - PM Peak .................................................... 45
Figure 6-3: Flow and Delay difference between Scenarios 1 and 2 in Hertsmere - AM Peak .............................. 47
Figure 6-4: Flow and Delay difference between Scenarios 1 and 2 in Hertsmere - PM Peak .............................. 47
Figure 6-5: Flow and Delay difference between Scenario 2 and Base Year in Hertsmere - AM Peak .................. 49
Figure 6-6: Flow and Delay difference between Scenario 2 and Base Year in Hertsmere - PM Peak .................. 49
Figure 7-1: AM Journey Times Differences between Scenario 2 and the 2014 Base Year scenario .................... 59
Figure 7-2: IP Journey Times Differences between Scenario 2 and the 2014 Base Year scenario ...................... 59
Figure 7-3: PM Journey Times Differences between the Scenario 2 and the 2014 Base Year scenario............... 60
Figure 7-4: AM Journey Times Differences between Scenarios 1 and 2 ............................................................ 60
Figure 7-5: IP Journey Times Differences between Scenarios 1 and 2 .............................................................. 61
Figure 7-6: PM Journey Times Differences between Scenarios 1 and 2 ............................................................ 61
Figure 7-7: Location of Railway stations and Bowmans Cross Estate................................................................ 62
Figure 7-8: Journey times from and to Bowmans Cross Estate ......................................................................... 63
Figure 10-1: Scenario 2Node Delay and Link Stress in Borehamwood - AM Peak ............................................. 72
Figure 10-2: Scenario 2 Node Delay and Link Stress in Watford - AM Peak ...................................................... 73
Figure 10-3: Scenario 2 Node Delay and Link Stress in Potters Bar - PM Peak ................................................. 73
Figure 10-4 Scenario 2 Node Delay and Link Stress in Radlett - PM Peak ........................................................ 74
Figure 10-5: Scenario 1 Node Delay and Link Stress in Hertsmere - AM Peak .................................................. 75
Figure 10-6: Scenario 1 Node Delay and Link Stress in Hertsmere - PM Peak .................................................. 76
Figure 10-7: Scenario 1 Node Delay and Link Stress in Borehamwood - AM Peak ............................................ 76
Figure 10-8: Scenario 1 Node Delay and Link Stress in Borehamwood - PM Peak ............................................ 77
Figure 10-9: Scenario 1 Node Delay and Link Stress in Watford - AM Peak ...................................................... 77
Figure 10-10: Scenario 1 Node Delay and Link Stress in Watford - PM Peak .................................................... 78
Figure 10-11: Scenario 1 Node Delay and Link Stress in Potters Bar - AM Peak................................................ 78
Figure 10-12: Scenario 1 Node Delay and Link Stress in Potters Bar - PM Peak ............................................... 79
Figure 10-13: Scenario 1 Node Delay and Link Stress in Radlett - AM Peak...................................................... 79
Figure 10-14: Scenario 1 Node Delay and Link Stress in Radlett - PM Peak ..................................................... 80
Figure 10-15: Flow and Delay difference between Scenarios 1 and 2 in Hertsmere - IP Peak ............................ 81

                                                                                                                                      AECOM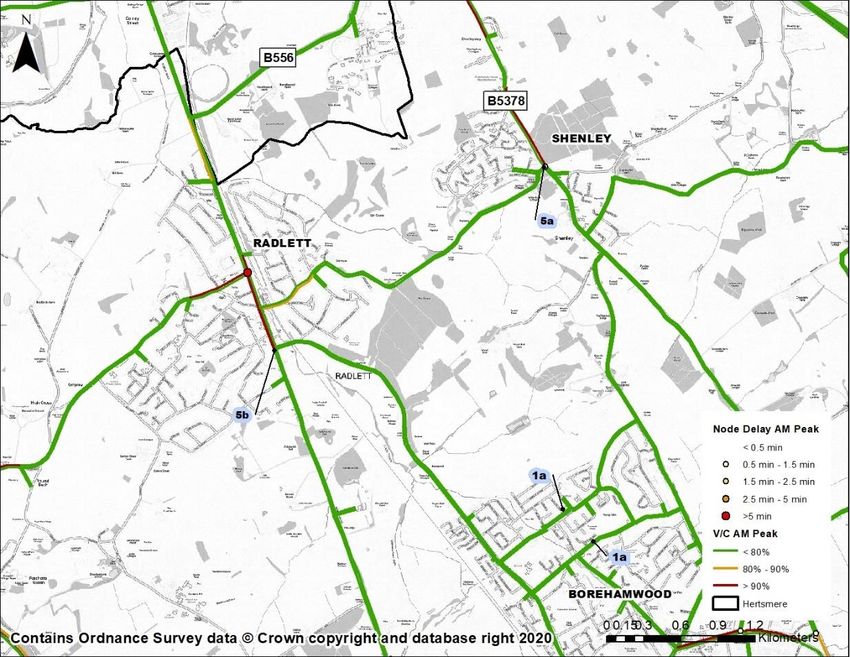
Figure 10-16: Flow and Delay difference between Scenarios 1 and 2 in Borehamwood - AM Peak .................... 82
Figure 10-17: Flow and Delay difference between Scenarios 1 and 2 in Borehamwood – IP period.................... 82
Figure 10-18: Flow and Delay difference between Scenarios 1 and 2 in Borehamwood – PM peak.................... 83
Figure 10-19: Flow and Delay difference between Scenarios 1 and 2 in Watford - AM peak ............................... 83
Figure 10-20: Flow and Delay difference between Scenarios 1 and 2 in Watford – IP period.............................. 84
Figure 10-21: Flow and Delay difference between Scenarios 1 and 2 in Watford - PM peak............................... 84
Figure 10-22: Flow and Delay difference between Scenarios 1 and 2 in Potters Bar - AM Peak ......................... 85
Figure 10-23: Flow and Delay difference between Scenarios 1 and 2 in Potters Bar – IP period ........................ 85
Figure 10-24: Flow and Delay difference between Scenarios 1 and 2 in Potters Bar - PM Peak ......................... 86
Figure 10-25: Flow and Delay difference between Scenarios 1 and 2 in Radlett - AM Peak ............................... 86
Figure 10-26: Flow and Delay difference between Scenarios 1 and 2 in Radlett – IP period............................... 87
Figure 10-27: Flow and Delay difference between Scenarios 1 and 2 in Radlett - PM Peak ............................... 87
Figure 10-28: Flow and Delay difference between Scenario 2 and Base Year in Hertsmere - IP Peak ................ 88
Figure 10-29: Flow and Delay difference between Scenario 2 and Base Year in Borehamwood - AM Peak ........ 89
Figure 10-30: Flow and Delay difference between Scenario 2 and Base Year in Borehamwood – IP period........ 89
Figure 10-31: Flow and Delay difference between Scenario 2 and Base Year in Borehamwood - PM Peak ........ 90
Figure 10-32: Flow and Delay difference between Scenario 2 and Base Year in Watford - AM Peak................... 90
Figure 10-33: Flow and Delay difference between Scenario 2 and Base Year in Watford – IP period .................. 91
Figure 10-34: Flow and Delay difference between Scenario 2 and Base Year in Watford - PM Peak .................. 91
Figure 10-35: Flow and Delay difference between Scenario 2 and Base Year in Potters Bar - AM Peak ............. 92
Figure 10-36: Flow and Delay difference between Scenario 2 and Base Year in Potters Bar – IP period............. 92
Figure 10-37: Flow and Delay difference between Scenario 2 and Base Year in Potters Bar - PM Peak ............. 93
Figure 10-38: Flow and Delay difference between Scenario 2 and Base Year in Radlett - AM Peak.................... 93
Figure 10-39: Flow and Delay difference between Scenario 2 and Base Year in Radlett – IP period ................... 94
Figure 10-40: Flow and Delay difference between Scenario 2 and Base Year in Radlett - PM Peak ................... 94

Tables
Table 2-1: Growth Assumptions in Hertsmere and district of Hertfordshire (2014-2036) ..................................... 15
Table 2-2: Highway and Public Transport Schemes considered for Hertsmere................................................... 15
Table 2-3: Glossary of Technical Terms used in this Report .............................................................................. 18
Table 3-1: COMET v5 Flow and Journey Time Validation Summary .................................................................. 21
Table 4-1: Traffic movement from and to towns in Hertsmere ............................................................................ 39
Table 6-1: List of Routes and Junctions in Hertsmere ....................................................................................... 43
Table 6-2: Summary of Traffic Conditions in Scenario 2 and comparisons with Scenario 1 and 2014 Base Year
scenario ......................................................................................................................................................... 50
Table 8-1. Scheme List.................................................................................................................................... 65
Table 9-1: Public Transport Statistics for Trips in Hertsmere ............................................................................. 68

                                                                                                                                                         AECOM
1. Executive Summary
1.1    Following completion of the COMET v5 2014 Base Year Model enhancement in 2019, HCC
       commissioned AECOM to develop two 2036 forecast scenarios. The first represented a “do
       minimum” scenario and is referred to as Scenario 1; the 2036 Reference Case scenario. This
       included committed (i.e. the most likely) developments and infrastructure across Hertfordshire.
       NTEM (National Trip End Model) data for 2036 was applied in all external areas. The second
       represented a “do something” scenario and is referred to as Scenario 2; the 2036 Local Plan Run
       5 (LPR5) scenario. This includes the Local Plan aspirations (all employment and dwelling growth,
       regardless of certainty) of the 10 Hertfordshire districts, as well as the growth aspirations in
       selected neighbouring areas. Full details of both 2036 scenarios are detailed in separate reports1
       available from HCC2.

1.2    Scenario 2 includes all infrastructure schemes regardless of certainty and the proposed transport
       schemes agreed with Hertfordshire districts in autumn 2019. It aligns with the Infrastructure
       Delivery Plans and Transport Strategies at the time, such as the growth and transport plans and
       the A414 strategy. In addition to highways and public transport schemes, a range of mode shift
       schemes were included in Scenario 2 and attempts to reduce areas of notable delay from
       Scenario 1 were made.

1.3    As part of the Local Plan process, Hertsmere Borough Council (HBC) have identified a number
       of potential new Local Plan allocations. These were fed into COMET as part of Scenario 2. This
       document presents detailed analysis of the impacts of Local Plan development in the district of
       Hertsmere and provides evidence for their ongoing Local Plan process. This document should
       be used to provide extra narrative about the impacts of Hertsmere’s Local Plan developments.

1.4    The caveats should be carefully considered, and the scale of the COMET model and 2036
       scenarios undertaken should provide proportionality to the analysis presented. More detailed
       junction/corridor impacts across Hertsmere should be further assessed using more detailed
       junction or microsimulation modelling. The analysis provided is an overview to inform future works
       and identifies areas where further studies should be focussed to complement the Local Plan
       growth proposed.

1.5    Traffic conditions, routeing summaries and journey times between towns and villages were
       investigated in both Scenarios 1 and 2 and comparisons between scenarios and the base year
       were made. Full analysis is contained in this report and should be read in conjunction with the
       “Hertsmere Journey Time Routes, Detailed Journey Time Graphs” issued by AECOM in
       December 2020.

1.6    This Executive Summary details the Scenario 2 impacts/changes in the key urban areas of
       Hertsmere. Figures for other time periods can be found in Appendix A, while commentary for
       other scenarios and comparisons between scenarios are explained in detail in the main body of
       this report.

1
  “COMET_2036_Reference_Case_Modelling_Assumptions_v1_08-01-2020.pdf” issued to HCC in January 2020 and
COMETv5_LP5_Forecasting Report_2036_FINAL.pdf issued to HCC in May 2020
2
  The COMET Local Plan Run 5 forecasting report and LMVR are available upon request via the email address:
Tpdata@hertfordshire.gov.uk. Further details on COMET and the modelling process in Hertfordshire can be found via the link:
www.hertfordshire.gov.uk/transportmodelling

                                                                                                                 AECOM
                                                                                                                     7
Borehamwood and Elstree

Figure 1-1: Scenario 2 Node Delay and Link Stress in Borehamwood - PM Peak
1.7   The main routes used by traffic travelling to and from Borehamwood are Theobald Street,
      Shenley Road and more strategic routes such as the A1 and M25. Traffic also links with
      surrounding local towns in Hertsmere such as Radlett and Elstree and towns such as Hatfield
      further north in Hertfordshire. Traffic is also observed using north/south routes on local roads to
      travel between Borehamwood and St Albans.

1.8   Flows travelling to and from Elstree use Roman Road, Barnet Lane, High Street and A41, linking
      Elstree with Dacorum, Buckinghamshire and Edgware. There is also some interaction with
      Radlett, Borehamwood and Watford via the A41.

1.9   Theobald Street to B5378 via Aycliffe Road and Gateshead Road operates at capacity in both
      the AM and PM peaks. In both time periods junction delays are minimal.

1.10 Furzehill Road northbound presents moderate congestion in the AM peak and high congestion
     in the PM peak near the junction with Barnet Lane. No critical delays are identified at the junction
     in any time period.

1.11 Long junction delays are suggested in both the AM and the PM peaks at Stirling Corner. These
     build on the delays which already exist in the Base Year model at this junction. Stirling Corner is
     a known bottleneck and Scenario 2 indicates that it will experience significant delays in the future
     carrying local and strategic traffic.

1.12 Moderate to high congestion is suggested southbound on Elstree Hill North southbound and on
     the A41 Northbound exit in both the AM and PM peaks. Long junction delays are indicated at the
     Elstree crossroads, building on the delays which exist in the Base Year scenario. This is also a
     known bottleneck in the area due to the lack of alternative routes. The COMET modelling
     suggests that further studies should quantify the impacts at the Elstree crossroads and Stirling
     Corner as these will be critical in determining how traffic routes to/from Watford and North London
     and the A1/M1 in the future.

                                                                                              AECOM
                                                                                                  8
1.13 Comparing journey times between scenarios, journeys to/from Borehamwood do increase in
Scenario 2 compared to the Base Year although there are marginal changes compared to
Scenario 1. The exception to this is journeys to/from Watford as areas of delay and congestion
are experienced in Bushey and around Watford town centre. Journeys to and from Elstree are
impacted by delays at the Elstree crossroads in Scenario 2. Some of the longer strategic journeys
are impacted by congestion on the surrounding A1 and M25 in Scenario 2.
Bushey
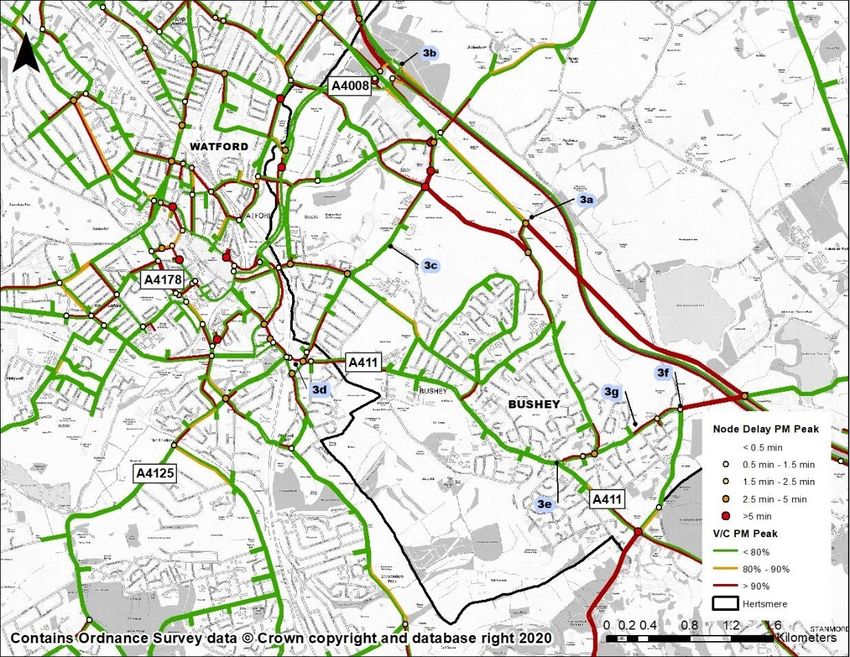
Figure 1-2: Scenario 2 Node Delay and Link Stress in Watford - PM Peak
1.14 Traffic routeing to and from Bushey utilises the A411 and Falconer Road, and the M1 to access
areas in Hertfordshire and north London, especially in the PM peak. Traffic volumes to/from
Bushey are lower when compared to other towns in Hertsmere and there are linkages to adjacent
Watford and Elstree.
1.15 High congestion and junction delays are modelled on Sandy Lane throughout the day in Scenario
2, with congestion on Little Bushey Lane expanding in both directions. Traffic moving in the
north/south direction on Little Bushey Lane creates congestion problems at the crossing with
Sandy Lane which operates near capacity.
1.16 High congestion is modelled on the B462, especially eastbound, throughout the day. Minor
junction delay is observed in both the AM and PM peaks. High congestion is suggested on
Aldenham Road near the Little Bushey Lane/ Aldenham Road junction throughout the day, with
high junction delays observed in the PM peak. The road is operating below capacity near the
Bushey Hall Rd/The Avenue/ Aldenham Road junction in both the AM and PM peaks.
1.17 Whilst local movements around Bushey are not significantly impacted by congestion or delays in
Scenario 2, it can be recognised that the surrounding strategic routes (A41, M1) experience high
levels of congestion and there are delays at junctions leading to/from these routes. Similarly,
there are delays and congestion on routes to/from central Watford. This would suggest that
Bushey residents and travellers to and from Bushey will experience congestion and delays in the
future.
AECOM
9
1.18 Liaison with Highways England would also confirm the predicted pressures on the M1 and
     especially junction 5 with the A41. These important links between Bushey, Watford, wider
     Hertsmere and north London should be carefully considered in future studies.

1.19 There are journey time increases for trips to and from Bushey in Scenario 2 compared to the
     Base Year, however increases are greatest in the PM peak. Some of the largest increases are
     also experienced for relatively local journeys to and from Watford and changes relative to
     Scenario 1 would indicate the network is very sensitive in this area and may be approaching
     capacity.

Potters Bar

Figure 1-3: Scenario 2 Node Delay and Link Stress in Potters Bar - AM Peak
1.20 Traffic travelling to and from Potters Bar utilises Baker Street, Mutton Lane and the M25 to access
     other districts within Hertfordshire and London Boroughs south of Hertsmere. Traffic routeing to
     and from Potters Bar utilises M25 junctions 24 and 22a.

1.21 In Scenario 2, the B556 between Baker Street and High Street A1000 operates well below
     capacity, with very small delays observed at its junctions. The route from the M25 Junction 24 to
     B556 Mutton Lane junction with High St A1000 is operating below capacity with small delays at
     junctions.

1.22 Moderate congestion is observed for the southbound traffic and high congestion is observed for
     the northbound traffic on Warrengate Lane. Congestion around these junctions in Scenario 2
     could possibly be linked to the Bowmans Cross development near M25 junction 22. Traffic from
     the development may also route to and from Potters Bar Station which should be considered in
     further assessments. Capacity issues and delays are observed on local roads around M25
     junction 23.

1.23 The Walk operates below capacity in Scenario 2, however high congestion is suggested near the
     Walk/A1000 junction. Small delays are observed at the Darkes Lane/The Walk junction. Darkes
     Lane operates below capacity, but high congestion is observed at the Church Road/A1000
     junction where traffic is subject to small delays.

                                                                                             AECOM
                                                                                                 10
1.24 Similar to Bushey, it can be observed that whilst local roads around Potters Bar generally operate
with limited congestion and some delays, the town is surrounded by the strategic M25 and A1
which experience congestion and delays. Congestion around M25 junction 23 may be generating
rat-running to/from Potters Bar as traffic utilises local roads rather than the motorway.
1.25 Journey time increases between Scenario 2 and the Base Year are suggested between Potters
Bar and towns to the west of it, especially Watford. This is due to the increased levels of
congestion throughout the network in Scenario 2 and the route choices as traffic can utilise the
strategic or local road network. There are marginal journey time increases when comparing
Scenario 1 and Scenario 2.
Radlett and Shenley
Figure 1-4: Scenario 2 Node Delay and Link Stress in Radlett - AM Peak
1.26 Flows routeing from and to Radlett travel via Watling Street, Theobald Street, Watford Road A414
and the M25 to reach destinations in Hertfordshire, Buckinghamshire and London. The main links
to and from Shenley are the Black Lion Hill / London Road and Mimms Lane/ Radlett Lane that
provide a shortcut to and from the M25.
1.27 Traffic utilises local roads to reach other towns in Hertsmere or the M25 junction 22 to route via
the M25. Traffic also links via local roads to the A414 south of St Albans to join the M1 at junction
8.
1.28 The road network in Shenley generally operates below capacity in Scenario 2, however there is
some congestion on the B5378 travelling to/from London Colney and the M25. The network in
Radlett is also free flowing, however long delays are shown at the Park Road / Watling Street
junction in Scenario 2. These delays will be generating rerouteing on the local road network. This
junction is a known bottleneck in the Base Year model.
1.29 Due to the delays at the Park Road / Watling Street junction in Scenario 2 journey times to/from
Radlett and Shenley and locations to the south are subject to significant increases. Routeing
analysis also indicates traffic from the new development at Bowmans Cross may also contribute
to local road traffic around Radlett and Shenley.
AECOM
11Summary
1.30 The results from Scenarios 1 and 2 have confirmed that Hertsmere’s Local Plan growth does
impact the local network. However, vehicles routeing from Buckinghamshire, London and other
districts within Hertfordshire also add to Hertsmere’s traffic conditions. Whilst delays increase
around the town centres in Hertsmere in Scenario 2, these are also seen in Scenario 1 such as
the Elstree crossroads and Park Road junction in Radlett as shown by the plots in Appendix B.
1.31 Graphical journey time analysis has indicated that delays and congestion across Hertsmere
follow similar patterns between the Base Year and Scenario 1 and 2. This suggests that few new
issues are generated by the Local Plan growth proposed; the growth exerts additional pressure
on existing congestion hotspots.
1.32 The town distribution plots have also indicated that there are limited interactions between
Hertsmere towns and a lot of journeys interact more with the strategic highway network to travel
to and from locations in other areas of Hertfordshire/North London or Buckinghamshire. This is
to be expected as Hertsmere is not a large employment area and it is expected most trips would
leave the area for work and then return in the evening. Therefore, the impacts of growth on the
local road network are not as great as in other areas where significant housing growth is planned
alongside significant employment growth.
1.33 The interaction of local and strategic traffic on the surrounding M25, A1, M1 and A41 should be
carefully considered in future stages of the Local Plan. Congestion and delays on these roads
will impact traffic movements on Hertsmere’s road network as users may try to use local roads
instead or experience delays travelling to/from junctions with the strategic network bordering
Hertsmere.
1.34 It is also observed that the location of the Bowmans Cross (Tyttenhanger) development, the
largest in Hertsmere, helps mitigate it’s overall impacts. As a lot of traffic uses the adjacent M25
Junction 22 for movements between the development and Potters Bar, Radlett and St Albans,
while using the M25 Junction 23 for an easy access on to the A1, these movements mitigate the
impact on the local road network. Congestion on adjacent local roads, such as the A1081, and
flow increase on Coursers Road and B556 towards Potters Bar, indicate the need for more
detailed modelling which would reveal the development’s impact to the local network in greater
detail.
AECOM
122. Introduction
Background and Model Versions
2.1 The development of the COMET model suite was commissioned by Hertfordshire County Council
(HCC) in February 2015 to provide a structured evidence base for assessing transport policies
and strategies on a consistent basis across the county. COMET is a multi-modal model with
variable demand modelling capability.
2.2 The COMET Base Year (2014) model has been regularly updated since 2015 and different
versions of the COMET model have informed 4 previous local plan forecast scenarios. The latest
COMET model (COMET v5) includes significant enhancements and an updated zoning system
and transport networks compared to previous versions. The validation3 of COMET v5
incorporated significantly more traffic data, screenlines4, cordons5 and journey time6 routes. Full
v5 Base Year Model performance is detailed in the updated Local Model Validation Report
(LMVR)7.
2.3 Following completion of the COMET v5 2014 Base Year Model enhancement in 2019, HCC
commissioned AECOM to develop two 2036 forecast scenarios. The first represented a “do
minimum” scenario and is referred to as Scenario 1, the 2036 Reference Case scenario. The
second represented a “do something” scenario and is referred to as Scenario 2, the 2036 Local
Plan Run 5 (LPR5) scenario. Full details of both 2036 scenarios are detailed in separate reports8
available from HCC9. This report refers to the Base Year scenario and Scenarios 1 and 2.
2.4 Scenario 1 only included committed (i.e. the most likely) developments and infrastructure across
Hertfordshire. NTEM (National Trip End Model) data for 2036 was applied in all external areas.
2.5 Scenario 2 includes the Local Plan aspirations (all employment and dwelling growth, regardless
of certainty) of the 10 Hertfordshire districts, as well as the growth aspirations in the following
neighbouring areas: Central Bedfordshire, Luton, Buckinghamshire (all districts), part of Essex
(i.e. Epping Forest, Harlow, and Uttlesford), part of Cambridgeshire (i.e. South Cambridgeshire
and Cambridge) and three boroughs of Outer London (Barnet, Enfield and Hillingdon).
2.6 Scenario 2 includes all infrastructure schemes regardless of certainty and the proposed transport
schemes agreed with Hertfordshire districts in autumn 2019. It aligns with the Infrastructure
Delivery Plans and Transport Strategies at the time, such as the growth and transport plans and
the A414 strategy. In addition to highways and public transport schemes, a range of mode shift
schemes were included in Scenario 2 and attempts to reduce areas of notable delay from
Scenario 1 were made.
2.7 As part of the Local Plan process, Hertsmere Borough Council (HBC) have identified a number
of potential new Local Plan allocations. These were fed into COMET as part of Scenario 2. HBC
require more detailed analysis of the impacts of Local Plan development in their district in order
to provide evidence for their ongoing Local Plan process. Hertsmere have confirmed that
comparing Scenarios 1 and 2 will provide the analysis they require to support their Local Plan
submission.
3
Validation is the process of comparing modelled traffic flow/journey time data to observed traffic count/journey time data
4
A screenline is a line crossing several roads in a model to which modelled traffic volumes are compared to observed traffic
count data. Screenlines are used to calibrate a transport model by ensuring flows reflect traffic counts as accurately as
possible.
5
A cordon is an area of a model into which vehicle movements are recorded in order to track performance against obs erved
traffic count data. In COMET cordons were constructed around the major urban settlements so movements into/out of urban
areas could be reflected in the modelling as accurately as possible.
6
Journey time routes in COMET are compared to observed data as part of model validation
7
“COMET_LMVR_v5.2. pdf” issued by AECOM in March 2020
8
“COMET_2036_Reference_Case_Modelling_Assumptions_v1_08-01-2020.pdf” issued to HCC in January 2020 and
COMETv5_LP5_Forecasting Report_2036_FINAL.pdf issued to HCC in May 2020
9
The COMET Local Plan Run 5 forecasting report and LMVR are available upon request via the email address:
Tpdata@hertfordshire.gov.uk. Further details on COMET and the modelling process in Hertfordshire can be found via the link:
www.hertfordshire.gov.uk/transportmodelling
AECOM
132.8 Table 2-1 presents the number of dwellings and jobs in the Base Year scenario (2014), as well
as the growth assumptions considered in Scenarios 1 and 2 in Hertsmere. For reference, the
total number of dwellings and jobs and the growth assumed in the county of Hertfordshire are
also presented for the Base Year scenario and Scenarios 1 and 2. The percentage growth in
dwellings and jobs between 2014 and 2036 is provided for Hertsmere and Hertfordshire for the
two applications.
2.9 Comparing growth assumptions between Scenarios 1 and 2, a higher growth for both dwellings
and jobs is assumed in Scenario 2, while job growth in Scenario 1 was negative compared to the
Base Year.
2.10 Table 2-2 includes the highway and public transport schemes that were considered in the
modelling of Scenarios 1 and 2. Five highway schemes and no public transport schemes were
considered in Scenario 1, while 13 highway schemes and 1 public transport scheme were
considered in Scenario 2. Comparing this to infrastructure improvements considered across
Hertfordshire, highway infrastructure assumptions in Hertsmere account for only 6% of the total
number of schemes, whereas public transport infrastructure assumptions are less than 3% of the
total planned for the county.
2.11 Growth and infrastructure differences between Scenarios 1 and 2 are reflected in the Hertsmere
traffic conditions. These are presented and discussed in the following sections. Full details of all
2036 planning and infrastructure assumptions informing the two scenarios can be obtained from
the forecasting reports available from HCC10.
2.12 Hertfordshire’s Local Transport Plan (2018) proposes an east west Mass Rapid Transit (MRT)
scheme between Hemel Hempstead and Welwyn Garden City, with a potential link to Potters Bar
via Bowmans Cross. In relation to that, Hertsmere Borough Council (HBC) are of the view that
the proposed Local Plan and associated site allocations can be delivered independently of any
transit scheme and options for the routing for that.
10
The COMET Local Plan Run 5 forecasting report and LMVR are available upon request via the email address:
Tpdata@hertfordshire.gov.uk. Further details on COMET and the modelling process in Hertfordshire can be found via the link:
www.hertfordshire.gov.uk/transportmodelling
AECOM
14Table 2-1: Growth Assumptions in Hertsmere and district of Hertfordshire (2014-2036)
Growth in Scenario 1 Growth in Scenario 2
Area / Base Year 2014 Scenario 1 Scenario 2
(2014-2036) (2014-2036)
Comparison
Dwellings Jobs Dwellings Jobs Dwellings Jobs Dwellings Jobs Dwellings Jobs
Hertsmere 41,222 50,065 3,519 -5,140 17,633 1,185 9% -10% 43% 2%
Hertfordshire 469,222 570,277 42,138 -10,983 151,449 61,648 9% -2% 32% 11%
Hertsmere growth
within 9% 9% 8% 47% 12% 2% - - - -
Hertfordshire
Table 2-2: Highway and Public Transport Schemes considered for Hertsmere
Implementation
ID Location Road/Junction Description Scheme Type Scenario 1 Scenario 2
Year
Extend current service 298 to Cranbourn Road via
Hmere_ Cranborne Road Public
Potters Bar Mutton Lane with one-hour frequency (previously 2021 No Yes
1 Industrial Estate Transport
modelled as 20 min frequency)
Hmere_
Potters Bar Baker Street New on street cycle lanes within existing road width 2031 Highway No Yes
2
Hmere_ B556 / Baker Street /
Potters Bar Rephase signals 2036 Highway No Yes
3 Darkes Lane junction
Junction improvements at Darkes Lane/The Walk
Hmere_ Darkes Lane / The Walk to improve conditions for pedestrians and cyclists
Potters Bar 2031 Highway No Yes
4 junction by station as well as broader urban realm enhancements
along the high street.
M25
Hmere_
Junction 18- M25 Junctions 18-25 Smart motorway with hard shoulder running 2016 Highway Yes Yes
5
25
Hmere_ M25
M25 Junction 23 Capacity Improvements 2020 Highway No Yes
6 Junction 23
AECOM
15Implementation
ID Location Road/Junction Description Scheme Type Scenario 1 Scenario 2
Year
A1081 / Trotters Bottom
Hmere_
Dancers Hill / Dancers Hill Convert to signalised junction and optimise timings 2036 Highway No Yes
7
roundabout
A1 / A411 Barnet Lane
Hmere_ Borehamwo
(Stirling Corner) - Changes to signal staging and timing 2017 Highway Yes Yes
8 od
Borehamwood
Borehamwood – Station
Hmere_ Borehamwo Upgrade of junction to continental roundabout
Road/Theobald 2031 Highway Yes Yes
9 od (DWG files available on AGOL)
St/Allum Lane junction
Hmere_ Borehamwo Junction improvement with replacement of the
Elstree Way Corridor 2031 Highway Yes Yes
10 od Tesco roundabout with signals
Hmere_ Park Road / Watling
Radlett Convert to signalised junction & optimise timings 2036 Highway No Yes
11 Street
B556/ B5378
Hmere_ roundabout north of Convert to signalised junction & optimise timings
Shenley 2036 Highway No Yes
12 Shenley, south of M25 with potential widening of approaches
Junction 22
Bushey Hall Road,
Hmere_
Bushey Bushey Grove Road, Traffic calming & pedestrian enhancements 2021 Highway Yes Yes
13
Greatham Road
Hmere_ A4008 /Radlett Road
Watford Convert to signalised junction & optimise timings 2036 Highway No Yes
14 roundabout
Hertsmere Total Number of Schemes 5 14
Hertfordshire Total Number of Schemes 87 242
Hertsmere infrastructure assumptions within Hertfordshire 6% 6%
AECOM
16Caveats
2.13 The models in Scenarios 1 and 2 are based on the latest version of COMET (version 5). The
COMET version 5 update included increased zoning and network detail alongside an increase in
data used to calibrate the model. As a result, there are more screenlines, cordons and journey
time routes compared to previous versions of COMET. A high-level review to understand the
COMET version 5 base year model performance in the local area of Hertsmere is included in
Section 3 of this report, which should be considered when interpreting the results from the
COMET model.
2.14 COMET is a strategic modelling tool covering the whole of Hertfordshire. Whilst the COMET
version 5 model contains increased zonal and network coverage compared to previous model
versions, COMET is not designed to undertake detailed local or junction analysis. The
applications COMET is suitable for assessing are detailed in the Model Specification Report
(MSR)11. All results detailed in this report should be interpreted with the strategic nature of the
model in mind. This report should be viewed as a guide to where future transport issues across
Hertsmere should be investigated using more localised traffic/junction modelling packages.
2.15 Although all inputs to the scenarios presented in this report were provided by both HCC and HBC,
it should be noted that planning data and infrastructure assumptions are firstly confirmed between
HCC and each district before being issued to AECOM. Therefore, HCC assumes all responsibility
for modelling inputs.
2.16 HBC have requested detailed journey time graphical analysis. AECOM recommends this analysis
is treated as purely indicative and results at individual junctions are not treated as representative.
All results provided to HBC through this report are heavily caveated and should be interpreted
with the strategic nature of the model in mind.
2.17 Growth assumptions in Barnet and Enfield, two London boroughs adjacent to Hertsmere, were
included in Scenario 2 and could impact the Hertsmere traffic network, especially compared to
Scenario 1. Traffic conditions in and around Hertsmere in this report should be interpreted
considering growth in adjacent HCC/other areas.
2.18 Traffic conditions for each scenario are presented in figures in the form of flow difference and
junction delays. It should be noted that flows are expressed in passenger car units (PCUs), while
junction delays are expressed in minutes. PCUs are a standard modelling output which converts
flows into a uniform vehicle format (amalgamating cars, LGVs and HGVs).
2.19 Journey time differences presented in this report are a result of re-routeing between scenarios,
developments and infrastructure schemes in the local area.
2.20 Tyttenhanger Estate at Coursers Rd, also known as Bowmans Cross, would be for up to 6,000
dwellings, employment space and associated facilities. As the scenarios studied in this report
consider growth up to 2036, Scenario 2 includes only 2,000 dwellings for the Bowmans Cross
development which is the anticipated number of units to be completed for that scheme up to 2036
which is the proposed period which the Local Plan will cover. It was not included in Scenario 1.
2.21 COMET utilises generic NTEM trip rates for forecasting applications, which are usually lower than
the trip rates proposed by developers and may underestimate traffic conditions. This should be
considered when reviewing the analysis of trips to and from the largest developments and
especially the Bowmans Cross development in Section 5.
2.22 Results are presented for the AM peak (08:00 – 09:00) and PM peak (17:00 – 18:00) periods.
The COMET model also includes an interpeak period (average hour between 10:00 – 16:00)
however traffic volumes are lower than in the peaks so impacts are not as critical and not
reported.
2.23 It should also be considered that the COMET public transport assumes unlimited capacity on
public transport which would not exist in reality. Similarly, COMET assumes that incomes will rise
faster than public transport fares when forecasting. This can result in a switch to rail travel as the
11
“COMET_MSR_v3.pdf” issued via email to HCC 28th November 2019
AECOM
17cost of making a rail journey is deemed more affordable in the future. This is usually at the
expense of bus patronage.
Glossary
2.24 Table 2-3 details the glossary of technical terms used in this report.
Table 2-3: Glossary of Technical Terms used in this Report
Term Description
HBC Hertsmere Borough Council
HCC Hertfordshire County Council
COMET The Countywide Model of Transport – Hertfordshire’s strategic transport model
consisting of highway, public transport and variable demand models
DfT Department for Transport
DfT TAG DfT Transport Analysis Guidance12 - the guidance on transport modelling all COMET
modelling follows
MSR Model Specification Report – a report outlining the parameters of the COMET model
(available from HCC)
LMVR Local Model Validation Report – a report outlining the construction and performance
of the COMET transport model compared to observed data (available from HCC)
Model Also indicated as “C” or “Cal”, is the process of calibrating the transport model using
Calibration observed traffic count data. Traffic counts are compared to the modelled flows to
define whether the model is representative of traffic conditions. The calibration
process allows for the model to make some minor changes to the demand to more
accurately match observed data.
Model Also indicated as “V” and “Val”, involves comparing modelled data to observed data.
Validation The model is not able to manipulate data to better match observed data and provides
a level of verification of model performance.
Journey Defined journey times are recorded using observed data (Google or TrafficMaster)
Times and compared to journey times in the base year model. This is a key measure of
model validation.
NTEM National Trip End Model – the model forecasts the growth in trip origin-destinations
(or productions-attractions) up to 2051 for use in transport modelling
PCU Passenger Car Unit, a standard modelling output which converts flows into a uniform
vehicle format (amalgamating cars/LGVs and HGVs)
Cordon A cordon is an area of a model into which vehicle movements are recorded in order
to track performance against observed traffic count data. In COMET cordons were
constructed around the major urban settlements so movements into/out of urban
areas could be reflected in the modelling as accurately as possible.
Screenline A screenline is a line crossing several roads in a model to which modelled traffic
volumes are compared to observed traffic count data. Screenlines are used to
calibrate a transport model by ensuring flows reflect traffic counts as accurately as
possible.
Base Year The COMET v5 2014 Base Year model
Scenario
Scenario 1 “Do minimum” scenario, referring to the 2036 Reference Case scenario
Scenario 2 “Do something” scenario, referring to the 2036 Local Plan Run 5 scenario
12
Full details available at https://www.gov.uk/guidance/transport-analysis-guidance-tag
AECOM
18Term Description
AM Peak Represented in the COMET model as 08:00 – 09:00
IP Represented in the COMET model as an average hour between 10:00 – 16:00
(interpeak)
PM Peak Represented in the COMET model as 17:00 – 18:00
LPR5 Local Plan Run 5 (Scenario 2)
Node delay Junctions in COMET are represented by nodes. Node delay should be interpreted as
junction delay. Node delay is the average delay a vehicle will experience at a
junction, regardless of the direction of the approach or movement made. It is
averaged across all movements at junctions and weighted by the flows
Link Stress Congestion on roads is represented in COMET by link stress. Roads operating at link
stress below 80% are expected to be relatively free-flowing with minimal delays at
junctions. Roads operating between 80% and 90% will begin to show signs of
congestion, vehicle speed will reduce, and delays will occur at junctions. At link
stress over 90%, roads will be very congested with low average speeds and delays
expected at junctions
Zone An area in the COMET model which trips travel to/from.
SRN Strategic Road Network – the Highways England arterial network surrounding
Hertsmere – i.e. A1, M1 and M25
Select Link SLA is a tool in COMET used to identify how traffic routes through/to/from areas
Analysis
(SLA)
Purpose of This Report
2.25 This document presents detailed analysis of the impacts of Local Plan development in the district
of Hertsmere and provides evidence for their ongoing Local Plan process. This document should
be used to provide extra narrative about the impacts of Hertsmere’s Local Plan developments.
However, the caveats above should be carefully considered, and the scale of the COMET model
and 2036 scenarios undertaken should provide proportionality to the analysis presented. More
detailed junction/corridor impacts across Hertsmere should be further assessed using more
detailed junction or microsimulation modelling. The analysis provided is an overview to inform
future works.
2.26 Following this introduction, the report is organised as follows:
• Section 3 – High-Level Base Model Review
• Section 4 – Settlement Based Distribution Plots
• Section 5 - Bowmans Cross Trip Distribution Analysis
• Section 6 – 2036 Traffic Conditions in Hertsmere
• Section 7 – Journey Time Analysis
• Section 8 – Scheme Assessment
• Section 9 – Public Transport Patronage
• Section 10 – Conclusion, Summary & Discussion
AECOM
193. High-Level Base Model Review
3.1 This section outlines the performance of the COMET v5 Base Year, which forms the basis for
LPR5 modelling. A fundamental difference between COMET v5 and previous versions of the
model is the increased spatial resolution of the model in certain areas. This provides a higher
level of detail across the transport network within Hertfordshire and its neighbouring areas. A
significant extra amount of traffic data was collected to inform the COMET v5 2014 base year
enhancement.
3.2 COMET v5 contains a total of 64 two-way screenlines13 and 21 two-way cordons14, as shown
below. This is a significant enhancement compared to previous versions of the model, however
the model does not include validation15 screenlines in the Hertsmere area, as seen in the
highlighted area in Figure 3-1. In total 2 screenlines and 2 cordons around Potters Bar and Elstree
informed model performance in Hertsmere in COMET v5. The screenlines and cordons were
designed to capture both inter-urban and intra-urban movements across Hertfordshire, as well
as traffic to / from the main towns and cities. Performance against observed data was good,
however it was noted COMET under-estimated flows into and out of the Potters Bar and
Borehamwood cordons. These differences are not deemed significant enough to invalidate any
of the results reported.
Hertsmere
District Area
Figure 3-1: COMET v5 Cordons and Screenlines (Hertsmere area highlighted
3.3 As detailed in the COMET v5 LMVR16 performance of the screenlines in Hertsmere (highlighted
in Figure 3-2) compared to observed data was overall positive with only the AM peaks failing to
13
A screenline is a line crossing several roads in a model to which modelled traffic volumes are compared to observed traffic
count data. Screenlines are used to calibrate a transport model by ensuring flows reflect traffic counts as accurately as possible
14
A cordon is an area of a model into which vehicle movements are recorded in order to track performance against observed
traffic count data. In COMET cordons were constructed around the major urban settlements so movements into/out of urban
areas could be reflected in the modelling as accurately as possible
15
Validation involves comparing modelled data to observed data. The model is not able to manipulate data to better match
observed data and provides a level of verification of model performance
16
“COMET_LMVR_v5.2. pdf” issued by AECOM in March 2020
AECOM
20You can also read