Heterogeneous dynamics in the curing process of epoxy resins - Nature
←
→
Page content transcription
If your browser does not render page correctly, please read the page content below
www.nature.com/scientificreports
OPEN Heterogeneous dynamics
in the curing process of epoxy
resins
Taiki Hoshino1*, Yasushi Okamoto2, Atsushi Yamamoto2 & Hiroyasu Masunaga3
Epoxy resin is indispensable for modern industry because of its excellent mechanical properties,
chemical resistance, and excellent moldability. To date, various methods have been used to
investigate the physical properties of the cured product and the kinetics of the curing process, but its
microscopic dynamics have been insufficiently studied. In this study, the microscopic dynamics in the
curing process of a catalytic epoxy resin were investigated under different temperature conditions
utilizing X-ray photon correlation spectroscopy. Our results revealed that the temperature conditions
greatly affected the dynamical heterogeneity and cross-linking density of the cured materials.
An overview of the microscopic mechanism of the curing process was clearly presented through
comparison with the measurement results of other methods, such as 1H-pulse nuclear magnetic
resonance spectroscopy. The quantification of such heterogeneous dynamics is particularly useful for
optimizing the curing conditions of various materials to improve their physical properties.
Intermittent dynamics appears in soft solids such as polymer gels, colloidal gels, and glass formers at the
microscale1–7. Understanding intermittent dynamics has become increasingly important for the elucidation of
nonequilibrium phenomena, such as aging and stress relaxation8,9. Such intermittent dynamics indicate the coex-
istence of fast and slow dynamics regions, which can be caused by density fluctuation of the cross-linking network
in the thermosetting process of epoxy resins. It can considerably influence the final mechanical properties of
cured materials. Thermoset epoxy resins are indispensable tools for modern industry because of their excellent
mechanical properties, high adhesion to various substrates, and excellent heat and chemical resistances. They
are used in various fields as versatile adhesives, fiber reinforced materials, and high-performance c oatings10–12.
In the production process, efficient energy use in the thermosetting process is becoming increasingly important,
for which optimization of curing conditions is required. Thus, it is necessary to properly understand the kinetics
of the thermosetting process.
The thermal curing reaction is typically initiated by mixing two reactive components together and elevat-
ing the temperature to cause an oligomerization and cross-linking reaction. Since the cross-linking network is
strongly correlated to the main properties of the cured materials, curing kinetics have attracted considerable
interest and have been vigorously investigated using various methods. The reaction mechanism has been stud-
ied through the analysis of reaction kinetics by investigating the isothermal hardening process with differential
scanning calorimetry13–16. The reaction kinetics have also been investigated using near-infrared spectroscopy
and Raman s pectroscopy14,17,18. The kinetics of mechanical properties have been examined using rheological
methods. The divergence of the shear modulus near the gel point and the behavior of the frequency-dependent
shear modulus have greatly contributed to the understanding of the relationship between the reaction mecha-
nism and the macroscopic physical properties19–22. The effect of temperature on the isothermal curing reaction is
fairly complex23–25. Various mathematic kinetic models of chemical processes have been used to study the effect
of curing temperature on the isothermal curing process of epoxy resins, and they reasonably explain that the
reaction is faster, and the final reaction degree is higher because of the higher mobility of the molecules at high
temperatures. This results in a higher glass transition temperature (Tg) of the curing m aterials14,26–29. However,
in the industrial field, it is known that there are different types of epoxy resin, in which the cured product first
cured at a low temperature and post-cured at a high temperature has a higher Tg than does a product that has
been cured at a high temperature from the beginning. The value of Tg is known to have a deep correlation with
the cross-linking density, which also directly correlates with the heterogeneity of the cross-linking s tructure30–33.
1
RIKEN SPring-8 Center, 1‑1‑1, Kouto, Sayo‑cho, Sayo‑gun, Hyogo 679‑5148, Japan. 2DENSO CORPORATION,
1‑1, Showa‑cho, Kariya, Aichi 448‑8661, Japan. 3Japan Synchrotron Radiation Research Institute/SPring-8, 1‑1‑1,
Kouto, Sayo‑cho, Sayo‑gun, Hyogo 679‑5198, Japan. *email: t-hoshino@spring8.or.jp
Scientific Reports | (2021) 11:9767 | https://doi.org/10.1038/s41598-021-89155-x 1
Vol.:(0123456789)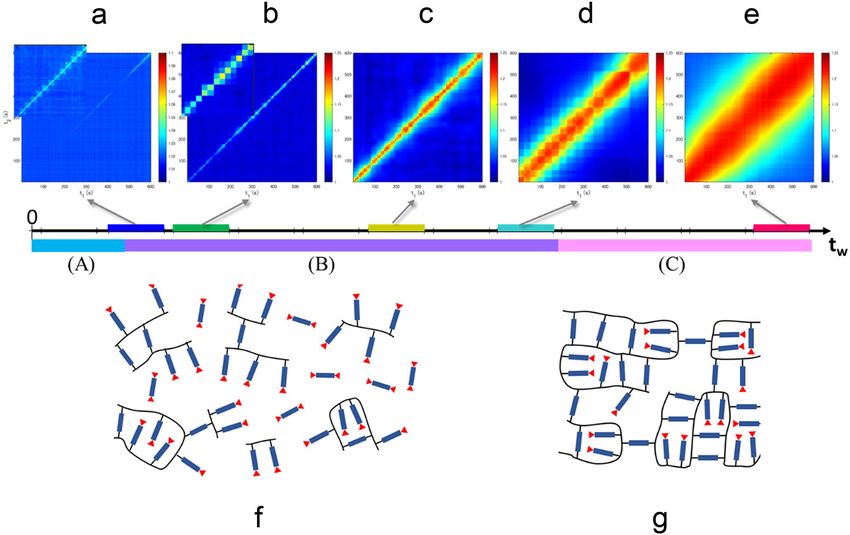
www.nature.com/scientificreports/
Figure 1. Schematic illustration of the X-ray photon correlation spectroscopy (XPCS) measurement in
the curing process. A mixed solution of the main agent (bisphenol A diglycidyl ether, BADGE) and catalyst
(1-(2-cyanoethyl)-2-undecylimidazole, C11Z-CN), in which nanoparticles were evenly distributed, was placed
in a heat bath, and the change in dynamics was measured using XPCS in relation to the elapsed time tw . The
time-resolved measurement of 150,000 frames with an exposure time of 4 ms as well as the movement of the
irradiation position were repeated 12 times to investigate the dynamics of the curing process for approximately
2 h. The illustration was made using Microsoft PowerPoint 2013.
The heterogeneity of cross-linking networks has been sensitively detected in dynamic fluctuations as reported
in polymer network gels using dynamic light scattering m easurements34.
Heterogeneous dynamic fluctuations, including intermittent ones, have a deep correlation with the cross-link-
ing structure. Thus, investigating the microscopic dynamics of the cross-linking process will provide important
insights into the curing mechanism. X-ray photon correlation spectroscopy (XPCS) is a measurement technique
that permits the observation of the dynamics of a sample at the microscale based on the temporal fluctuation of
the scattering intensity of partially coherent X-rays35,36. XPCS is a promising technique for dynamically study-
ing the kinetics of cross-linking systems at the microscale. Czakkel and Madsen investigated the evolution of
dynamics and structure during the formation of a cross-linked polymer gel using XPCS and small angle X-ray
scattering37. They succeeded in associating dynamic slowing and crossover with the evolution of the structure.
Begam et al. studied the kinetics of network formation and dynamics of an egg white gel using XPCS and
ultrasmall-angle X-ray scattering, revealing the growth of network mesh size and heterogeneous dynamics38.
Recently, Koga et al. performed XPCS measurements of the thermosetting process of epoxy resins containing
some fillers, showing that XPCS is a powerful tool for observing the epoxy dynamics from liquid to solid states39.
They successfully observed the evolution of the filler’s velocity during the curing process; however, owing to the
effect of the densely dispersed fillers, only the ballistic motion was observed throughout the curing process, and
they could not discuss the change in the movement, such as the deviation from normal Brownian motion and
the fluctuation of dynamics, in detail.
In this study, to focus on the dynamics of epoxy matrix under the condition that the influence of the fillers
is almost negligible, we used a simple system in which spherical particles were dispersed in the resin at a dilute
concentration as a probe (The effect of silica nanoparticles were discussed in Supplementary Information with
Supplementary Figs. 9 and 10). This made it possible to have a detailed discussion on the deviation from the nor-
mal Brownian motion during the curing process and the fluctuations of dynamics, including intermittent ones.
We researched the microscopic dynamics of a catalytic epoxy resin during the isothermal curing process under
two different temperatures: 100 and 150 °C. The dynamics of the curing process from liquid to solid state were
investigated in detail, as schematically shown in Fig. 1. The prior rheological measurements indicated that both
the curing process at 100 and 150 °C reached the gel point within 1 h, and solidification was almost complete (see
Supplementary Fig. 1). Thus, we focused on the first 2 h of the curing process and investigated its microscopic
dynamics with XPCS. Although it is difficult to observe the change of mechanical properties after solidification
by rheological measurements, the microscopic dynamic fluctuation after the gelation point can be detected with
XPCS. In particular, examining the temporal fluctuation of dynamic behavior enables us to discuss dynamical
heterogeneity, which can be quantitatively evaluated by analyzing the fluctuation of the speckle images obtained
from XPCS measurements, is one of the most important parameters for characterizing gels and glassy materials,
and it can be the key to understanding the physical properties of epoxy r esins2,40–42. Furthermore, to discuss
the relationship between the dynamic behavior and the cross-linking properties, 1H-pulse nuclear magnetic
resonance (NMR) spectroscopy measurements were performed. 1H-pulse NMR is one of the most promising
techniques for elucidating the cross-link inhomogeneity of polymer networks43–47. In 1H-pulse NMR, the mobility
Scientific Reports | (2021) 11:9767 | https://doi.org/10.1038/s41598-021-89155-x 2
Vol:.(1234567890)
www.nature.com/scientificreports/
of molecules is evaluated from the spin–spin relaxation time of protons. Thus, the spin–spin relaxation of tightly
cross-linked segments with lower molecular mobility decays faster than that of loosely cross-linked segments.
Results
Kinetics of microscopic dynamics in curing process. Before providing the details of the dynamic data
in the curing process studied with XPCS, we briefly introduce the important aspects of the experiment. As shown
in Fig. 1, a mixed solution of the main agent and catalyst, in which probe nanoparticles (120-nm diameter) were
homogeneously distributed, was placed in a heat bath, and the change in dynamics was measured using XPCS
with respect to the elapsed time tw . The time-resolved measurement of 150,000 frames with an exposure time of
4 ms as well as the movement of the irradiation position were repeated 12 times to investigate the dynamics of
the
curing process for approximately 2 h. In the XPCS measurements, the fluctuation of the scattering intensity
I q, t at a scattering vector q was obtained over a time series t, and the intensity time autocorrelation function
was calculated as
g2 q, t =< I q, t ′ I q, t ′ + t > / < I q, t ′ >2 , (1)
where q = q and the angle brackets indicate time averaging.
Figure 2a,b depict the normalized correlation functions g2 q, t − baseline /β , where β is the speckle con-
trast at various elapsed times tw at q = 0.0325 nm , as representative correlation functions obtained by the XPCS
−1
measurements at 100 and 150 °C, respectively. The number of frames used for the calculation of g2 was adjusted
according to the relaxation time at each tw. For example, in the initial state, g2 was calculated every 1000 frames
owing to its short relaxation time; in the latter state, g2 was calculated at every 150,000 frames because its long
relaxation time. g2 q, t was analyzed by fitting with the following equation:
g2 q, t = β exp [−2(Ŵt)α ] + baseline, (2)
where Ŵ and α are the relaxation rate and stretched or compressed exponent, respectively. The q dependences
of Ŵ at 100 and 150 °C are shown in Fig. 2c,d, respectively. All the obtained q dependences of Ŵ are expressed by
the power law of Ŵ = Aqn, where A and n are a constant and an exponent, respectively.
Figure 3 illustrates the time dependence of Ŵ and α at q = 0.0325 nm−1 obtained from the fitting analysis with
Eq. (2) as well as n in the 100 and 150 °C curing processes. First, the time dependence of the parameters in the
100 °C curing process is presented. In the initial state, in the time region tw < 2800 s (region (I) in Fig. 3a–c), α
and n have almost constant values, α = 1 and n ≈ 2. These values indicate that the particles move in a Brownian
manner in a simple liquid. In this region, Ŵ decreases monotonically, which means an increase in viscosity. In
the time region 2800 s < tw < 3400 s [region (II)], all the three parameters change drastically. Ŵ decreases more
rapidly than in the previous time region, α increases from 1 to 2, and n decreases from 2 to approximately 0.8.
These behaviors indicate that the particle motion rapidly deviates from the simple Brownian motion in a simple
liquid. Thus, the resin is no longer a simple liquid in this region. In the time region tw > 3400 s [region (III)],
the change in all the parameters is gradual. Ŵ decreases gradually, and α and n are almost constant, α ≈ 2 and
n ≈ 0.8 − 1.0. These behaviors imply that the dynamics no longer change significantly since the main chemical
reactions have settled down. From these results, we can clearly divide the dynamics of the 100 °C curing pro-
cess into the three time regions, (I) tw < 2800 s, (II) 2800 s < tw < 3400, and (III) tw > 3400 s, from the time
dependence of Ŵ, α, and n.
Subsequently, the time dependence of the parameters in the 150 °C curing process is presented in Fig. 3d–f.
Although α ≈ 1 and n ≈ 2 in the initial state of tw < 1025 s [region (A) in Fig. 3d–f] and α ≈ 2 and n ≈ 0.8 − 1 in
the final state of tw > 5607 s [region (C)] are similar to those of the 100 °C curing process, their behavior differs
significantly. First, the time dependence of Ŵ does not show a clear boundary in contrast to that in the 100 °C cur-
ing process. Particularly, throughout the 150 °C curing process, Ŵ decreases smoothly except for a discontinuous
jump around tw ≈ 1240 s. Second, the behavior of α and n is more scattered than in the 100 °C curing process.
During the discontinuous jump of Ŵ at tw ≈ 1240 s and its quick return to the original line (1240 s < tw < 1420 s),
α fluctuates between 0.5 and 1.6 (blue marks in Fig. 3d,e). These fluctuations of Ŵ and α indicate the coexistence
of the fast and slow as well as simple Brownian and non-simple Brownian dynamics. A similar trend, in which
α deviates significantly from 1, has been reported in dynamic light scattering measurements for probe diffusion
in a gelation process48. In addition, the behavior of α in the region 1520 s < tw < 2080 s can also be explained
by the coexistence of multiple dynamics (green marks in Fig. 3e). In this time range, α is smaller than 1, which
means that g2 behaves as a stretched exponential function, as shown in g2 at 1804s in Fig. 2b, and such a stretched
exponential can be expressed by the sum of the multiple relaxations. Furthermore, α increases monotonically
from 0.24 to approximately 1. It can be assumed that the multiple dynamic modes converge to a single mode. In
the region 2080 s < tw < 4000 s, α is almost constant. However, the dynamics do not reach a stable state because
n is fairly scattered in this region and α increases thereafter. This time region (2080 s < tw < 4000 s) and the
following one ( 4000 s < tw < 5607 s ) can be considered the crossover region where α increases from 0.24 to
1.8. From these data, we can conclude that the multiple dynamics coexist in most of the time region tw < 5700 s.
So far, we have discussed the correlation functions g2 using Eq. (1), which reflects the averaged dynamics of
interest over a period of time. Although the analysis using g2 has the advantage that the details of the particle
motion can be compared with the parameters obtained from Eq. (2), it hardly expresses the temporal fluctuation
of the dynamics. Here, we discuss the temporal variation of the correlation function via a two-time correlation
function
Scientific Reports | (2021) 11:9767 | https://doi.org/10.1038/s41598-021-89155-x 3
Vol.:(0123456789)
www.nature.com/scientificreports/
Figure 2. Normalized autocorrelation functions for various elapsed times at q = 0.0325 nm−1 at 100 °C (a) and
150 °C (b). The solid lines in (a) and (b) are the fitting curves from Eq. (2). The q dependence of Ŵ at 100 and
150 °C is shown in (c) and (d), respectively. The solid lines in (c) and (d) are the fitting curves from the power
law Ŵ = Aqn.
Scientific Reports | (2021) 11:9767 | https://doi.org/10.1038/s41598-021-89155-x 4
Vol:.(1234567890)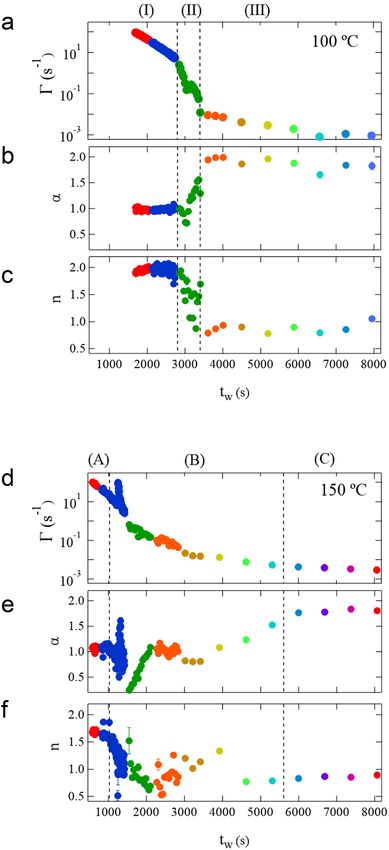
www.nature.com/scientificreports/
Figure 3. Time dependence of Ŵ (a) and α (b) at q = 0.0325 nm−1 obtained from the fitting analysis with Eq. (2),
and n (c) in the 100 °C curing process. Time dependence of Ŵ (d) and α (e) at q = 0.0325 nm−1, and n (f) in the
150 °C curing process. The time region of each process is divided into three parts based on the behavior of the
parameters: (I) tw < 2800 s, (II) 2800 s < tw < 3400 s, and (III) tw > 3400 s in the 100 °C curing process, and
(A) tw < 1025 s, (B) 1025 s < tw < 5607, and (C) tw > 5607 s in the 150 °C curing process.
Ip q, t1 Ip q, t2
(3)
CI q, t1 , t2 =
,
Ip q, t1 Ip q, t2
where �·� denotes the average over pixels within q ± q49,50. From CI , the temporal fluctuation of the relaxation
time can be represented visually. For instance, in the equilibrium liquid, the width of the diagonal band is con-
stant, thereby indicating that the relaxation time is constant; thus, the dynamics are homogeneous (see Supple-
mentary Fig. 2). In this study, the measurement of 4 ms × 150,000 frames was repeated 12 times during the curing
process, thereby 12 CI were obtained from a set of curing processes (see all the obtained CI in Supplementary
Scientific Reports | (2021) 11:9767 | https://doi.org/10.1038/s41598-021-89155-x 5
Vol.:(0123456789)
www.nature.com/scientificreports/
Figure 4. Two-time correlation function CI at q = 0.0325 nm−1 in the 100 °C curing process at tw = 1448–2048s
(a), 2136–2736 s (b), 2825–3425 s (c), 4895–5495 s (d), and 7648–8248 s (e). The insets in (a) and (b) show the
magnified plot at the last 100 s. The time range of the data is shown with color bars on the tw axis; their colors
correspond to the colors of marks in Fig. 3a–c. The schematic illustration of the structure of the epoxy resin
in regions (I), (II), and (III) is shown in (f), (g), and (h), respectively. The rod part represents the main chains
of BADGE, and the red triangle represents the unreacted end group. The two-time correlation functions were
calculated by our programs written in MATLAB 2020b (https://www.mathworks.com). The illustrations were
made using Microsoft PowerPoint 2013.
Fig. 3 except for the data of which the relaxation time is shorter than the detectable time range). Figure 4a–e
demonstrates the representative CI in the 100 °C curing process. In Fig. 4a, CI in the range 2136 s < tw < 2736 s
[time region (I)] indicates the gradual elongation of the relaxation time, namely the gradual slowing down of
the dynamics. In Fig. 4b, for CI in the range 2916 s < tw < 3516 s [time region (II)], the relaxation time becomes
longer with increasing tw , which is similar to that in Fig. 4a, but the changes are not gradual but intermittent,
thereby indicating a discontinuous dynamic change in this time region. In Fig. 4c–e, CI in time region (III)
suggests the disappearance of the intermittent changes and a gradual slowing down. Thus, in the 100 °C curing
process, intermittent fluctuations were observed solely in time region (II), and smooth slowdown was observed
in time regions (I) and (III).
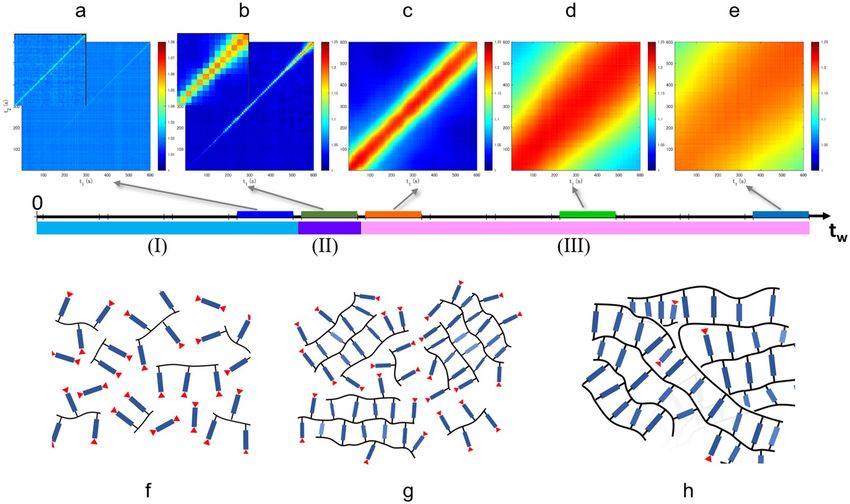
In the 150 °C curing process, the intermittent fluctuations were observed over a wider time range from the
initial state, in tw < 5607 s, compared with the 100 °C curing process, as shown in Fig. 5a–d (see all the obtained
CI in Supplementary Fig. 4 except for the data of which the relaxation time is shorter than the detectable time
range). These intermittent fluctuations indicate the coexistence of fast and slow dynamics, which originates
from the heterogeneity of the matrix due to the simultaneous reaction of the oligomerization, polymerization,
and cross-linking reaction from the initial stage in the 150 °C curing process. In the time region tw > 5607 s
[region (C)], where the curing progressed sufficiently and α and n were stable (seen in Fig. 3e,f), no intermittent
fluctuations were observed, as shown in Fig. 5e.
After approximately 5500 s of these measurements, parameters Ŵ, α, and n are almost constant at both 100 °C
and 150 °C, as shown in Fig. 3. Fluctuations in dynamics are observed in CI , and such temporal fluctuations can
include important information for the curing mechanism. The fluctuation of CI can be discussed quantitatively
by its normalized v ariance2
2
2
CI q, t1 , t t − CI q, t1 , t t
(4)
1 1
χ q, t =
2 .
CI q, t1 , t = 0 t
1
The parameter χ exhibits a peak around the inflection point of g2 q, t , and the height of this peak is pro-
portional to the variance of the characteristic relaxation time. The experimentally measured variance χ q, t is
Scientific Reports | (2021) 11:9767 | https://doi.org/10.1038/s41598-021-89155-x 6
Vol:.(1234567890)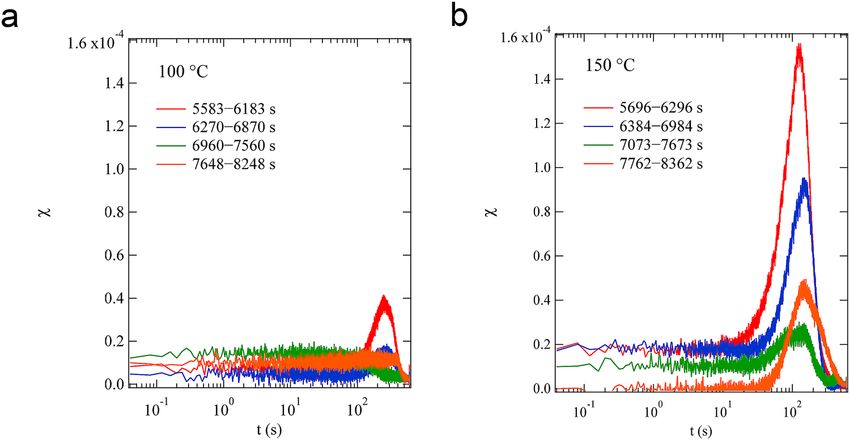
www.nature.com/scientificreports/
Figure 5. Two-time correlation function CI at q = 0.0325 nm-1 in the 150 °C curing process at tw = 825–1425 s
(a), 1524–2124 s (b), 3620–4220 s (c), 5007–5607 s (d), and 7762–8362 s (e). The time range of the data is
shown with color bars on the tw axis; their colors correspond to the colors of marks in Fig. 3d–f. The schematic
illustration of the structure of the epoxy resin in regions (A) and (B) is shown in (f), and the illustration in
region (C) is shown in (g). The two-time correlation functions were calculated by our programs written in
MATLAB 2020b (https://www.mathworks.com). The illustrations were made using Microsoft PowerPoint 2013.
affected
by statistical noise owing to the use of a finite number of pixels np . Thus, we corrected the measured
χ q, t by applying a correction procedure based on extrapolation, 1/np = 0 as reported previously51,52.
Figure 6a,b show χ that at q = 0.0325 nm−1 obtained from the last four measurement is in the range tw > 5583 s
in the 100 °C curing process and in tw > 5696 s in the 150 °C curing process, respectively. For the 100 °C curing
process, χ obtained from 5583 s < tw < 6183 s shows a clear peak (red line), which represents the instability
of dynamics. However, the peak height decreases with increasing tw , and no clear peak is observed for the last
measurement in the range 7648 s < tw < 8248 s (orange line). These peak behaviors indicate that the dynam-
ics become stable within the measurement time in the 100 °C curing process. In the 150 °C curing process, all
the four data show high peaks, although the curing reaction is faster than that in the 100 °C curing process
and a long time has passed since the gelation point obtained by the macroscopic rheological measurement (see
Supplementary Fig. 1). Moreover, the peak height does not decrease monotonically; χ in 7762 s < tw < 8362 s
has a higher peak (orange line) than χ in 7073 s < tw < 7673 s (green line). This indicated that the dynamics
were still unstable in that time region, and the dynamical heterogeneity of the resin cured at 150 °C was more
remarkable than that of the resin cured at 100 °C. Similar results were obtained in all the measured q ranges (see
Supplementary Fig. 5).
Cross‑link inhomogeneity of cured resins. In addition to the investigations of the dynamics of the
curing process presented so far, we also investigated the cross-link inhomogeneity of the cured materials. Using
1
H-pulse NMR technique, we investigated the microscopic structures of the cured resins obtained from the two
different curing processes, sample A (100 °C for 2 h + 150 °C for 5 h) and sample B (150 °C for 5 h).
The 1H-pulse NMR measurements were carried out at 120 °C, which is higher than the glass transition
temperature (66 °C for sample A and 48 °C for sample B) obtained from dynamic mechanical analysis (DMA)
measurements shown in Supplementary Fig. 6. Figure 7a,b present the results for the 1H-pulse NMR measure-
ments of samples A and B, respectively. The spectrum for sample B shows a longer relaxation time than sample
A. In general, the spin–spin relaxation function can be expressed by
Scientific Reports | (2021) 11:9767 | https://doi.org/10.1038/s41598-021-89155-x 7
Vol.:(0123456789)www.nature.com/scientificreports/
Figure 6. χ, the fluctuation of CI calculated from Eq. (4), at q = 0.0325 nm−1 obtained from the four
measurement sets at tw > 5583 s in the 100 °C curing process (a) and at tw > 5696 s in the 150 °C curing
process (b).
1 t a
M(t)
= exp − , (5)
M(0) a T2
where M(t)/M(0), a, and T2 denote the normalized magnetization intensity at t , exponent of the decay func-
tion, and time constant representing the spin–spin relaxation, respectively45,46. The range of a is from 1, for an
exponential decay, to 2, for a Gaussian decay. In polymers having low molecular mobility, such as in the crystal-
line and glassy states, the relaxation typically follows the Gaussian decay. In polymers with greater molecular
mobility, such as in the liquid and rubbery states, the relaxation follows an exponential slow decay. The cured
materials should be composed of a hard polymer with low molecular mobility due to the high cross-linking and
a soft polymer with great molecular mobility due to the poor cross-linking or free state. In fact, the measured
data were well described by the following function:
2
M(t) 1 t t t
= fHard exp − + fSoft1 exp − + fSoft2 exp − , (6)
M(0) 2 T2,Hard T2,Soft1 T2,Soft2
where fHard , fSoft1, and fSoft2 represent the molar fraction of protons for the hard polymer in the highly cross-
linked part, the soft polymer in the poorly cross-linked part, and the free polymer, respectively. T2,Hard , T2,Soft1,
and T2,Soft2 are the relaxation times of the respective polymers with the relation T2,Soft2 > T2,Soft1 > T2,Hard .
Through the fitting analysis with Eq. (6), the molar fractions were obtained as shown in Fig. 7c. For sample A, the
proportions of the high cross-linking component, low cross-linking component, and free polymer component
are 75.8, 19.8, and 4.4%, respectively, whereas for sample B, they are 21.5, 34.7, and 43.8%, respectively. These
results clearly indicate that sample A is more highly cross-linked and contains fewer free polymers than those
in sample B.
Discussion
The dynamic studies of the curing process using XPCS revealed that the microscopic dynamics were quite dif-
ferent according to the curing temperature.
In the 100 °C process, the kinetics were clearly distinguished into three different regions (I)–(III). In region
(I), the probe nanoparticles showed Brownian motion in a simple liquid, thereby indicating that the epoxy
resin was in a liquid state. The increase in viscosity was considered to indicate the progress of oligomerization
of BADGE, as shown in Fig. 4f. In the BADGE/C11Z-CN system, epoxy groups are linked by a catalytic reac-
tion to form a main chain, and the aromatic ring hangs as a side chain to generate an oligomer. The dynamics
slow down as the viscosity increases owing to the increase in molecular weight. In region (II), it was considered
that the cross-linking reaction between oligomers proceeded to form a network structure, as shown Fig. 4g. In
this process, the motion of the nanoparticles is no longer simple Brownian, and a drastic increase in viscosity
drastically slows down the dynamics. Furthermore, because a large viscosity difference is generated between
the network structure formed and unformed parts, the dynamics of the nanoparticles show heterogeneity. This
heterogeneity is reflected as an intermittent change, as shown in Fig. 4b. In region (III), the cross-linking reac-
tion, as shown in Fig. 4h, is almost complete and a network structure is formed; thus, the epoxy resin is in a
solid state. The Fourier transform infrared (FTIR) spectroscopy measurement also shows that the main reaction
was completed around 3000 s (shown in Supplementary Fig. 7a); thereafter, the reaction of the remaining epoxy
groups proceeded slowly. In this process, the dynamics gradually slow down. Moreover, because the network
Scientific Reports | (2021) 11:9767 | https://doi.org/10.1038/s41598-021-89155-x 8
Vol:.(1234567890)www.nature.com/scientificreports/
Figure 7. 1H-pulse nuclear magnetic resonance (NMR) spectrum for sample A (the solid epoxy resin cured
at 100 °C for 2 h and 150 °C for 5 h) (a). 1H-pulse NMR spectrum for sample B (the solid epoxy resin cured at
150 °C for 5 h) (b). Both measurements were carried out at 120 °C. The solid lines in (a) and (b) are obtained
from the fitting analysis with Eq. (6). (c) The molar fraction of protons for the hard polymer in the highly cross-
linking part, the soft polymer in the poorly cross-linking part, and the free polymer obtained from the fitting
analysis with Eq. (6).
structure is almost formed, no intermittent fluctuations are shown in CI . As described, it was revealed that (I)
oligomerization in a liquid state, (II) gelation, and (III) residual cross-linking reaction proceeded in order in the
100 °C curing process. This ordered process resulted in cured materials with low dynamical heterogeneity and
a dense network, as shown by 1H-pulse NMR measurements.
In the 150 °C curing process, the parameter values of α ≈ 1 and n ≈ 2 in the initial stage and α ≈ 2 and n ≈ 1
in the final stage were similar to the respective values in the 100 °C curing process, as shown in Fig. 3. However,
there was a significant difference: there was not clear regional division in the 150 °C curing process in contrast
to the 100 °C curing process. The differences in dynamic behavior between the two processes are also shown in
CI . In all the processes before solidification [regions (A) and (B) in Fig. 3d–f], CI had intermittent behavior, as
shown in Fig. 5a–d, whereas such intermittent behavior was observed solely in region (II) in the 100 °C curing
process. This indicates that the domains with fast and slow dynamics coexisted over a wide tw range from the
initial process to solidification; thus, the oligomerization and the cross-linking reaction proceeded simultane-
ously, as schematically shown in Fig. 5f. During the reaction, a large number of unreacted epoxy groups are
generated. FTIR spectroscopy results showed that the reaction almost stopped at a degree of cure approximately
0.4, as shown in Supplementary Fig. 7b. Consequently, a structure with low cross-link density was formed, as
schematically shown in Fig. 5g, which was also indicated in the 1H-pulse NMR results; this structure caused
high dynamical heterogeneity.
Here, we discuss the difference of the curing mechanism between the 100 and 150 °C curing processes. In the
present epoxy system, the curing reaction proceeded by the chemical reaction between the epoxy groups at the
ends of BADGE, which was promoted by the catalyst C11ZCN. The energy barrier of the first bonding reaction of
the epoxy group of BADGE should be lower than that of the second reaction after becoming part of the oligomer.
Scientific Reports | (2021) 11:9767 | https://doi.org/10.1038/s41598-021-89155-x 9
Vol.:(0123456789)www.nature.com/scientificreports/
The difference of the energy barrier could affect the curing kinetics between the 100 and 150 °C processes. In the
100 °C process, in the early stage, linear oligomers were formed by the reaction of the first epoxy group, and, in
the subsequent stage, the cross-linking reaction by the reaction of the second epoxy group proceeded. On the
other hand, in the 150 °C curing process, the second bonding reaction as well as the first reaction occurred in the
early stage because of the high temperature. Those reactions generated the coarse cross-linking networks in the
early stage and caused the transition from chemical control kinetics to those of diffusion control. In the 150 °C
process, as shown in the result of the rheological measurements (Supplementary Fig. 1b), the macroscopic rheo-
logical values showed solidification at about 800 s, indicating that the molecular diffusion was greatly reduced.
This solidification time agrees with the time taken by the reaction of the epoxy group to settle down in the FTIR
measurement (Supplementary Fig. 7b). Those reductions of molecular diffusion suppressed the degree of cure
around 0.4 in the 150 °C curing process, as shown in the FTIR results, whereas the degree of cure progressed
to 0.8 in the 100 °C curing process.
In summary, XPCS measurements during the curing process at two different temperatures revealed the overall
dynamics of the catalytic epoxy resin from liquid to solid state. Furthermore, it was shown that there was a large
difference in the dynamical heterogeneity in the solid state. By interpreting the XPCS results through comparison
with various measurement results, a concrete overview of the network structure was presented. In this study, we
investigated the curing process of the catalytic epoxy resin. However, there are various types of epoxy resins, and
their curing mechanisms vary accordingly. Future studies are needed to investigate the dynamics of these various
epoxy resins to provide a more general insight. Moreover, although we used the nanoparticles having diameters
of 120 nm in the present study, it has been reported in particle-tracking measurements of the curing process
of an epoxy-amine mixture that the particle size can affect particle movement53. Thus, it will be interesting to
analyze the size dependence of probe particles. These results will be particularly useful for improving the quality
of thermosetting epoxy resins as well as various materials, such as 3D printing p roducts54,55.
Materials and methods
Materials. The chemical structures of epoxy resins in this study are shown in Fig. 1. We used bisphenol A
diglycidyl ether (BADGE) (Mitsubishi Chemical, jER828) as the base resin and 1-(2-cyanoethyl)-2-undecylim-
idazole (C11ZCN) (SHIKOKU CHEMICALS CORPORATION) as the catalyst. BADGE and C11ZCN were
mixed in a weight ratio of 100:3.
For the cured resins used in the DMA and 1H-pulse NMR experiments, two different types of epoxy materi-
als were prepared: the epoxy raw resin mixture was degassed under reduced pressure, it was poured into a mold
with a thickness of 1 mm and cured at 100 °C for 2 h and 150 °C for 5 h or 150 °C for 5 h.
In the sample used in the XPCS measurements, silica particles were homogeneously distributed in a mixed
solution of the main agent and catalyst, which was utilized as a probe. Particularly, silica particles with a diameter
of 120 nm (Nissan Chemicals, Japan) were dispersed in an epoxy resin (BADGE/C11ZCN = 100/3 (g/g)) at ~ 1
vol%. By applying small-angle X-ray scattering, we confirmed that the silica particles were homogeneously dis-
persed and the interparticle interaction was negligible within the measured q range (see Supplementary Fig. 8).
XPCS measurements. The XPCS measurements were performed at beam line BL03XU at SPring-8
(Hyogo, Japan)56. The undulator source and Si (111) monochromator were tuned to an energy of 8.00 keV. The
sample was irradiated with partially coherent X-rays obtained by passing the beam through a pinhole of 20 µm
diameter, and the scattered X-rays were detected using an EIGER 1 M two-dimensional detector (Dectris, Swit-
zerland) mounted approximately 8 m at the back of the sample.
In the XPCS measurements during the curing process, we analyzed the fluctuation of the speckle patterns
scattered from the dispersed tracer particles in the epoxy resins. The samples in the liquid state were enclosed
in cells designed to have homogeneous temperature using aluminum foil as window materials, placed in a heat
bath at 100 or 150 °C, and the change in dynamics during the curing process was measured57.
1
H‑pulse NMR spectroscopy. 1
H-pulse NMR experiments were performed using a Bruker Minispec
mq20 at a proton resonance frequency of 20 MHz. The signals were acquired using the solid-echo pulse sequence
with a π/2 pulse duration of 3.1 µs, dead time of 8.3 µs, dwell time of 1 µs, recycle delay of 1 s, and 64 transients.
The epoxy cured product crushed to a size between 1 and 2 mm was filled in a glass tube Bruker E1405321_10
with a diameter of 10 mm, and its temperature was maintained at 120 °C during the measurement.
Data availability
The raw data generated and analyzed as a part of this study are available from the corresponding author upon
request.
Received: 8 February 2021; Accepted: 21 April 2021
References
1. Cipelletti, L. & Ramos, L. Slow dynamics in glassy soft matter. J. Phys. Condens. Matter 17, R253–R285. https://doi.org/10.1088/
0953-8984/17/6/r01 (2005).
2. Duri, A. & Cipelletti, L. Length scale dependence of dynamical heterogeneity in a colloidal fractal gel. Europhys. Lett. (EPL) 76,
972–978. https://doi.org/10.1209/epl/i2006-10357-4 (2006).
3. Gao, Y. & Kilfoil, M. L. Intermittent and spatially heterogeneous single-particle dynamics close to colloidal gelation. Phys. Rev. E
Stat. Nonlinear Soft Matter Phys. 79, 051406. https://doi.org/10.1103/PhysRevE.79.051406 (2009).
Scientific Reports | (2021) 11:9767 | https://doi.org/10.1038/s41598-021-89155-x 10
Vol:.(1234567890)www.nature.com/scientificreports/
4. El Masri, D., Berthier, L. & Cipelletti, L. Subdiffusion and intermittent dynamic fluctuations in the aging regime of concentrated
hard spheres. Phys. Rev. E Stat. Nonlinear Soft Matter Phys. 82, 031503. https://doi.org/10.1103/PhysRevE.82.031503 (2010).
5. Berthier, L. & Biroli, G. Theoretical perspective on the glass transition and amorphous materials. Rev. Mod. Phys. 83, 587–645.
https://doi.org/10.1103/RevModPhys.83.587 (2011).
6. Evenson, Z. et al. X-ray photon correlation spectroscopy reveals intermittent aging dynamics in a metallic glass. Phys. Rev. Lett.
115, 175701. https://doi.org/10.1103/PhysRevLett.115.175701 (2015).
7. Cui, M. et al. Transition in dynamics as nanoparticles jam at the liquid/liquid interface. Nano Lett. 17, 6855–6862. https://doi.org/
10.1021/acs.nanolett.7b03159 (2017).
8. Bouzid, M., Colombo, J., Barbosa, L. V. & Del Gado, E. Elastically driven intermittent microscopic dynamics in soft solids. Nat
Commun 8, 15846. https://doi.org/10.1038/ncomms15846 (2017).
9. Das, A., Derlet, P. M., Liu, C., Dufresne, E. M. & Maass, R. Stress breaks universal aging behavior in a metallic glass. Nat. Commun.
10, 5006. https://doi.org/10.1038/s41467-019-12892-1 (2019).
10. Pascault, J. P. & Williams, R. J. J. Epoxy Polymers: New Materials and Innovations (Wiley-VCH Verlag, 2010).
11. Jin, F.-L., Li, X. & Park, S.-J. Synthesis and application of epoxy resins: A review. J. Ind. Eng. Chem. 29, 1–11. https://doi.org/10.
1016/j.jiec.2015.03.026 (2015).
12. Sprenger, S. Epoxy resin composites with surface-modified silicon dioxide nanoparticles: A review. J. Appl. Polym. Sci. 130,
1421–1428. https://doi.org/10.1002/app.39208 (2013).
13. Horie, K., Hiura, H., Sawada, M., Mita, I. & Kambe, H. Calorimetric investigation of polymerization reactions. III. Curing reaction
of epoxides with amines. J. Polym. Sci. Part A-1 Polym. Chem. 8, 1357–1372. https://doi.org/10.1002/pol.1970.150080605 (1970).
14. Hardis, R., Jessop, J. L. P., Peters, F. E. & Kessler, M. R. Cure kinetics characterization and monitoring of an epoxy resin using
DSC, Raman spectroscopy, and DEA. Compos. A Appl. Sci. Manuf. 49, 100–108. https://doi.org/10.1016/j.compositesa.2013.01.
021 (2013).
15. Granado, L. et al. In situ vibrational probes of epoxy gelation. ACS Macro Lett. 8, 984–988. https://doi.org/10.1021/acsmacrolett.
9b00508 (2019).
16. Ma, H., Zhang, X., Ju, F. & Tsai, S. B. A Study on curing kinetics of nano-phase modified epoxy resin. Sci. Rep. 8, 3045. https://doi.
org/10.1038/s41598-018-21208-0 (2018).
17. Musto, P., Abbate, M., Ragosta, G. & Scarinzi, G. A study by Raman, near-infrared and dynamic-mechanical spectroscopies on the
curing behaviour, molecular structure and viscoelastic properties of epoxy/anhydride networks. Polymer 48, 3703–3716. https://
doi.org/10.1016/j.polymer.2007.04.042 (2007).
18. Aldridge, M., Wineman, A., Waas, A. & Kieffer, J. In situ analysis of the relationship between cure kinetics and the mechanical
modulus of an epoxy resin. Macromolecules 47, 8368–8376. https://doi.org/10.1021/ma501441c (2014).
19. Mijovic, J. & Andjelic, S. A study of reaction kinetics by near-infrared spectroscopy. 1. Comprehensive analysis of a model epoxy/
amine system. Macromolecules 28, 2787–2796. https://doi.org/10.1021/ma00112a026 (1995).
20. Eloundou, J. P., Feve, M., Gerard, J. F., Harran, D. & Pascault, J. P. Temperature dependence of the behavior of an epoxy−amine
system near the gel point through viscoelastic study. 1. Low-TgEpoxy−amine system. Macromolecules 29, 6907–6916. https://doi.
org/10.1021/ma960287d (1996).
21. Winter, H. H. & Mours, M. Rheology of polymers near liquid-solid transitions. Neutron Spin Echo Spectrosc. Viscoelasticity Rheol.
134, 165–234. https://doi.org/10.1007/3-540-68449-2_3 (1997).
22. O’Brien, D. J., Mather, P. T. & White, S. R. Viscoelastic properties of an epoxy resin during cure. J. Compos. Mater. 35, 883–904.
https://doi.org/10.1177/002199801772662442 (2001).
23. Enns, J. B. & Gillham, J. K. Time–temperature–transformation (TTT) cure diagram: Modeling the cure behavior of thermosets.
J. Appl. Polym. Sci. 28, 2567–2591. https://doi.org/10.1002/app.1983.070280810 (1983).
24. Wisanrakkit, G. & Gillham, J. K. The glass transition temperature (Tg) as an index of chemical conversion for a high-Tg amine/
epoxy system: Chemical and diffusion-controlled reaction kinetics. J. Appl. Polym. Sci. 41, 2885–2929. https://doi.org/10.1002/
app.1990.070411129 (1990).
25. Prime, R. B. in Thermal Characterization of Polymeric Materials Vol. 2 (ed Turi, E. A.) Ch. 6, 1379–1766 (Academic Press, 1997).
26. Boey, F. Y. C. & Qiang, W. Experimental modeling of the cure kinetics of an epoxy-hexaanhydro-4-methylphthalicanhydride
(MHHPA) system. Polymer 41, 2081–2094. https://doi.org/10.1016/s0032-3861(99)00409-7 (2000).
27. Ramos, J. A. et al. Cure kinetics and shrinkage model for epoxy-amine systems. Polymer 46, 3323–3328. https://doi.org/10.1016/j.
polymer.2005.02.069 (2005).
28. Zhao, L. & Hu, X. A variable reaction order model for prediction of curing kinetics of thermosetting polymers. Polymer 48,
6125–6133. https://doi.org/10.1016/j.polymer.2007.07.067 (2007).
29. Bernath, A., Karger, L. & Henning, F. Accurate cure modeling for isothermal processing of fast curing epoxy resins. Polymers
(Basel). https://doi.org/10.3390/polym8110390 (2016).
30. Sasaki, T., Uchida, T. & Sakurai, K. Effect of crosslink on the characteristic length of glass transition of network polymers. J. Polym.
Sci. Part B Polym. Phys. 44, 1958–1966. https://doi.org/10.1002/polb.20852 (2006).
31. Fan, H. B. & Yuen, M. M. F. Material properties of the cross-linked epoxy resin compound predicted by molecular dynamics
simulation. Polymer 48, 2174–2178. https://doi.org/10.1016/j.polymer.2007.02.007 (2007).
32. Shen, J., Lin, X., Liu, J. & Li, X. Effects of cross-link density and distribution on static and dynamic properties of chemically cross-
linked polymers. Macromolecules 52, 121–134. https://doi.org/10.1021/acs.macromol.8b01389 (2018).
33. Oya, Y. et al. Molecular dynamics simulation of cross-linking processes and material properties for epoxy resins using first-principle
calculation combined with global reaction route mapping algorithms. Chem. Phys. Lett. 762, 138104. https://doi.org/10.1016/j.
cplett.2020.138104 (2021).
34. Li, X., Nakagawa, S., Tsuji, Y., Watanabe, N. & Shibayama, M. Polymer gel with a flexible and highly ordered three-dimensional
network synthesized via bond percolation. Sci. Adv. 5, eaax8647. https://doi.org/10.1126/sciadv.aax8647 (2019).
35. Sutton, M. et al. Observation of speckle by diffraction with coherent X-rays. Nature 352, 608–610. https://doi.org/10.1038/35260
8a0 (1991).
36. Grübel, G., Madsen, A. & Robert, A. in Soft Matter Characterization (eds. Redouane, B. & Robert, P.) 953–995 (Springer Nether-
lands, 2008).
37. Czakkel, O. & Madsen, A. Evolution of dynamics and structure during formation of a cross-linked polymer gel. EPL (Europhys.
Lett.) 95, 28001. https://doi.org/10.1209/0295-5075/95/28001 (2011).
38. Begam, N. et al. Kinetics of network formation and heterogeneous dynamics of an egg white gel revealed by coherent X-ray scat-
tering. Phys. Rev. Lett. https://doi.org/10.1103/PhysRevLett.126.098001 (2021).
39. Yavitt, B. M. et al. Revealing nanoscale dynamics during an epoxy curing reaction with X-ray photon correlation spectroscopy. J.
Appl. Phys. 127, 114701. https://doi.org/10.1063/1.5141488 (2020).
40. Berthier, L., Biroli, G., Bouchaud, J.-P., Cipelletti, L. & van Saarloos, W. Dynamical Heterogeneities in Glasses, Colloids, and Granular
Media. (Oxford University Press, 2011).
41. Conrad, H. et al. Correlated heterogeneous dynamics in glass-forming polymers. Phys. Rev. E Stat. Nonlinear Soft Matter Phys. 91,
042309. https://doi.org/10.1103/PhysRevE.91.042309 (2015).
42. Hoshino, T., Fujinami, S., Nakatani, T. & Kohmura, Y. Dynamical heterogeneity near glass transition temperature under shear
conditions. Phys. Rev. Lett. 124, 118004. https://doi.org/10.1103/PhysRevLett.124.118004 (2020).
Scientific Reports | (2021) 11:9767 | https://doi.org/10.1038/s41598-021-89155-x 11
Vol.:(0123456789)www.nature.com/scientificreports/
43. Rowland, T. J. & Labun, L. C. Effects of cross-linking on proton spin-lattice relaxation in polybutadiene. Macromolecules 11,
466–471. https://doi.org/10.1021/ma60063a006 (1978).
44. Fry, C. G. & Lind, A. C. Determination of crosslink density in thermoset polymers by use of solid-state proton NMR techniques.
Macromolecules 21, 1292–1297. https://doi.org/10.1021/ma00183a019 (1988).
45. Cohen Addad, J. P. in Physical Properties of Polymeric Gels (ed. Cohen Addad, J. P.) 39–86 (Wiley, 1996).
46. Yasunaga, H., Kobayashi, M., Matsukawa, S., Kurosu, H. & Ando, I. Structures and dynamics of polymer gel systems viewed using
NMR spectroscopy. Annu. Rep. NMR Spectrosc. 34, 39–104. https://doi.org/10.1016/s0066-4103(08)60101-5 (1997).
47. Izumi, A., Nakao, T. & Shibayama, M. Gelation and cross-link inhomogeneity of phenolic resins studied by small- and wide-angle
X-ray scattering and 1H-pulse NMR spectroscopy. Polymer 59, 226–233. https://doi.org/10.1016/j.polymer.2015.01.018 (2015).
48. Watanabe, N., Li, X. & Shibayama, M. Probe diffusion during sol-gel transition of a radical polymerization system using isorefrac-
tive dynamic light scattering. Macromolecules 50, 9726–9733. https://doi.org/10.1021/acs.macromol.7b02202 (2017).
49. Brown, G., Rikvold, P. A., Sutton, M. & Grant, M. Speckle from phase-ordering systems. Phys. Rev. E 56, 6601–6612. https://doi.
org/10.1103/PhysRevE.56.6601 (1997).
50. Malik, A. et al. Coherent X-ray study of fluctuations during domain coarsening. Phys. Rev. Lett. 81, 5832–5835. https://doi.org/
10.1103/PhysRevLett.81.5832 (1998).
51. Duri, A., Bissig, H., Trappe, V. & Cipelletti, L. Time-resolved-correlation measurements of temporally heterogeneous dynamics.
Phys. Rev. E Stat. Nonlinear Soft Matter Phys. 72, 051401. https://doi.org/10.1103/PhysRevE.72.051401 (2005).
52. Trappe, V. et al. Investigation of q-dependent dynamical heterogeneity in a colloidal gel by X-ray photon correlation spectroscopy.
Phys. Rev. E Stat. Nonlinear Soft Matter Phys. 76, 051404. https://doi.org/10.1103/PhysRevE.76.051404 (2007).
53. Aoki, M., Shundo, A., Kuwahara, R., Yamamoto, S. & Tanaka, K. Mesoscopic heterogeneity in the curing process of an epoxy-amine
system. Macromolecules 52, 2075–2082. https://doi.org/10.1021/acs.macromol.8b02416 (2019).
54. Yavitt, B. M. et al. Structural dynamics in UV curable resins resolved by in situ 3D printing X-ray photon correlation spectroscopy.
ACS Appl. Polym. Mater. 2, 4096–4108. https://doi.org/10.1021/acsapm.0c00716 (2020).
55. Torres Arango, M. A. et al. In-operando study of shape retention and microstructure development in a hydrolyzing sol-gel ink
during 3D-printing. ACS Appl Mater Interfaces 12, 51044–51056. https://doi.org/10.1021/acsami.0c14743 (2020).
56. Masunaga, H. et al. Multipurpose soft-material SAXS/WAXS/GISAXS beamline at SPring-8. Polym. J. 43, 471–477. https://doi.
org/10.1038/pj.2011.18 (2011).
57. Hoshino, T. et al. Thermal gradient effect on the dynamical behavior of nanoparticles observed using X-ray photon correlation
spectroscopy. Polym. J. 45, 94–99. https://doi.org/10.1038/pj.2012.193 (2012).
Acknowledgements
The XPCS measurements were performed at SPring-8 BL03XU (Frontier Softmaterial Beamline, FSBL) with the
proposal numbers 2019B7259, 2020A7209. DMA measurements were performed by Nitto Analytical Techno-
Center Co., Ltd. T. H. acknowledges JSPS KAKENHI (Grant No. JP18K05226).
Author contributions
T.H., Y.O., and A.Y. designed the research; T.H., Y.O., A.Y., and H.M. performed XPCS measurements. Y.O. and
A.Y. prepared the samples and performed the FTIR measurements, 1H-pulse NMR spectroscopy, and rheological
measurements. T.H. analyzed the XPCS data and performed part of rheological measurements. T.H., Y.O., and
A.Y. interpreted the data. T.H. wrote the paper.
Competing interests
The authors declare no competing interests.
Additional information
Supplementary Information The online version contains supplementary material available at https://doi.org/
10.1038/s41598-021-89155-x.
Correspondence and requests for materials should be addressed to T.H.
Reprints and permissions information is available at www.nature.com/reprints.
Publisher’s note Springer Nature remains neutral with regard to jurisdictional claims in published maps and
institutional affiliations.
Open Access This article is licensed under a Creative Commons Attribution 4.0 International
License, which permits use, sharing, adaptation, distribution and reproduction in any medium or
format, as long as you give appropriate credit to the original author(s) and the source, provide a link to the
Creative Commons licence, and indicate if changes were made. The images or other third party material in this
article are included in the article’s Creative Commons licence, unless indicated otherwise in a credit line to the
material. If material is not included in the article’s Creative Commons licence and your intended use is not
permitted by statutory regulation or exceeds the permitted use, you will need to obtain permission directly from
the copyright holder. To view a copy of this licence, visit http://creativecommons.org/licenses/by/4.0/.
© The Author(s) 2021
Scientific Reports | (2021) 11:9767 | https://doi.org/10.1038/s41598-021-89155-x 12
Vol:.(1234567890)You can also read