High COVID-19 transmission potential associated with re-opening universities can be mitigated with layered interventions
←
→
Page content transcription
If your browser does not render page correctly, please read the page content below
ARTICLE
                   https://doi.org/10.1038/s41467-021-25169-3                 OPEN

                  High COVID-19 transmission potential associated
                  with re-opening universities can be mitigated with
                  layered interventions
                  Ellen Brooks-Pollock 1,2 ✉, Hannah Christensen2, Adam Trickey2, Gibran Hemani 2, Emily Nixon                                                         3,

                  Amy C. Thomas1, Katy Turner 1,2, Adam Finn4, Matt Hickman2, Caroline Relton2 & Leon Danon5
1234567890():,;

                  Controlling COVID-19 transmission in universities poses challenges due to the complex social
                  networks and potential for asymptomatic spread. We developed a stochastic transmission
                  model based on realistic mixing patterns and evaluated alternative mitigation strategies. We
                  predict, for plausible model parameters, that if asymptomatic cases are half as infectious as
                  symptomatic cases, then 15% (98% Prediction Interval: 6–35%) of students could be infected
                  during the first term without additional control measures. First year students are the main
                  drivers of transmission with the highest infection rates, largely due to communal residences.
                  In isolation, reducing face-to-face teaching is the most effective intervention considered,
                  however layering multiple interventions could reduce infection rates by 75%. Fortnightly or
                  more frequent mass testing is required to impact transmission and was not the most effective
                  option considered. Our findings suggest that additional outbreak control measures should be
                  considered for university settings.

                  1 Bristol
                          Veterinary School, University of Bristol, Langford, Bristol, UK. 2 Population Health Sciences, Bristol Medical School, University of Bristol, Bristol, UK.
                  3 Schoolof Biological Sciences, University of Bristol, Bristol, Bristol, UK. 4 Bristol Children’s Vaccine Centre, University of Bristol, Bristol, Bristol, UK.
                  5 Department of Engineering Mathematics, University of Bristol, Bristol, Bristol, UK. ✉email: Ellen.Brooks-Pollock@bristol.ac.uk

                  NATURE COMMUNICATIONS | (2021)12:5017 | https://doi.org/10.1038/s41467-021-25169-3 | www.nature.com/naturecommunications                                        1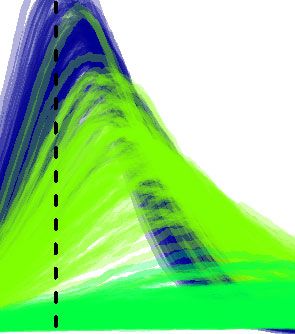
ARTICLE                                                                 NATURE COMMUNICATIONS | https://doi.org/10.1038/s41467-021-25169-3

D
         espite the on-going COVID-19 epidemic, social distan-               systematic difference (29.9 versus 26.8, p value 0.40). The
         cing measures in many countries were beginning to be                majority (82%, 95% CI: 79%, 86%) of students’ social contacts are
         relaxed and universities across the world re-opened for             either home or associated with university. On average, students
the new academic term in September 2020. In the UK, there are                reported 20.0 (95% CI: 14.1, 28.8) university contacts, and 4.3
2.3 million students, with up to 40,000 undergraduates at a single           (95% CI: 2.7, 6.5) other/leisure contacts.
institution1. Universities are integral to many towns and cities in             To capture student contact patterns within a university, we
the UK: for example, in the 2011 census, a quarter of Oxford’s               used comprehensive anonymised student accommodation data
adult population was registered as a full-time student. Managing             for the academic year 2019/2020 from the University of Bristol
universities is a complex operation, and in the context of the               (UoB). The data included 20,819 registered undergraduates and
COVID-19 epidemic, re-opening universities poses particular                  8501 registered postgraduates divided into 6 faculties and
challenges for containing disease transmission.                              28 schools and 2862 unique postcodes (see Supplementary
   In June 2020, the UK moved from a national containment                    Table 1 for number of students by year of study and faculty).
strategy to localised containment of outbreaks, with the number              Most students (92%) are under 30 years of age and the largest
of cases highly variable across the country. The imposition of               school is the School of Economics, Finance and Management
lockdown in March 2020 led to a substantial reduction in travel              with 3674 students.
and mobility, and local lockdowns have led to further reduced                   We used the student data to create synthetic contact matrices
movement in some parts of the country. In the UK, re-opening                 for mixing between year-groups and schools. From postcodes we
universities is associated with a mass travel event. Around 80% of           generated between school household contact matrices for each
students leave home to attend university, moving an average 90               year of study, and for all years (Supplementary Notes 1 and 2
miles2. This synchronised event will increase population mixing              and Fig. 1). Halls of residence dominate the first-year contact
at a national scale with the potential to spark outbreaks in new             matrix, with mixing across all schools and no clear assortative
areas if not carefully managed. Once the university term starts              mixing (Fig. 1a).
there are more unique challenges facing universities. Students, in              In years 2 and 3, the average household size decreases sub-
common with other 20- to 30-year olds, report high numbers of                stantially and there is increased assortativity mixing between
social contacts in their everyday lives3. Student accommodation              schools, indicating that students are more likely to share
frequently involves communal living, either in halls of residence            accommodation with someone from their own school by choice
that house several hundred students, or in all-student households            (Fig. 1b, c).
renting in the private sector. Regular face-to-face teaching can                The university-wide contact matrix consists of 161 groups of
involve several hundred students in a lecture theatre, and even              students categorised by 28 schools and nine year-groups (0, 1, 2,
without large lectures, tutorials and small group teaching involve           3, 4, 5, 6, PGT (taught postgraduates), PGR (research post-
close and prolonged contact between individuals.                             graduates)) (Fig. 1d). The higher level of mixing between first
   The potentially high rate of transmission within a university             years is evident in the lower left-hand corner and the assortative
setting is unlikely to translate to high morbidity among students.           mixing by year and school is shown by the diagonal. There are
There is a marked age disparity in severe COVID-19 cases, with               fewer inter-year household contacts and more intra-university
younger people less likely to exhibit typical symptoms or suffer             mixing between taught postgraduates than for research
severe outcomes4. In the UK at the time of writing, less than 0.2%           postgraduates.
of COVID-19-related deaths are in persons under 30. Students                    We investigated the dynamics of an epidemic in the student
are typically young adults in their early twenties. Nevertheless,            population using a stochastic compartmental model with plau-
young adults are susceptible to infection and infectious to others.          sible COVID-19 parameter values (Table 1 and Fig. 2). Because of
Hence, there is a risk of transmission within the student popu-              the population structure, the stochasticity and relatively small
lation, posing a risk to vulnerable students, people outside the             numbers involved, there is large intrinsic variability between
university setting and family members when students                          simulations with identical parameter values; we report the mean
return home.                                                                 and 98% prediction interval (PI).
   A number of studies have investigated the challenges inherent                Using plausible parameters (asymptomatic cases half as infec-
in reopening of universities amidst the COVID-19 pandemic5–9.                tious as symptomatic cases and a reproduction number of
Existing models have mainly focused on isolated campus uni-                  RU ¼ 2:7, see Supplementary Note 3), and without interventions
versities in the US, rather than civic universities that are common          or holidays, we predict a university-wide outbreak with an early
in the UK and elsewhere6,9, and the majority have not had access             growth rate of 0.07 (98% PI: 0.03–0.10), which is equivalent to a
to realistic mixing patterns within the university setting, which            doubling time of 9 days (98% PI: 7–24 days) (Fig. 3a). Based on
drive transmission. In this paper we combined analysis of                    the timescales of COVID-19 with baseline parameters, we expect
social contact data with a data-driven mathematical modelling                that it would take around 4 months for the outbreak to peak,
approach to investigate the impact of re-opening a UK university             assuming no winter break.
on COVID-19 transmission. We characterise patterns of disease                   First-year students drive the early part of the outbreak and
transmission and investigate potential mitigating effects of                 experience the highest burden of infection, followed by second
interventions. These results are used to synthesise guidance on              and third years and taught postgraduate students (Fig. 3b). Stu-
measures that universities might wish to consider for effective              dents in year 4 and above and research postgraduates have the
outbreak control once students arrive or return for the forth-               lowest infection rates.
coming academic year.                                                           By the end of the first term, under the baseline model 4200
                                                                             (98% PI: 1800–9800) students, or 15% (98% PI: 6–35%), have
                                                                             been infected. On the last day of term 54 (98% PI: 15–140)
Results                                                                      symptomatic cases and 640 (98% PI: 200–1600) asymptomatic
The Social Contact Survey (SCS) included 363 participants whose              cases are still infectious. On average, there are between 13 and 15
listed occupation included ‘STUDENT’. Students reported more                 asymptomatic cases for every one symptomatic case. The number
home contacts than other participants (3.5 versus 2.3, p value <             of cases doubles every 7–22 days. Without additional control
0.001). However, although students reported more contacts than               measures, 68% (98% PI: 44–83%) of students would be infected
other participants on average, there was no evidence of a                    by the end of the academic year. The low rate of symptoms and

2                NATURE COMMUNICATIONS | (2021)12:5017 | https://doi.org/10.1038/s41467-021-25169-3 | www.nature.com/naturecommunications
NATURE COMMUNICATIONS | https://doi.org/10.1038/s41467-021-25169-3 ARTICLE
a Year 1 b Year 2
Centre for Applied Anatomy Centre for Applied Anatomy
International Office Faculty of Arts
Education Centre For Innovation 3.5
# students at postcode
# students at postcode
Centre For Innovation Education
School of Earth Sciences Dentistry
Faculty of Arts 50 School of Earth Sciences 3.0
Dentistry Biochemistry
Biochemistry School of Chemistry
Physiology, Pharmacology & Neurosci
Cellular & Molecular Medicine 40 School of Psychological Science
Physiology, Pharmacology & Neurosci
2.5
School of Chemistry Cellular & Molecular Medicine
Vet Medicine
School of Psychological Science
30
Geography
School for Policy Studies 2.0
School of Physics School of Physics
Geography
School for Policy Studies
School of Biological Sciences
Vet Medicine
School of Biological Sciences 1.5
Medicine 20 Modern Languages
Mathematics
Sociology, Politics & International St
Modern Languages Medicine 1.0
Mathematics Sociology, Politics & International St
School of Arts 10 School of Arts
0.5
Comp Sci, E&E Eng & Eng Maths Comp Sci, E&E Eng & Eng Maths
Law Civil, Aerospace & Mech Eng
Law
Civil, Aerospace & Mech Eng
School of Humanities 0 School of Humanities 0.0
Economics, Finance & Management Economics, Finance & Management
Economics, Finance & Management
School of Humanities
Civil, Aerospace & Mech Eng
Centre for Applied Anatomy
Economics, Finance & Management
Law
Comp Sci, E&E Eng & Eng Maths
Mathematics
Modern Languages
Sociology, Politics & International St
Medicine
School of Biological Sciences
School for Policy Studies
Geography
School of Psychological Science
Education
School of Humanities
Centre for Applied Anatomy
School of Arts
School of Physics
Vet Medicine
Cellular & Molecular Medicine
Centre For Innovation
School of Chemistry
Physiology, Pharmacology & Neurosci
Biochemistry
Dentistry
Faculty of Arts
School of Earth Sciences
International Office
Law
Civil, Aerospace & Mech Eng
Comp Sci, E&E Eng & Eng Maths
Sociology, Politics & International St
Medicine
Mathematics
Modern Languages
School of Biological Sciences
Physiology, Pharmacology & Neurosci
School of Psychological Science
School of Arts
Vet Medicine
School of Physics
School for Policy Studies
Geography
Cellular & Molecular Medicine
School of Chemistry
Biochemistry
School of Earth Sciences
Dentistry
Education
Centre For Innovation
Faculty of Arts
Year 3
d
c
Centre for Applied Anatomy T
Modern Languages
3.5 40
Faculty of Arts
# students at postcode
Education
Centre For Innovation
# students at postcode
School of Earth Sciences 3.0 R 10
Year of study
Dentistry
Biochemistry
School of Chemistry
School for Policy Studies
2.5 5
School of Physics
Cellular & Molecular Medicine 2.0
4
Physiology, Pharmacology & Neurosci
Geography 1
School of Psychological Science
Vet Medicine
1.5
Sociology, Politics & International St
School of Biological Sciences 1.0 3
Mathematics
School of Arts
Medicine 0.5 0.1
Comp Sci, E&E Eng & Eng Maths
Civil, Aerospace & Mech Eng
Law
School of Humanities 0.0 2
Economics, Finance & Management
Economics, Finance & Management
School of Humanities
Law
Civil, Aerospace & Mech Eng
Comp Sci, E&E Eng & Eng Maths
Medicine
Mathematics
School of Biological Sciences
Sociology, Politics & International St
School of Arts
Vet Medicine
School of Psychological Science
Geography
Physiology, Pharmacology & Neurosci
Cellular & Molecular Medicine
School of Physics
School for Policy Studies
School of Chemistry
Biochemistry
Centre For Innovation
Dentistry
School of Earth Sciences
Education
Faculty of Arts
Modern Languages
Centre for Applied Anatomy
1 0
0
0 1 2 3 45 R T
Year of study
Fig. 1 Student mixing matrices based on shared accommodation. The average number of students in each school sharing accommodation in a year 1,
b year 2, c year 3 and d for all years and schools. The years are six undergraduate years: 0, 1, 2, 3, 4, 5 and two postgraduate groups R (research) and T
(taught). The columns are ordered by total number of accommodation contacts. Data relate to the University of Bristol for the 2019/2020 academic year.
symptomatic cases; however, because asymptomatic cases do not
self-isolate without a test, for higher values of relative infec-
tiousness, ε, asymptomatic cases produce on average more sec-
ondary cases than symptomatic cases (see Supplementary Note 3
and Supplementary Fig. S3). For lower values of ε, university-
focussed outbreaks are largely driven by the forcing from outside
the university. For intermediate values, outbreaks peak after the
first term. For high values, outbreaks peak before the end of the
first term (see Supplementary Note 4 and Supplementary Figs. S4
and S5).
Fig. 2 Model schematic. Model flow diagram with infection states and rates As a comparison to the baseline case, if asymptomatic cases are
between them for the stochastic meta-population model. The 30% as infectious as symptomatic cases (RU ¼ 2:25) then we
compartments are S: susceptible to infection, E: exposed, or infected but expect an early growth rate of 0.06 (98% PI: 0.04–0.09) and a
pre-infectious, P: pre-symptomatic and infectious, I: symptomatic and doubling time of 12 days (98% PI: 8–17 days). Without additional
infectious, A: asymptomatic and infectious, Q: in quarantine, R: recovered control measures, 36% (98% PI: 12–57%) of students would be
and immune. The subscript i refers to the subgroup. An explanation of the infected by the end of the academic year. The epidemic profiles
rates is given in the main text, Eqs. (1) and (2) and Table 1. for the full 98% PI of potential scenarios for asymptomatic
infectiousness, which corresponds to reproduction numbers from
low morbidity rate results in a median of zero deaths in the 1.7 to 3.4, are shown in Supplementary Fig. S5.
student population. We investigated multiple interventions that reduced the
The relative infectiousness of asymptomatic cases is central for infection burden in the student population (Fig. 3c–f). The
determining the scale of a university-based outbreak. In our impact of implementing each intervention was explored in iso-
framework, asymptomatic cases are either less or as infectious as lation and in combination with other measures. When layering
NATURE COMMUNICATIONS | (2021)12:5017 | https://doi.org/10.1038/s41467-021-25169-3 | www.nature.com/naturecommunications 3ARTICLE NATURE COMMUNICATIONS | https://doi.org/10.1038/s41467-021-25169-3
6000
a baseline b
40
year 1
year 2
# symptomatic
4000 year 3
30
# infected
year 4
PGT
20
PGR
2000
10
0
0
Nov Jan Mar May Jul Nov Jan Mar May Jul
6000
6000
c baseline
CS 25%
d baseline
f2f teaching 15
4000
4000
CS 50% f2f teaching 5
# infected
# infected
2000
2000
0
0
Nov Jan Mar May Jul Nov Jan Mar May Jul
6000
6000
e baseline
Living circles 20
f baseline
Mass testing 1 week
4000
4000
Living circles 14 Mass testing 2 days
# infected
# infected
2000
2000
0
0
Nov Jan Mar May Jul Nov Jan Mar May Jul
Reproduction number
1.7 2 2.3 2.5 2.7 2.9 3 3.2 3.3 3.4
g
Living circles 20 8
Living circles 14 7
Mass testing 1 week 6
Rank
COVID security 25% 5
Mass testing 2 days 4
f2f teaching 15 3
COVID security 50% 2
f2f teaching 5 1
0.2 0.4 0.6 0.8 1.0
asymptomatic infectiousness, ε
interventions, we implemented lower cost interventions first, such interactions has the potential to reduce, but not completely
as creating COVID-secure interactions with face coverings and eliminate, the size of outbreaks (Fig. 3c). We estimate that by
social/physical distancing, and reserved mass testing of non- reducing transmission for non-household contacts by 25% the
symptomatic students as a more resource-intensive intervention. early doubling time is between 7 and 20 days. The percentage of
For realistic values of COVID security and RU ¼ 2:7, we find students infected by the end of the first term is 9% (98% PI:
that reducing the transmission probability with COVID-secure 4–28%) and the number of symptomatic and asymptomatic
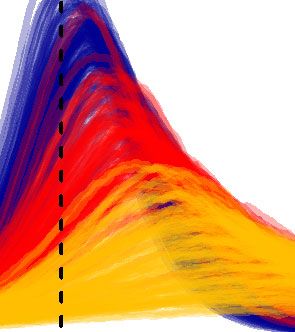
4 NATURE COMMUNICATIONS | (2021)12:5017 | https://doi.org/10.1038/s41467-021-25169-3 | www.nature.com/naturecommunicationsNATURE COMMUNICATIONS | https://doi.org/10.1038/s41467-021-25169-3 ARTICLE Fig. 3 Epidemic trajectories from the stochastic model. a Epidemic trajectories for the total number of infected cases (symptomatic and asymptomatic cases) the baseline model from 100 realisations with best estimate parameters. b Mean number of symptomatic cases by year group from 100 realisations. Undergraduate years 1, 2, 3 and 4, taught postgraduates (PGT) and research postgraduates (PGR) are shown. c Epidemic trajectories when COVID security (CS) measures reduce transmission by 50 and 25%. d Epidemic trajectories when face-to-face teaching (f2f) is limited to 15 and 5 persons. e Epidemic trajectories for reduced living circles to 20 and 14 persons. f Epidemic trajectories when reactive mass testing is implemented every week and every 2 days. Dotted vertical lines denote the end of the first term. g Ranking of interventions by mean number of symptomatic cases at the end of the first term from 100 realisations for increasing values of asymptomatic infectiousness, and therefore also increasing values of the reproduction number. The colours correspond to the colours of the epidemic trajectories above. students infectious on the last day of term is decreased to 30 (98% infected during the outbreak by 1.3%. Increasing testing fre- PI: 11–120) and 360 (98% PI: 120–1300), respectively. Reducing quency to fortnightly, weekly or every 3 or 2 days was beneficial, transmission for non-household contacts by 50% increases the and this was robust to parameter choice (Supplementary Fig. S5). doubling time to 13 (98% PI: 7–36) days and further reduces the We found that implementing multiple, layered interventions number of infectious students on the last day of term 16 (98% PI: was able to effectively control transmission in the student 2–57) symptomatic cases and 188 (98% PI: 59–650) population (Fig. 4a–c). The remaining cases in students were asymptomatic cases. largely due to importation of infection from outside the university Reducing the number of interactions made during face-to-face setting: reducing the background rate of infection demonstrates teaching from 20 to 15 other students increases the mean early that if imported infections could be managed then the number of doubling time to 11 (98% PI: 7–20) days and reduces the number infected students could be very low. of infected students at the end of the first term to 33 (98% PI: 10–110) symptomatic cases and 403 (98% PI: 120–1200) Discussion asymptomatic cases (Fig. 3d). Reducing the number of face-to- Our results suggest that, under normal circumstances, COVID-19 face contacts from 20 to 5 other students was the single most would spread readily in a university setting. Our data-driven impactful intervention investigated in terms of the number of approach reveals natural heterogeneities in student mixing pat- students infected by the end of the first term and the number of terns that can be exploited to enhance disease control. We find infectious students on the last day of term, increasing doubling that controlling transmission is possible with combinations of time to 16 (98% PI: 9–110) days, including scenarios in which the social distancing, online teaching, self-isolation and potentially number of cases in the student population was driven to zero mass testing of students without symptoms. (Fig. 3d). The number of infected students at the end of the first Our findings highlight the importance of monitoring first-year term was 11 (98% PI: 2–32) symptomatic cases and 140 (98% PI: students and halls of residence in particular. In our analysis, first- 54–330) asymptomatic cases. year students experienced the highest rates of infection and dom- Implemented without other measures, reducing the size of inate the early part of the outbreak due to the high levels of mixing living circles (defined as the number of students that share in halls of residence. Since we first conducted this work in May 2020, bathroom/kitchen facilities) from 24 to 20 or 14 students was a cross-sectional serosurvey of students in five English universities overall the least effective intervention investigated (Fig. 3e and found that first-year undergraduates were three times more likely to Supplementary Table 2). However, when implemented on top of be seropositive than other year groups and that seropositivity was COVID-secure interactions and reductions in face-to-face 49% in students living in halls of residence in universities with high teaching, reducing living circles to 14 individuals does reduce SARS-CoV-2 infection rates10. Halls of residence have been identi- the total percentage of students that are infected by the end of the fied as a risk factor for the transmission of other close-contact first term by 25%. infections including meningitis11, mumps12, norovirus13, respiratory Mass testing all students regardless of symptoms was effective illnesses14 and gastroenteritis15. In practice, students in larger resi- at reducing the total number of infections and the initial rate of dences are allocated into shared flats or living circles, potentially epidemic growth rate, but reactive testing was required for the limiting widespread transmission. Limiting transmission within whole year (Fig. 3f). Compared to other interventions, mass residences is paramount for COVID-19 control in university testing was generally more effective for higher values of the settings. reproduction number and resulted in the third lowest number of Lessons about infection control in universities can be learnt infected students by the end of the first term. However, for lower from other diseases. Mass vaccination used for meningitis, values of asymptomatic infectiousness, and hence lower values of mumps and rubella outbreaks was not an option for COVID-19 the reproduction number, reducing face-to-face teaching, imple- in early 2020. During a mumps outbreak in a university hall of menting COVID security and reduced living circles were more residence, Kay et al. reported difficulty in identifying higher risk effective than testing all students (Fig. 3g). students12. Due to the high number of contacts and of students’ Testing all students every 2 days primarily reduced the number contact networks inhabit, universities may wish to consider how of students with asymptomatic and pre-symptomatic infections, they might facilitate the collation of data to expedite the contact- reducing the ratio of asymptomatic to symptomatic cases to tracing process. Embedding positive health behaviours like hand 9:1–11:1. However, the reduction in infection from mass testing washing and using face coverings will also contribute to mini- comes at a substantial cost in terms of the number of students mising transmission opportunities. A randomised control trial of self- isolating: under 2 day testing, at the height of the outbreak, hand washing in university residences found that installing 1300 (860–1500) students (4.5, 3–5%) were self-isolating com- alcohol hand sanitiser in every room, bathroom and dining hall pared to 520 (98% PI: 470–560) students (1.9, 1.7–2.0%) in the reduced respiratory illness in students by 20%14. baseline scenario. Previous modelling work, based on universities in the United Testing all students monthly had a minimal impact compared States, has focussed on the necessity of regularly testing all to not testing at all, reducing the average percentage of students students5. While our findings are consistent that frequent testing NATURE COMMUNICATIONS | (2021)12:5017 | https://doi.org/10.1038/s41467-021-25169-3 | www.nature.com/naturecommunications 5
ARTICLE                                                                            NATURE COMMUNICATIONS | https://doi.org/10.1038/s41467-021-25169-3

                                                                                                                  1000 2000 3000
                                                                                       # infected students t=84
                                                                               a                                                                                       b

                      # symptomatic
                                            50 100
                                            0

                                                                                                                  0
                                                     Nov   Jan   Mar   May   Jul                                                   1   2   3       4          5        6
                      # in self−isolation

                                                                                   c                                                   baseline
                                            600

                                                                                                                                       25% COVID secure
                                                                                                                                       f2f teaching 10
                                                                                                                                       Living circles 14
                                            0 200

                                                                                                                                       Mass testing 2 days
                                                                                                                                       limit importation

                                                     Nov   Jan   Mar   May   Jul

Fig. 4 The impact of implementing layering interventions. The intervention indicated in the legend is implemented in addition to the interventions above.
a Number of symptomatic cases. b Number of infected (symptomatic (left bar) and asymptomatic (right bar)) students at the end of the first term (day
84). The height of the bar indicates the mean from 100 model replicates and the points show the individual model replicates. c Number of students that are
self-isolating. The interventions considered are 25% COVID security (a 25% reduction in per contact transmission), limiting face-to-face (f2f) teaching to
10 persons, limiting living circles to 14 persons, mass asymptomatic testing every 2 days and limiting transmission from outside the university.
is necessary if used in isolation, our modelling approach                              government16 and used directly to inform planning for re-
demonstrates that other interventions are viable. This is partly                       opening at the University of Bristol. In the absence of university
due to our result that suggests that the reproduction number                           outbreak data, we used COVID-19 transmission parameters
would be lower than previous studies have assumed due to the                           estimated from other settings. Once the university year starts, and
high proportion of asymptomatic cases. Furthermore, as previous                        should there be an outbreak, this type of modelling should be
studies have discussed5, when prevalence is low, high testing                          used to estimate parameters in real time and provide a more
burden can lead to unnecessary isolation of negative cases. We                         accurate tool for guiding interventions.
tried to mitigate test burden by implementing reactive mass
testing once incidence increased. Antibody testing could also play                     Methods
in role in determining prior infection and infection rates in stu-                     The SCS was a paper-based and online survey of 5388 unique participants in Great
dent populations.                                                                      Britain conducted in 20103,17. We have previously used these data to estimate the
                                                                                       reproduction number for COVID-1918. The SCS included 363 participants whose
   Our work uses a similar compartmental modelling approach to                         listed occupation included ‘STUDENT’. We extracted these participants to sum-
the handful of models that have been developed for COVID-19                            marise their contacts by context (home, university, leisure/other, travel) and to
transmission in universities in the USA. A drawback of this                            estimate the potential COVID-19 reproduction number in students. We used
approach is that individual behaviour is not readily captured; in                      Student’s t-test to determine the level of evidence for the observed differences in
                                                                                       numbers of contacts between students and the general population.
particular, our approach does not capture superspreaders and                              We used the SCS to estimate the contact rate between students by year and
contact tracing and isolation of contacts or living circles is diffi-                   school. For a student in school/year group i, we assumed that all study contacts
cult to include in detail. We capture some heterogeneity using                         were within the same group, i.e., sii ¼ s and sij ¼ 0, where s is the mean number of
household and faculty mixing data, and a stochastic model was                          university-associated contacts reported by students in the SCS. We assumed that
necessary due to the potentially small number of students in each                      non-study contacts occurred across the whole university. We took r ij ¼ r nj =N,
                                                                                       where r is the mean number of other/leisure contacts reported by students in the
subgroup. Nevertheless, a network modelling approach would be                          SCS and nj =N is the proportion of students in group j.
more appropriate for studying superspreading events and                                   We were provided with an anonymised extract of student data for a university
individual-level variation.                                                            relating to the 2019/2020 academic year. The study complied with the university
   Furthermore, while we had detailed data pertaining to the                           data-protection policy for research studies (http://www.bristol.ac.uk/media-library/
                                                                                       sites/secretary/documents/information-governance/data-protection-policy.pdf).
university student population, we had limited data on contact                             The data contained age, primary faculty affiliation (7 faculties), primary school
with the location population and we did not include university                         affiliation (28 schools), year of study (6 undergraduate years, taught postgraduates
staff explicitly in the model. Given the age distribution of stu-                      and research postgraduates), term-time residence, home region (if in the UK) and
dents, and the high likelihood of asymptomatic infection, staff                        country of origin for students registered in 2019/2020.
                                                                                          We used the university data to group students by school affiliation and year
and surrounding communities are likely to experience higher                            group—a total of 161 categories. We then estimate the household contact rate
levels of morbidity than the students themselves. Although by-                         between students in each school/year group. We estimated the number of house-
and-large students fraternise with students, they do pose some                         hold contacts from the student data, taking postcode as a proxy for household. The
risk to more vulnerable groups within the university such as staff                     average number of students in school/year group j sharing accommodation with a
                                                                                       student in group i is calculated as follows:
with co-morbidities, or to their local community. Reliable data on
staff student interactions were not available and should be                                                                                            ∑Pk¼1 nik njk
included in a future study. Safeguarding all is a high priority.                                                                               hij ¼
                                                                                                                                                        ∑Pk¼1 nik
   The aim of this work was to characterise potential COVID-19
transmission patterns in a university setting and identify strate-                     where nik is the number of students in school/year i living at unique postcode k and
gies that may prove more likely to control transmission. This                          P is the number of unique postcodes.
                                                                                          In UoB, students in university residences will be assigned to a living circle, which
work was provided to the Scientific Pandemic Influenza Group on                          is a group of students who have higher rates of contact. We take the baseline living
Modelling that provides modelling evidence to the UK                                   circle size as 24 students and investigate the impact of smaller living circles. Where

6                  NATURE COMMUNICATIONS | (2021)12:5017 | https://doi.org/10.1038/s41467-021-25169-3 | www.nature.com/naturecommunications
NATURE COMMUNICATIONS | https://doi.org/10.1038/s41467-021-25169-3 ARTICLE
the number of students at a single postcode exceeded the living circle size, we create period is taken as 1=γ ¼ 3 days23, although there is uncertainty around these
subunits within the postcode that are the size of the living circle. Each living circle values. Symptomatic individuals are tested and moved to self-isolation at a rate τ I .
contains a random sample of students at that address. See Supplementary Fig. S1 Asymptomatic cases are infectious for 1=γA ¼ 5 days, so that their average
for a pictorial explanation of how the data are processed. infectious period equals the infectious period for symptomatic cases. If asympto-
We use a stochastic compartmental model to simulate transmission dynamics in matic cases tested, they are moved to self-isolation at rate τ A where they remain for
the student population at UoB. We assumed that COVID-19 could be captured by an average of 14 days. Individuals in self-isolation contribute to the force-of-
seven infection states: susceptible to infection (S), latently infected (E), asympto- infection within their subgroup only at a reduced rate εQ ¼ 0:5.
matic and infectious (A), pre-symptomatic and infectious (P), symptomatic and The infectiousness of asymptomatic cases relative to symptomatic cases is
infectious (I), self-isolating (Q), hospitalised (H) and recovered and immune (R) represented by the parameter ε. It is accepted that asymptomatic transmission can
with the subscript i indicating the subgroup. The total number of students is given and does occur; however, its relative importance has been difficult to measure due
by N. The flow between compartments is depicted in Fig. 1 and given by the Eq. (1) to consistent case definitions, incomplete sampling and follow-up24. Apparent
below. asymptomatic transmission is often re-classified as pre-symptomatic transmission,
i.e., transmission that occurs in the days before symptom onset24–26. The house-
Si ðt þ 1Þ ¼ Si ðtÞ ΔSE hold secondary attack rate for truly asymptomatic index cases has been found to be
Ei ðt þ 1Þ ¼ Ei ðtÞ þ ΔSE ΔE lower than for symptomatic index cases24,26–30. A systematic review of 45 studies
found that the secondary attack rate for asymptomatic index cases was 60% lower
Ai ðt þ 1Þ ¼ Ai ðtÞ þ ΔEA ΔA
than for symptomatic index cases29. A different analysis of serological data from
Pi ðt þ 1Þ ¼ Pi ðtÞ þ ΔE ΔEA ΔP ð1Þ Switzerland found that asymptomatic cases had a 70% lower odds (34–88%) of
I i ðt þ 1Þ ¼ I i ðtÞ þ ΔPI ΔI infecting another household member compared to cases with symptoms30. Another
modelling study of contact tracing estimated that transmission due to truly
Ri ðt þ 1Þ ¼ Ri ðtÞ þ ΔAR þ ΔIR þ ΔQR
asymptomatic cases was limited, with pre-symptomatic and symptomatic trans-
Qi ðt þ 1Þ ¼ Qi ðtÞ þ ΔA ΔAR þ ΔI ΔIR þ ΔP ΔPI ΔQR mission contributing the remainder in approximately equal proportions31.
In summary, it appears that truly asymptomatic cases are less infectious than
The transitions are given by: symptomatic cases. In order to capture the reduced infectiousness of asymptomatic
n
cases, while acknowledging that students may report non-typical system, we take a
ΔSE Bin Si ; 1 expðb ∑ βij ðI j þ Pj þ εAj þ δ ij εQ Qj Þ=N j Þ baseline value for the relative infectiousness of asymptomatic cases, ε, of 0.5 and
j¼1
also consider a value of 0.3, and the full range of values in the Supplementary
ΔE BinðEi ; 1 expðσÞÞ Note 4. We assume that pre-symptomatic and symptomatic cases are equally
ΔEA BinðΔE ; 1 expðf ÞÞ infectious32.
We assume the transmission rate between group i and group j, βij , is propor-
ΔA BinðAi ; 1 expðγA τ A ÞÞ tional to the contact rate cij , where cij is the average number of contacts in group j
ΔAR BinðΔA ; 1 expðγA =ðγA þ τ A ÞÞÞ ð2Þ made by a person in group i. We assume that contacts were either household
ΔP BinðPi ; 1 expðγP τ A ÞÞ contacts (hij ), study contacts ðsij Þ or random contacts (r ij ), so each entry in the
contact matrix is given by cij ¼ hij þ sij þ r ij . In this formulation, we assume an
ΔPI Bin ΔP ; 1 expðγP =ðγP þ τ A ÞÞ equal probability of transmission by contact type. In order to translate the contact
ΔI BinðI i ; 1 expðγI τ I ÞÞ matrix into the transmission matrix, we calculate a constant k such that the
ΔIR BinðΔI ; 1 expðγI =ðγI þ τ I ÞÞÞ maximum eigenvalue of the transmission matrix B ¼ fβij g ¼ fkcij g equals the
reproduction number33. There is an additional background rate of infection,
ΔQR BinðQi ; 1 expðγQ ÞÞ governed by the parameter b.
All state and transition variables are time dependent, although we have dropped To estimate the reproduction number in the student population, we took a
ðt Þ for convenience. population-wide reproduction number of R0 ¼ 2:7, calculated as follows. In our
The student population was divided into 161 groups representing school and framework, if a symptomatic case generates Rs secondary cases, then an asymp-
year of study. The proportion of students in each group and the mixing between RA ¼ εRS secondary cases. With R0 ¼ RS þ RA ,
tomatic case will generate
groups was taken from the mixing matrix in Fig. 2. As 92% of the student Rs ¼ R0 = f þ 1 f ε . If cases without symptoms are 50% as infectious as cases
population is under 30 years of age, we expect a high proportion of cases to be with symptoms ðε ¼ 0:5Þ, and a fraction f ¼ 0:6 of the general population has
asymptomatic19,20 ðf ¼ 0:75Þ. In a survey of university students, a large range of symptoms when infected, then in a university setting when a lower proportion of
symptoms were reported in participants who tested positive for COVID-19, sug- cases have symptoms ðf ¼ 0:25Þ but have on average 10% more contacts than an
gesting that young adults may have symptoms, but not typical ones21. We also average person, we would expect a reproduction number within university of
expect a low hospitalisation rate22 (h ¼ 0:002) and a low mortality rate of hospi- RU ¼ 2:7. If ε ¼ 0:1 then RU ¼ 1:7; if ε ¼ 1 then RU ¼ 3:4 (see Supplementary
talised cases (μ ¼ 0:038)22 and have therefore not modelled hospitalisation and Note 3 and Supplementary Fig. S3).
death here. For the initial conditions, we assumed that 0.2% of incoming students had active
For symptomatic cases, we assume an average incubation period, during which asymptomatic or pre-symptomatic infections, which we assigned randomly across
cases are assumed not to be infectious and cannot be detected by the test, of the year/faculty groups. For each scenario, we ran the model 100 times using a
1=σ ¼ 3 days23, after which they become infectious but pre-symptomatic for a different random seed. The model was simulated for 1 year to illustrate the full
period of 1=γP ¼ 2 days, when cases can be detected with a test. The infectious range of dynamics, and we consider the state of the outbreak after 84 days, which is
Table 1 Baseline model parameter values, meaning and sources.
Parameter Symbol Value/Range References
Number of household contacts between subgroups hij Estimated from accommodation data
Number of study contacts between subgroups sij 20.0 (SD: 4.0) 3,17
Number of university-wide contacts between subgroups rij 4.3 (SD: 1.0) 3,17
Basic reproduction number in the UK R0 2.7 18,38
Transmission probability per contact per day β Estimated from reproduction number
Proportion of cases with no symptoms f 0.75 19,20
Average infectious period 1=γ 3 days 23,35
Average incubation period 1=σ 3 days 23,35
Average pre-symptomatic period 1=γP 2 days 23,35
Average infectious period for asymptomatic case 1=γA 1=γP þ 1=γ
Average time to test for symptomatic cases 1=τ I 2 days 35
Average time to test for asymptomatic cases 1=τ A Asymptomatic cases not tested in baseline model
Length of time in self-isolation 1=γQ 14 days
Relative infectiousness of asymptomatic cases compared to ε 0.5 (0.3–0.7) 24,26–30
symptomatic cases
Reduction in infectiousness whilst in self-isolation εQ 0.5 Assumption
Background rate of infection b – Assumption
NATURE COMMUNICATIONS | (2021)12:5017 | https://doi.org/10.1038/s41467-021-25169-3 | www.nature.com/naturecommunications 7ARTICLE NATURE COMMUNICATIONS | https://doi.org/10.1038/s41467-021-25169-3
the number of days between the start of the September term and the winter
holidays at the end of the first term. For numerical results, we report the mean and
rates are increasing
Every 2 days when
Every 2 or 7 days
98% PI from 100 simulations. The model code is available at https://github.com/
when rates are
ellen-is/unimodel34.
Asymptomatic
For the main results reported in the paper, we ran the model with baseline
increasing
parameters for 100 realisations, drawing from distributions indicated in Table 1
testing
and report the 98% PI calculated directly from the 1st and 100th order statistic. To
None
None
None
None
None
understand the variability further, we run 100 further realisations of the model
varying all baseline parameters independently by ±10%, and report those results in
the Supplementary information.
The impact of the infectiousness of asymptomatic cases was explored for values
of ε between 0 (asymptomatic cases not infectious) and 1 (asymptomatic cases as
infectious as symptomatic cases), which corresponds to reproduction numbers
ranging from 1.7 to 3.4 (see Supplementary Note 2).
% transmission reduction
We assumed that symptomatic cases would be tested and self-isolate within 48 h,
within/between groups
which is consistent with the median time between symptom onset and test of
2 days in the UK35. Contact tracing is difficult to implement explicitly in the
due to self-isolation
compartmental model framework, but the mechanism of action can be captured by
a lower within-group transmission rate. We focussed on interventions that could be
implemented on top of wider control measures and were guided on feasibility by
the UoB Scientific Advisory Group. We considered the following pragmatic
100/100
interventions, limited by feasibility (see Table 2 for a summary):
50/100
50/100
50/100
50/100
50/100
50/100
● Baseline conditions are ‘business as usual’ behaviour within universities with
PHE guidelines. Symptomatic cases are tested are moved into self-isolation
after an average of 48 h if test positive. No additional testing for people with
no symptoms. Students are assumed to be in living circles that comprise of a
maximum of 24 individuals to reflect existing UoB arrangements.
● COVID security represents the reduction in transmission associated with
social distancing and the use of face coverings36,37. We modelled COVID
security by reducing the transmission probability associated with non-
Max living
circle size
20 or 14
household contacts by 25 and 50% to capture the impact of face covering
use and social distancing outside of residences.
● Reduced face-to-face teaching is captured by reducing the number of face-
24
24
24
24
24
14
to-face teaching contacts by 25 and 75% from 20 students to 15 and then
5 students.
● Reduced living circles reflects reducing the number of students sharing
facilities within accommodation. In the baseline scenario, we assumed that
students were in contact with other students living in the same
accommodation, forming household groups up to a maximum of 24
contacts (SD =
within-course
individuals. For accommodation with more than 24 residents, we divided
Mean no. of
the accommodation population up into subunit ‘living circles’ of
Table 2 Intervention scenarios for controlling transmission within university settings.
24 students. To explore the impact of living circle size, we reduced the 15 or 5
maximum living circle size from 24 to 20 and then 14 persons.
●
20b
20b
20b
20b
20b
Reactive mass testing: we simulate scenarios in which all students are tested
4)
5
for the presence of current infection if the number of test-positive cases in a
given week is greater than the previous week. If mass testing is triggered in
the model, all students are tested within a given number of days, which is
varied between 2 and 7 days. Additional testing is continued until the
number of test-positive cases in a given week is less than the previous week.
● Multiple, layered interventions: we investigated the impact of each of the
contacts (SD
above interventions in isolation and then applied sequentially: 25%
Mean no. of
reduction in transmission due to COVID security, followed by a reduction
in face-to-face teaching to ten study contacts, followed by a reduction in
random
living circles to 24 individuals, and reactive mass testing every 2 days if the
= 1)
infection rate on campus should rise, and finally a reduction in importation
4b
4b
4b
4b
4b
4b
4b
rates from outside the university population.
For each model realisation we calculated (a) the doubling time during the
exponential growth phase as lnð2Þ=r, where r is the exponential growth rate in the
number of infected individuals, (b) the incident number of symptomatic and
asymptomatic cases at the end of the first term (day 84 of the model), (c) the time
probability per contact
the outbreak turns over, (d) the number of students in self-isolation and (e) the
0.05a/0.04 or 0.025
ratio of asymptomatic to symptomatic cases.
household/other
We ranked the interventions when implemented without additional measures by
mean number of symptomatic cases at the end of the first term calculated from 100
Transmission
0.05a/0.05a
0.05a/0.05a
0.05a/0.05a
0.05a/0.05a
realisations of the model for a given set of parameters and repeated this ranking for
0.05a/0.04
values of ε between 0 (asymptomatic cases not infectious) and 1 (asymptomatic
per day
cases as infectious as symptomatic cases).
Survey.
0.05a
Reporting summary. Further information on research design is available in the Nature
bEstimated from the Social Contact
Research Reporting Summary linked to this article.
aCalculated such that R = 2.7.
Data availability
The Social Contact Survey data used in this study are available at http://wrap.warwick.ac.
Improved self-
Reduced living
Reactive mass
Reduced face-
uk/54273/. The raw UoB student data are protected and are not available due to data
circle size
privacy laws. The aggregated UoB student contact matrices are available to download at
Scenario
teaching
isolation
Multiple
Baseline
security
https://github.com/ellen-is/unimodel/34.
COVID
to-face
testing
8 NATURE COMMUNICATIONS | (2021)12:5017 | https://doi.org/10.1038/s41467-021-25169-3 | www.nature.com/naturecommunicationsNATURE COMMUNICATIONS | https://doi.org/10.1038/s41467-021-25169-3 ARTICLE
Code availability 24. Meyerowitz, E. A., Richterman, A., Bogoch, I. I., Low, N. & Cevik, M. Towards
The model was coded using R version 4.0.02 (2020-06-22). Model code for reproducing an accurate and systematic characterisation of persistently asymptomatic
epidemic trajectories and other outputs is available at https://github.com/ellen-is/ infection with SARS-CoV-2. Lancet. Infect. Dis. 21, e163–e169 https://doi.org/
unimodel/34. 10.1016/S1473-3099(20)30837-9 (2021).
25. Huff, H. V & Singh, A. Asymptomatic transmission during the coronavirus
disease 2019 pandemic and implications for public health strategies. Clin.
Received: 20 September 2020; Accepted: 21 July 2021; Infect. Dis. 71, 2752–2756 https://doi.org/10.1093/cid/ciaa654 (2020).
26. Buitrago-Garcia, D. et al. Occurrence and transmission potential of
asymptomatic and presymptomatic SARS-CoV-2 infections: a living
systematic review and meta-analysis. PLoS Med. 17, e1003346 (2020).
27. Fung, H. F. et al. The household secondary attack rate of severe acute
respiratory syndrome coronavirus 2 (SARS-CoV-2): a rapid review. Clin.
References Infect. Dis. https://doi.org/10.1093/cid/ciaa1558 (2020).
1. Universities UK. Patterns and Trends in UK Higher Education. In Focus: 28. Chaw, L. et al. Analysis of SARS-CoV-2 transmission in different settings,
Universities UK. http://www.universitiesuk.ac.uk/highereducation/ Brunei. Emerg. Infect. Dis. 26, 2598–2606 (2020).
Documents/2013/PatternsAndTrendsinUKHigherEducation2013.pdf (2018). 29. Thompson, H. A. et al. Report 38: SARS-CoV-2 setting-specific transmission
2. Higher Education Statistics Agency. Full-time and Sandwich Students by rates: a systematic review and meta-analysis. Imperial College London https://
Term-time Accommodation 2014/15 to 2018/19. https://www.hesa.ac.uk/data- doi.org/10.25561/84270 (2020).
and-analysis/students/chart-4 (2019). 30. Bi, Q. et al. Insights into household transmission of SARS-COV-2 from a
3. Danon, L., Read, J. M., House, T. A., Vernon, M. C. & Keeling, M. J. Social population-based serological survey. Nature Communcations. 12, 3643.
encounter networks: characterizing Great Britain. Proc. Biol. Sci. 280, https://doi.org/10.1038/s41467-021-23733-5 (2021).
20131037 (2013). 31. Ferretti, L. et al. Quantifying SARS-CoV-2 transmission suggests epidemic
4. Sinha, I. P. et al. COVID-19 infection in children. Lancet Respir. Med. 8, control with digital contact tracing. Science 368, eabb6936. https://doi.org/
446–447 (2020). 10.1126/science.abb6936 (2020).
5. Paltiel, A. D., Zheng, A. & Walensky, R. P. Assessment of SARS-CoV-2 32. Lipman, M. & White, J. Collaborative tuberculosis strategy for England. BMJ
screening strategies to permit the safe reopening of college campuses in the 350, h810 (2015).
United States. JAMA Netw. Open 3, e2016818 (2020). 33. Hens, N. et al. Mining social mixing patterns for infectious disease models
6. Christensen, H. et al. COVID-19 transmission in a university setting: a rapid based on a two-day population survey in Belgium. BMC Infect. Dis. 9, 5
review of modelling studies. medRxiv 2020.09.07.20189688. https://doi.org/ (2009).
10.1101/2020.09.07.20189688 (2020). 34. Brooks-Pollock, E. Stochastic transmission model of COVID-19 in a
7. Kujawski, S. A. et al. Outbreaks of adenovirus-associated respiratory illness on university setting v1.0.0. https://doi.org/10.5281/zenodo.4759117 (2021).
5 college campuses in the United States, 2018–2019. Clin. Infect. Dis. 72, 35. Challen, R., Brooks-Pollock, E., Tsaneva-Atanasova, K. & Danon, L. Meta-
1992–1999 https://doi.org/10.1093/cid/ciaa465 (2021). analysis of the SARS-CoV-2 serial interval and the impact of parameter
8. Borowiak, M. et al. Controlling the spread of COVID-19 on college campuses. uncertainty on the COVID-19 reproduction number. medRxiv
Math. Biosci. Eng. 18, 551–563 (2020). 2020.11.17.20231548. https://doi.org/10.1101/2020.11.17.20231548 (2020).
9. Virtual Forum for Knowledge Exchange in the Mathematical Sciences (V- 36. Howard, J. et al. An evidence review of face masks against COVID-19.
KEMS). Unlocking Higher Education Spaces – What Might Mathematics Tell Proceedings of the National Academy of Sciences of the United States of
Us? https://gateway.newton.ac.uk/sites/default/files/asset/doc/2007/Unlocking America, 118, e2014564118 https://doi.org/10.1073/pnas.2014564118 (2021).
%20HE%20Spaces%20July%202020_small_0.pdf (2020). 37. Chu, D. K. et al. Physical distancing, face masks, and eye protection to prevent
10. Vusirikala, A. et al. Seroprevalence of SARS-CoV-2 antibodies in university person-to-person transmission of SARS-CoV-2 and COVID-19: a systematic
students: cross-sectional study, December 2020, England. J. Infect. 83, 104–111 review and meta-analysis. Lancet 395, 1973–1987 (2020).
(2021). 38. Challen, R. J. et al. Estimates of regional infectivity of COVID-19 in the
11. Gilmore, A., Jones, G., Barker, M., Soltanpoor, N. & Stuart, J. M. United Kingdom following imposition of social distancing measures. Phil.
Meningococcal disease at the University of Southampton: outbreak Trans. R. Soc. B 376: 20200280 https://doi.org/10.1098/rstb.2020.0280 (2021).
investigation. Epidemiol. Infect. 123, 185–192 (1999).
12. Kay, D., Roche, M., Atkinson, J., Lamden, K. & Vivancos, R. Mumps
outbreaks in four universities in the North West of England: prevention,
detection and response. Vaccine 29, 3883–3887 (2011). Acknowledgements
13. Bhatta, M. R. et al. Norovirus outbreaks on college and university campuses. Thanks to TJ McKinley for advice in developing the code. Thanks also to the three
J. Am. Coll. Heal. 68, 688–697 https://doi.org/10.1080/07448481.2019.1594826 reviewers whose comments improved the manuscript. We thank the University of Bristol
(2020). for providing the data and the University of Bristol Scientific Advisory Group for sup-
14. White, C. et al. The effect of hand hygiene on illness rate among students in port. E. B.-P. and L. D. are supported by Medical Research Council (MRC) (MC/PC/
university residence halls. Am. J. Infect. Control 31, 364–370 (2003). 19067), and L. D. is supported by EPSRC EP/V051555/1 and The Alan Turing Institute
15. Moe, C. L., Christmas, W. A., Echols, L. J. & Miller, S. E. Outbreaks of acute EPSRC EP/N510129/1. E. B.-P., H. C., E. N. and L. D. are funded via the JUNIPER
gastroenteritis associated with norwalk-like viruses in campus settings. J. Am. Consortium (MR/V038613/1). A. C. T. is funded by the Wellcome Trust (217509/Z/19/
Coll. Health Assoc. 50, 57–66 (2001). Z) and the MRC (MR/V028545/1). E. B.-P., H. C., K. T. and M. H. acknowledge support
16. Scientific Advisory Group for Emergencies (SAGE). Principles for Managing from the NIHR Health Protection Research Unit in Behavioural Science and Evaluation
SARS-CoV-2 Transmission Associated with Further Education. https://www. at the University of Bristol. The Health Protection Research Unit (HPRU) in Behavioural
gov.uk/government/publications/actions-for-he-providers-during-the- Science and Evaluation at University of Bristol is part of the National Institute for Health
coronavirus-outbreak (2020). Research (NIHR) and a partnership between University of Bristol and Public Health
17. Danon, L., House, T. A., Read, J. M. & Keeling, M. J. Social encounter England (PHE), in collaboration with the MRC Biostatistics Unit at University of
networks: collective properties and disease transmission. J. R. Soc. Interface 9, Cambridge and University of the West of England. We are a multidisciplinary team
2826–2833 (2012). undertaking applied research on the development and evaluation of interventions to
18. Brooks-Pollock, E., Read, J. M., McLean, A., Keeling, M. J. & Danon, L. protect the public’s health. Our aim is to support PHE in delivering its objectives and
Mapping social distancing measures to the reproduction number for COVID- functions. Follow us on Twitter: @HPRU_BSE.
19. Phil. Trans. R. Soc. B. 376, 20200276 https://doi.org/10.1098/
rstb.2020.0276 (2021).
19. Davies, N. G. et al. Age-dependent effects in the transmission and control of
COVID-19 epidemics. Nat. Med. 26, 1205–1211 https://doi.org/10.1038/ Author contributions
s41591-020-0962-9 (2020). E.B.-P. conceived the study, developed and ran the model and wrote the first draft of the
20. Poletti, P. et al. Probability of symptoms and critical disease after SARS-CoV-2 paper. L.D. developed the data processing code. E.B.-P., H.C., L.D. and C.R. designed the
infection. arXiv.org https://arxiv.org/abs/2006.08471v2. (2020). study. E.B.-P., H.C., L.D., A.T., A.C.T., G.H., K.T., A.F., M.H., E.N. and C.R. interpreted
21. Nixon, E. et al. Contacts and behaviours of university students during the the results. E.B.-P., H.C., L.D., A.T., A.C.T., G.H., K.T., A.F., M.H., E.N. and C.R. wrote
COVID-19 pandemic at the start of the 2020/21 academic year. Sci Rep 11, and revised the paper.
11728 https://doi.org/10.1038/s41598-021-91156-9 (2021).
22. Dorigatti, I. et al. Report 4: Severity of 2019-novel coronavirus (nCoV).
Imperial College London https://doi.org/10.25561/77154 (2020).
23. Li, Q. et al. Early transmission dynamics in Wuhan, China, of novel Competing interests
coronavirus-infected pneumonia. N. Engl. J. Med. 382, 1199–1207 (2020). The authors declare no competing interests.
NATURE COMMUNICATIONS | (2021)12:5017 | https://doi.org/10.1038/s41467-021-25169-3 | www.nature.com/naturecommunications 9You can also read