High-quality carnivoran genomes from roadkill samples enable comparative species delineation in aardwolf and bat-eared fox - eLife
←
→
Page content transcription
If your browser does not render page correctly, please read the page content below
RESEARCH ARTICLE

                                    High-quality carnivoran genomes from
                                    roadkill samples enable comparative
                                    species delineation in aardwolf and bat-
                                    eared fox
                                    Rémi Allio1*, Marie-Ka Tilak1, Celine Scornavacca1, Nico L Avenant2,
                                    Andrew C Kitchener3, Erwan Corre4, Benoit Nabholz1,5, Frédéric Delsuc1*
                                    1
                                     Institut des Sciences de l’Evolution de Montpellier (ISEM), CNRS, IRD, EPHE,
                                    Université de Montpellier, Montpellier, France; 2National Museum and Centre for
                                    Environmental Management, University of the Free State, Bloemfontein, South
                                    Africa; 3Department of Natural Sciences, National Museums Scotland, Edinburgh,
                                    United Kingdom; 4CNRS, Sorbonne Université, CNRS, ABiMS, Station Biologique de
                                    Roscoff, Roscoff, France; 5Institut Universitaire de France (IUF), Paris, France

                                    Abstract In a context of ongoing biodiversity erosion, obtaining genomic resources from wildlife
                                    is essential for conservation. The thousands of yearly mammalian roadkill provide a useful source
                                    material for genomic surveys. To illustrate the potential of this underexploited resource, we used
                                    roadkill samples to study the genomic diversity of the bat-eared fox (Otocyon megalotis) and the
                                    aardwolf (Proteles cristatus), both having subspecies with similar disjunct distributions in Eastern
                                    and Southern Africa. First, we obtained reference genomes with high contiguity and gene
                                    completeness by combining Nanopore long reads and Illumina short reads. Then, we showed that
                                    the two subspecies of aardwolf might warrant species status (P. cristatus and P. septentrionalis) by
                                    comparing their genome-wide genetic differentiation to pairs of well-defined species across
*For correspondence:
rem.allio@yahoo.fr (RA);
                                    Carnivora with a new Genetic Differentiation index (GDI) based on only a few resequenced
frederic.delsuc@umontpellier.fr     individuals. Finally, we obtained a genome-scale Carnivora phylogeny including the new aardwolf
(FD)                                species.

Competing interests: The
authors declare that no
competing interests exist.
                                    Introduction
Funding: See page 23                In the context of worldwide erosion of biodiversity, obtaining large-scale genomic resources from
Received: 16 September 2020         wildlife is essential for biodiversity assessment and species conservation. An underexploited, but
Accepted: 16 February 2021          potentially useful, source of material for genomics is the many thousands of annual wildlife fatalities
Published: 18 February 2021         due to collisions with cars. In particular, mammalian roadkill is unfortunately so frequent that several
                                    citizen-science surveys have been implemented on this subject in recent decades (Périquet et al.,
Reviewing editor: George H
Perry, Pennsylvania State
                                    2018; Shilling and Perkins, 2015). For example, in South Africa alone, over 12,000 wildlife road
University, United States           mortality incidents were recorded by The Endangered Wildlife Trust’s "Wildlife and Roads Project"
                                    from 1949 to 2017 (Endangered Wildlife Trust 2017). Initially developed to measure the impact of
   Copyright Allio et al. This
                                    roads on wildlife, these web-based systems highlight the numbers of car-wildlife collisions. The pos-
article is distributed under the
                                    sibility of retrieving DNA from roadkill tissue samples (Etherington et al., 2020; Maigret, 2019)
terms of the Creative Commons
Attribution License, which          could provide new opportunities in genomics by giving access not only to a large number of speci-
permits unrestricted use and        mens of commonly encountered species, but also to more elusive and endangered species that
redistribution provided that the    might be difficult to sample otherwise.
original author and source are          Recent advances in the development of high-throughput sequencing technologies have made the
credited.                           sequencing of hundreds or thousands of genetic loci cost-efficient and have offered the possibility

Allio et al. eLife 2021;10:e63167. DOI: https://doi.org/10.7554/eLife.63167                                                          1 of 39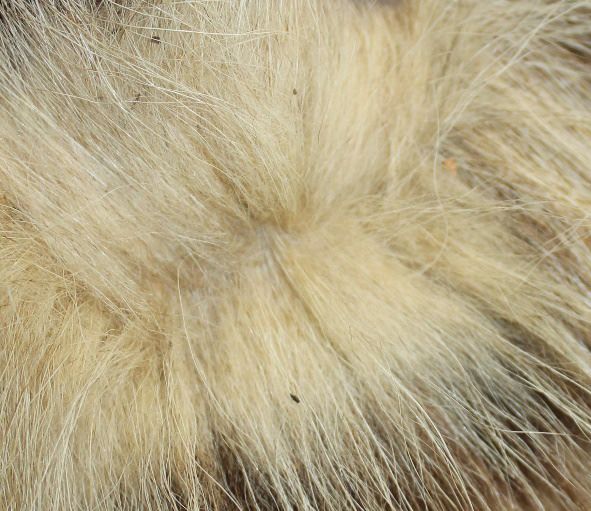
Research article                                                                     Evolutionary Biology Genetics and Genomics

                                    of using ethanol-preserved tissues, old DNA extracts, and museum specimens (Blaimer et al., 2016;
                                    Guschanski et al., 2013). In the meantime, third-generation long-read sequencing technologies,
                                    such as Pacific Biosciences (PacBio) and Oxford Nanopore Technologies (ONT) sequencing, have
                                    increased the sizes of the sequenced molecules from several kilobases to several megabases. The
                                    relatively high level of sequencing errors (10–15%) associated with these technologies can be com-
                                    pensated by sequencing at a high depth-of-coverage to avoid sequencing errors in de novo genome
                                    assembly and thus obtain reference genomes with high base accuracy, contiguity, and completeness
                                    (Koren et al., 2017; Shafin et al., 2020; Vaser et al., 2017). Originally designed to allow direct
                                    sequencing of DNA molecules with simplified library preparation procedures, ONT instruments, such
                                    as the MinION (Jain et al., 2016), have been co-opted as a portable sequencing method in the field
                                    that proved useful in a diversity of environmental conditions (Blanco et al., 2019; Parker et al.,
                                    2017; Pomerantz et al., 2018; Srivathsan et al., 2018). This approach is particularly suitable for
                                    sequencing roadkill specimens, for which it is notoriously difficult to obtain a large amount of high-
                                    quality DNA because of postmortem DNA degradation processes in high ambient environmental
                                    temperatures. Furthermore, it is possible to correct errors in ONT long reads by combining them
                                    with Illumina short reads, either to polish de novo long-read-based genome assemblies (Batra et al.,
                                    2019; Jain et al., 2018; Nicholls et al., 2019; Walker et al., 2014) or to construct hybrid assemblies
                                    (Di Genova et al., 2018; Gan et al., 2019; Tan et al., 2018; Zimin et al., 2013). In hybrid assembly
                                    approaches, the accuracy of short reads with high depth-of-coverage (50–100x) allows the use of
                                    long reads at lower depths of coverage (10–30x) essentially for scaffolding (Armstrong et al., 2020;
                                    Kwan et al., 2019). A promising hybrid assembly approach, combining short- and long-read
                                    sequencing data has been implemented in MaSuRCA software (Zimin et al., 2017; Zimin et al.,
                                    2013). This approach consists of transforming large numbers of short reads into a much smaller
                                    number of longer highly accurate ‘super reads’, allowing the use of a mixture of read lengths. Fur-
                                    thermore, this method is designed to tolerate a significant level of sequencing error. Initially devel-
                                    oped to address short reads from Sanger sequencing and longer reads from 454 Life Sciences
                                    instruments, this method has already shown promising results for combining Illumina and ONT/Pac-
                                    Bio sequencing data in several taxonomic groups, such as plants (Scott et al., 2020; Wang et al.,
                                    2019; Zimin et al., 2017), birds (Gan et al., 2019), and fishes (Jiang et al., 2019;
                                    Kadobianskyi et al., 2019; Tan et al., 2018), but not yet in mammals.
                                        Here, we studied two of the most frequently encountered mammalian roadkill species in South
                                    Africa (Périquet et al., 2018): the bat-eared fox (Otocyon megalotis, Canidae) and the aardwolf
                                    (Proteles cristatus, Hyaenidae). These two species are among several African vertebrate taxa
                                    presenting disjunct distributions between Southern and Eastern Africa that are separated by more
                                    than a thousand kilometres (e.g. ostrich, Miller et al., 2011; ungulates, Lorenzen et al., 2012).
                                    Diverse biogeographical scenarios, involving the survival and divergence of populations in isolated
                                    savanna refugia during the climatic oscillations of the Pleistocene, have been proposed to explain
                                    these disjunct distributions in ungulates (Lorenzen et al., 2012). Among the Carnivora, subspecies
                                    have been defined based on this peculiar allopatric distribution not only for the black-backed jackal
                                    (Lupulella mesomelas; Walton and Joly, 2003) but also for both the bat-eared fox (Clark, 2005) and
                                    the aardwolf (Koehler and Richardson, 1990; Figure 1). The bat-eared fox is divided into the South-
                                    ern bat-eared fox (O. megalotis megalotis) and the Eastern bat-eared fox (O. megalotis virgatus)
                                    (Clark, 2005), and the aardwolf is divided into the Southern aardwolf (P. cristatus cristatus) and the
                                    Eastern aardwolf (P. cristatus septentrionalis) (Koehler and Richardson, 1990). However, despite
                                    known differences in behaviour between the subspecies of both species groups (Wilson et al.,
                                    2009), no genetic or genomic assessment of population differentiation has been conducted to date.
                                    In other taxa, similar allopatric distributions have led to genetic differences between populations
                                    and several studies reported substantial intraspecific genetic structuration between Eastern and
                                    Southern populations (Atickem et al., 2018; Barnett et al., 2006; Dehghani et al., 2008;
                                    Lorenzen et al., 2012; Miller et al., 2011; Rohland et al., 2005). Here, with a novel approach based
                                    on a few individuals, we investigate whether significant genetic structuration and population differ-
                                    entiation have occurred between subspecies of bat-eared fox and aardwolf using whole genome
                                    data.
                                        To evaluate the taxonomic status of the proposed subspecies within both O. megalotis and P.
                                    cristatus, we first sequenced and assembled two reference genomes from roadkill samples by com-
                                    bining ONT long reads and Illumina short reads using the MaSuRCA hybrid assembler. The quality

Allio et al. eLife 2021;10:e63167. DOI: https://doi.org/10.7554/eLife.63167                                                         2 of 39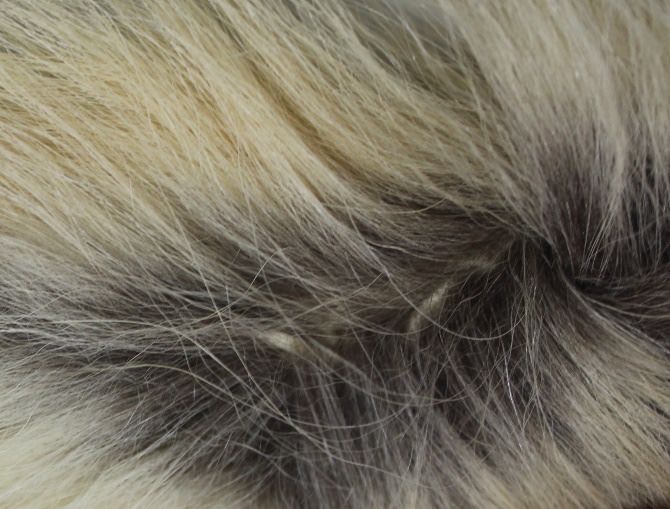
Research article                                                                                Evolutionary Biology Genetics and Genomics

                                                               0"#1"#                                                                     !"#$"#
                                                          ,-2*-3*'&/3).&,#                                                               %&'()*+,#

          ,"&'-*.)(                                                                   !"#$%"&%'()*+(

                              0"#1"#                                                                    !"#$"#
                           1'&,*)*+,#                                                                  $-()./*&,#

Figure 1. Disjunct distributions of the aardwolf (Proteles cristatus) and the bat-eared fox (Otocyon megalotis) in Eastern and Southern Africa. Within
each species, two subspecies have been recognized based on their distributions and morphological differences (Clark, 2005; Koehler and
Richardson, 1990). Picture credits: Southern aardwolf (P. cristatus cristatus) copyright Dominik Käuferle; Southern bat-eared fox (O. megalotis
megalotis) copyright Derek Keats.

                                        of our genome assemblies was assessed by comparison to available mammalian genome assemblies.
                                        Then, to estimate the genetic diversity of these species and to perform comparative genome-scale
                                        species delineation analyses, two additional individuals from the disjunct South African and Tanza-
                                        nian populations of both species were resequenced at high depth-of-coverage using Illumina short
                                        reads. Using these additional individuals, we estimated the genetic diversity and differentiation of
                                        each subspecies pair via an FST-like measure, which we called the genetic differentiation
                                        index (GDI), and compared the results with the genetic differentiation among pairs of well-estab-
                                        lished carnivoran sister species. Based on measures of genetic differentiation, we found that the two
                                        subspecies of P. cristatus warrant separate species status, whereas the subspecies of O. megalotis
                                        do not show such differentiation. Our results show that high-quality reference mammalian genomes
                                        could be obtained through a combination of short- and long-read sequencing methods providing
                                        opportunities for large-scale population genomic studies of mammalian wildlife using (re)sequencing
                                        of samples collected from roadkill.

                                        Results
                                        Mitochondrial diversity within the Carnivora
                                        The first dataset, composed of complete carnivoran mitogenomes available in GenBank combined
                                        with the newly generated sequences of the two subspecies of P. cristatus, the two subspecies of O.
                                        megalotis, Parahyaena brunnea, Speothos venaticus and Vulpes vulpes, plus the sequences
                                        extracted from Ultra Conserved Elements (UCE) libraries for Bdeogale nigripes, Fossa fossana, and
                                        Viverra tangalunga (see Materials and methods for more details), comprised 142 species or subspe-
                                        cies representing all families of Carnivora. Maximum likelihood (ML) analyses reconstructed a robust
                                        mitogenomic phylogeny, with 91.4% of the nodes (128 out of 140) recovered with bootstrap support
                                        higher than 95% (Figure 2a). The patristic distances, extracted from the phylogenetic tree inferred
                                        with complete mitogenomes between the allopatric subspecies of aardwolf and bat-eared fox, were
                                        0.045 and 0.020 substitutions per site, respectively (Supplementary file 1). These genetic distances

Allio et al. eLife 2021;10:e63167. DOI: https://doi.org/10.7554/eLife.63167                                                                          3 of 39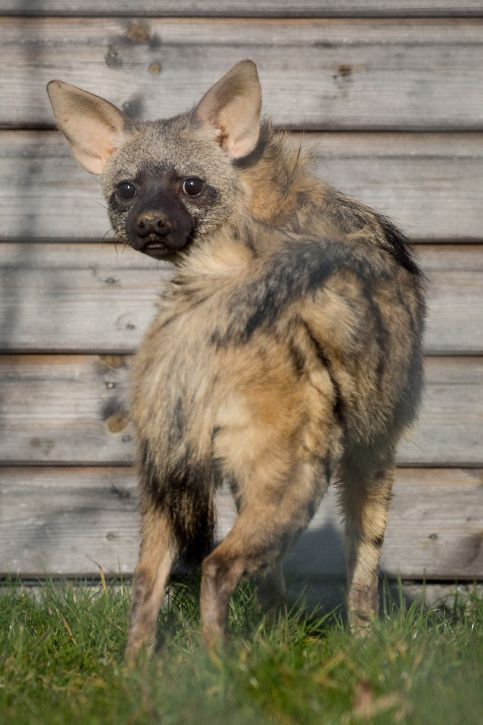
Research article                                                                                                                                           Evolutionary Biology Genetics and Genomics

                !"#$%&'()*'+%,#-./0'()*/#
                                                                 7,$#.(),?,$#",(
                                                                                            A,$2#$#,(+#$%-,-,(
                                                                                                               D,:*3,(/,0?,-,(
                                                                                                                     D,0,2%'*0*.(5403,150%2#-*.(
                                                                                                        B4$4--,(.40?,/#$,(
                                                                                                           I#?400#"*/,(#$2#",(
                                                                                                            ;#?4--#"-#.("#?4--,(
                                                                                                           I#?400,(-,$:,/*$:,(
                                                                                                                       M24%:,/4($#:0#14.(
                                                                                                                        80?,(),?,$#",(
                                                                                                           P%..,(9%..,$,(
                                                                                                               7*$:%-#"-#.(24"43/#$4,-,(
                                                                                                                        D0%-4/4.("0#.-,-*.("0#.-,-*.(A7MLNKUL(
                                                                                                                         D0%-4/4.("0#.-,-*.(.41-4$-0#%$,/#.(A7$5&20,(/*-0#.(
                                                                                                                                     !3+/%$&'("#$404*.(
                        45',/'*%6!)#                                                                                                  =*-0%:,/4(140.1#"#//,-,(
                                                                                                                                  =*-0,(/*-0,(
                                                                                                                                 =*-0,(.*3,-0,$,(
                        $C1&)0%6!)#                                                                                                7*.-4/,(904$,-,(
                                                                                                                                     A4%?#.%$(?#.%$(
                                                                                                                                       7*.-4/,(@,-5#,5(
                                                                                                                                 7*.-4/,(403#$4,(
                                                                                                                                       7*.-4/,(,/-,#",(
                        >''&1&5!-#1C--'5&1#S#B?#                                                                                       7*.-4/,($#?,/#.(
                                                                                                                                      7*.-4/,(#-,-.#(
                                                                                                                                       7*.-4/,(.#+#0#",(
                                                                                                                                       7*.-4/,($#:0#14.(
                                                                                                                                       7*.-4/,(4?40.3,$##(
                                                                                                                                       7*.-4/,(1*-%0#*.(

   3"#4!&5%1&%,#6%1&!*,)1#7'5#89:;#!*6#8#()*)1#

                                                        89:;#
   P5)TC)*,/#

                                                                                                           P5)TC)*,/#

                                                   IFAB#%*6%H%6C!01#                                                                                8#
                                                                                                                                               F;AG#%*6%H%6C!01#

                 0.00                    0.25             0.50                     0.75

                ?2??#                   ?2@A#            ?2A?#                     ?2BA#1C31&D1%&)#                     ?2??#                  ?2@#                           ?2E#         ?2F#1C31&D1%&)#

                        4'0/+'5-.%1+#                  J%H)5()*,)#

Figure 2. Representation of the mitochondrial genetic diversity within the Carnivora with (a) the mitogenomic phylogeny inferred from 142 complete
Carnivora mitogenomes, including those of the two populations of aardwolf (Proteles cristatus) and bat-eared fox (Otocyon megalotis) and (b)
intraspecific (orange) and the interspecific (red) genetic diversities observed for the two mitochondrial markers COX1 and CYTB. Silhouettes from
http://phylopic.org/.

Allio et al. eLife 2021;10:e63167. DOI: https://doi.org/10.7554/eLife.63167                                                                                                                                             4 of 39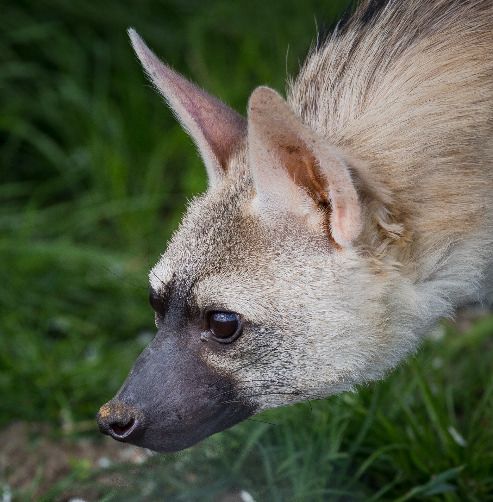
Research article                                                                     Evolutionary Biology Genetics and Genomics

                                    are comparable to those observed between different well-defined species of Carnivora, such as the
                                    red fox (Vulpes vulpes) and the fennec (V. zerda) (0.029) or the steppe polecat (Mustela eversmanii)
                                    and the Siberian weasel (M. sibirica) (0.034) (see Supplementary file 1).
                                        To further assess the genetic distances between the two pairs of subspecies and compare them
                                    to both polymorphism and divergence values observed across Carnivora, two supplemental data-
                                    sets, including at least two individuals per species, were assembled by retrieving all COX1 and CYTB
                                    sequences, which are the two widely sequenced mitochondrial markers for carnivorans, available on
                                    GenBank. These datasets include 3,657 COX1 sequences for 150 species and 6,159 CYTB sequences
                                    for 203 species of Carnivora, including 5 O. megalotis and 10 P. cristatus individuals, respectively.
                                    After adding the corresponding sequences from the newly assembled mitogenomes, ML phyloge-
                                    netic inference was conducted on each dataset. The patristic distances between all tips of the result-
                                    ing phylogenetic trees were measured and classified into two categories: (i) intraspecific variation
                                    (polymorphism) for distances inferred among individuals of the same species and (ii) interspecific
                                    divergence for distances inferred among individuals of different species. Despite an overlap between
                                    polymorphism and divergence in both mitochondrial genes, this analysis revealed a threshold
                                    between polymorphism and divergence of approximately 0.02 substitutions per site for Carnivora
                                    (Figure 2b). With a patristic distance of 0.054 for both COX1 and CYTB, the genetic distance
                                    observed between the two subspecies of aardwolf (Proteles ssp.) was higher than the majority of the
                                    intraspecific distances observed across Carnivora. However, with patristic distances of 0.020 for
                                    COX1 and 0.032 for CYTB, the genetic distances observed between the two subspecies of bat-eared
                                    fox (Otocyon ssp.) were clearly in the ambiguous zone and did not provide a clear indication of the
                                    specific taxonomic status of these populations.
                                        Finally, to test whether the two pairs of allopatric subspecies diverged synchronously or in two
                                    different time periods, Bayesian molecular dating inferences were performed on the 142-taxon ML
                                    mitogenomic tree. The resulting divergence times were slightly different depending on the clock
                                    model used (strict clock [CL], autocorrelated [LN or TK02] and uncorrelated [UGAM or UCLM])
                                    despite the convergence of the MCMC chains for all models. Cross-validation analyses resulted in
                                    the selection of the LN and UGAM models as the models with the best fit based on a higher cross-
                                    likelihood score than that of CL (LN and UGAM versus CL mean scores = 35 8). Unfortunately, these
                                    two statistically indistinguishable models provided different divergence times for the two pairs of
                                    subspecies, with LN favoring a synchronous divergence (approximately 1 Mya [95% credibility inter-
                                    val (CI): 6.72–0.43]; Supplementary file 2), while UGAM favored an asynchronous divergence (~0.6
                                    [CI: 0.83–0.39] Mya for O. megalotis ssp. and ~1.3 [CI: 1.88–0.93] Mya for P. cristatus ssp.;
                                    Supplementary file 2). However, the three chains performed with the UGAM model recovered
                                    highly similar ages for the two nodes of interest with low CI 95% values, whereas the three chains
                                    performed with the LN model recovered less similar ages between chains and high CI 95% values
                                    (Supplementary file 2).

                                    Assembling reference genomes from roadkill
                                    Considering the DNA quality and purity required to perform single-molecule sequencing with ONT,
                                    a specific protocol to extract DNA from roadkill was developed (Tilak et al., 2020). This protocol
                                    was designed to specifically select the longest DNA fragments present in the extract, which also
                                    contained short degraded fragments resulting from postmortem DNA degradation processes. This
                                    protocol increased the median size of the sequenced raw DNA fragments threefold in the case of
                                    aardwolf (Tilak et al., 2020). In total, after high-accuracy basecalling, adapter trimming, and quality
                                    filtering, 27.3 Gb of raw Nanopore long reads were sequenced using 16 MinION flow cells for the
                                    Southern aardwolf (P. c. cristatus) and 33.0 Gb using 13 flow cells for the Southern bat-eared fox (O.
                                    m. megalotis) (Table 1). Owing to quality differences among the extracted tissues for both species,
                                    the N50 of the DNA fragment size for P. cristatus (9,175 bp) was about two times higher than the
                                    N50 of the DNA fragment size obtained for O. megalotis (4,393 bp). The quality of the reads base-
                                    called with the high accuracy option of Guppy was significantly higher than the quality of those
                                    translated with the fast option, which led to better assemblies (see Appendix 1—figure 1). Comple-
                                    mentary Illumina sequencing returned 522.8 and 584.4 million quality-filtered reads per species cor-
                                    responding to 129.5 Gb (expected coverage = 51.8 x) and 154.8 Gb (expected coverage = 61.6 x)
                                    for P. c. cristatus and O. m. megalotis, respectively. Regarding the resequenced individuals of each
                                    species, on average 153.5 Gb were obtained with Illumina resequencing (Table 1).

Allio et al. eLife 2021;10:e63167. DOI: https://doi.org/10.7554/eLife.63167                                                         5 of 39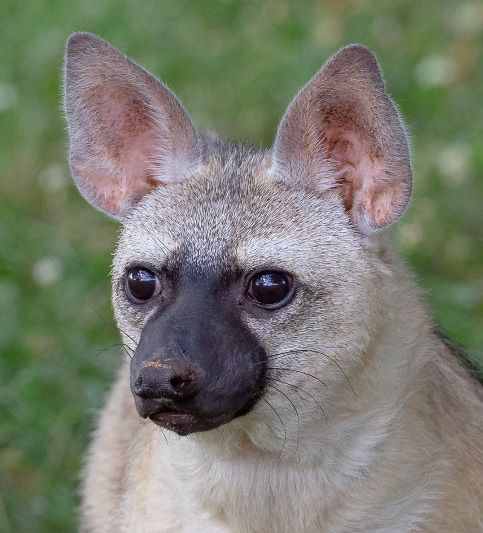
Research article                                                                                                           Evolutionary Biology Genetics and Genomics

Table 1. Summary of sequencing and assembly statistics of the genomes generated in this study.
             Individuals                                     Illumina                            Oxford Nanopore Sequencing                                    Assembly statistics

                                            Raw
                                                     Cleaned      Nbr of    Estimated    Nbr of    Nbr of              Average   Estimated    Genome      Nbr of   N50     Busco      OMM       Missing
 Species      Subspecies       Voucher     reads                                                               N50
                                                    reads (M)   gigabases   coverage    flowcells bases (Gb)             size    coverage     size (Gb)   scaff.   (kb)    score      genes     data (%)
                                            (M)

 Proteles                       NMB
                cristatus                  716.7     522.8        129.50      51.8        16         27.3      9,175    5,555      10.9         2.39      5,669    1.309       92.8   12,062        22.43
 cristatus                      12641

 Proteles                       NMB
                cristatus                  663.8     526.1        140.73      56.3                                                                                                             NA
 cristatus                      12667
                                                                                                                NA                                           NA
 Proteles                       NMS.
             septentrionalis               750.9     516.2        132.44      53.0                                                                                                    12,050        22.96
 cristatus                     Z.2018.54

Otocyon                         NMB
               megalotis                   710.2     584.4        154.81      61.6        13         33        4,393    3,092      13.2         2.75      11,081   728         92.9   11,981        22.02
megalotis                       12639

Otocyon                         NMB
               megalotis                   861.2      820         240.71      96.3
megalotis                       12640
                                                                                                                NA                                                        NA
Otocyon                         FMNH
                virgatus                   661.7     554.1        100.30      40.1
megalotis                       158128

                                                       The two reference genomes were assembled using MinION long reads and Illumina short reads in
                                                   combination with MaSuRCA v3.2.9 (Zimin et al., 2013). Hybrid assemblies for both species were
                                                   obtained with a high degree of contiguity with only 5,669 scaffolds and an N50 of 1.3 Mb for the
                                                   aardwolf (P. cristatus) and 11,081 scaffolds and an N50 of 728 kb for the bat-eared fox (O. megalo-
                                                   tis) (Table 1). Our two new genomes compared favorably with the available carnivoran genome
                                                   assemblies in terms of (i) contiguity showing slightly less than the median N50 and a lower number
                                                   of scaffolds than the majority of the other assemblies (Appendix 1—figure 2, Supplementary file 3)
                                                   and (ii) completeness showing high BUSCO scores (see Appendix 1—figure 3 and
                                                   Supplementary file 4 for BUSCO score comparisons among carnivoran genomes). Comparison of
                                                   two hybrid assemblies with Illumina-only assemblies obtained with SOAPdenovo illustrated the posi-
                                                   tive effect of introducing Nanopore long reads even at moderate coverage by reducing the number
                                                   of scaffolds from 409,724 to 5,669 (aardwolf) and from 433,209 to 11,081 (bat-eared fox), while
                                                   increasing the N50 from 17.3 kb to 1.3 Mb (aardwolf) and from 22.3 kb to 728 kb (bat-eared fox).

                                                   Genome-wide analyses of population structure and differentiation
                                                   To evaluate the population structure between the subspecies of P. cristatus and O. megalotis, the
                                                   number of shared heterozygous sites, unique heterozygous sites, and homozygous sites between
                                                   individuals was computed to estimate an FST-like statistic (hereafter called the genetic differentia-
                                                   tion index or GDI, see Materials and methods and Appendix for more details). Since we were in pos-
                                                   session of two individuals for the Southern subspecies and only one for the Eastern subspecies of
                                                   both species, the genetic differentiation between the two individuals within the Southern subspecies
                                                   and between the Southern and Eastern subspecies was computed. To account for the variation
                                                   across the genome, 10 replicates of 100 regions with a length of 100 kb were randomly chosen to
                                                   estimate genetic differentiation. Interestingly, in both species, the mean heterozygosity was higher
                                                   in the Southern subspecies than in the Eastern subspecies. For the aardwolf, the mean heterozygos-
                                                   ity was 0.189 per kb (sd = 0.010) in the Southern population and 0.121 per kb (sd = 0.008) in the
                                                   Eastern population. For the bat-eared fox, the mean heterozygosity was 0.209 per kb (sd = 0.013) in
                                                   the Southern population and 0.127 per kb (sd = 0.003) in the Eastern population. This heterozygosity
                                                   level is low compared to that of other large mammals (Dı́ez-Del-Molino et al., 2018) and is compa-
                                                   rable to that of the Iberian lynx, the cheetah or the brown hyaena, which have notoriously low
                                                   genetic diversity (Abascal et al., 2016; Casas-Marce et al., 2013; Westbury et al., 2018).
                                                       Since we had very limited power to fit the evolution of the genetic differentiation statistics with a
                                                   hypothetical demographic scenario because of our limited sample size (n = 3), we chose a compara-
                                                   tive approach and applied the same analyses to four well-defined species pairs of carnivorans, for
                                                   which similar individual sampling was available. The genetic differentiation estimates between the
                                                   two individuals belonging to the same subspecies (Southern populations in both cases) were on
                                                   average equal to 0.005 and 0.014 for P. c. cristatus and O. m. megalotis, respectively. This indicated

Allio et al. eLife 2021;10:e63167. DOI: https://doi.org/10.7554/eLife.63167                                                                                                                    6 of 39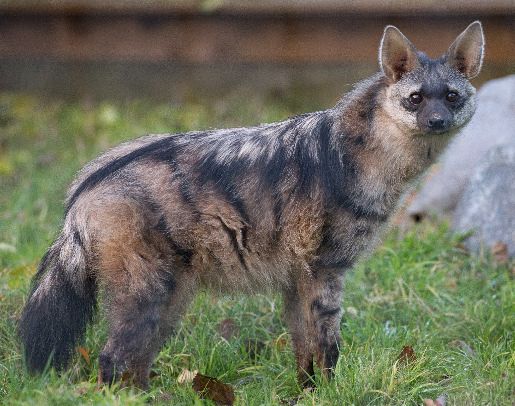
Research article                                                                                                                    Evolutionary Biology Genetics and Genomics

                                                                                              !"#$"#                                                                                          0"#1"#
                                                                                              %&'()*+,
                                                                                              %&'()*+,#                                                                                       ,-2*-3*'&/3).&,#

                                                             !"#$"#                                                                                            0"#1"#
                                                                ()./
                                                                   ./*&,#
                                                             $-()./*&,#                                                                                            *)*+
                                                                                                                                                                      *+,
                                                                                                                                                               1'&,*)*+,#

                              !"#$

                                                                                                                                                                                                                   4+,*156*.-0-.$
                              #"%$
   )*+*,-.$/-00*1*+,-2,-3+$

                              #"($

                              #"&$

                                                                                                                                                                                                                     7$

                                                                                                                                                                                                                   4+,1256*.-0-.$
                              #"'$

                              #"#$

                                      !"#$-("#$-("# !"#$-("#%&'"#    4"#.+2+,#   4"#)+'-+,#    0"#1'&"#1'&"#   0"#1'&"#,-2*"#   5"#$)'&*&$+,# 5"#)'1*/,#        6"#2)'7&3+,# 6"#.839#       0"#.-/#   0"#2)'7+,#
                                           %,#           %,#             %,#         %,#           %,#              %,#              %,#           %,#               %,#          %,#        %,#          %,#
                                      !"#$-("#$-("# !"#$-("#$-("#    4"#.+2+,#   4"#.+2+,#     0"#1'&#"1'&#     0"#1'&"#1'&#    5"#$)'&*&.$+,# 5"#$)'&*&$+,#    6"#2)'7&3+,# 6"#2)'7&3+,#   0"#.-/#     0"#.-/#

Figure 3. Genetic differentiation indexes obtained from a comparison of intraspecific (orange values) and interspecific (red values) polymorphisms in
four pairs of well-defined. Carnivora species and for the subspecies of aardwolf (Proteles cristatus) and bat-eared fox (Otocyon megalotis)
(gray values). Silhouettes from http://phylopic.org/.
The online version of this article includes the following figure supplement(s) for figure 3:
Figure supplement 1. Genetic differentiation indexes obtained from a comparison of intraspecific and interspecific polymorphisms after having
homogenized the depth-of-coverage in all species (at about 15x).
Figure supplement 2. Genetic differentiation indexes obtained from the comparison of intraspecific and interspecific polymorphisms for the pair Ursus
arctos/Ursus maritimus (~10 replicates per species).

                                                                       that the polymorphism observed in the two individuals within the Southern subspecies of each spe-
                                                                       cies was comparable (genetic differentiation index close to 0) and thus that these two subpopula-
                                                                       tions are likely panmictic (Figure 3). In contrast, the genetic differentiation estimates for the two
                                                                       pairs of individuals belonging to the different subspecies were respectively equal on average
                                                                       to 0.533 and 0.294 for P. cristatus ssp. and O. megalotis ssp., indicating that the two disjunct popu-
                                                                       lations are genetically structured. To contextualize these results, the same genetic differentiation
                                                                       measures were estimated using three individuals for four other well-defined species pairs (Figure 3).
                                                                       First, the comparison of the polymorphism of two individuals of the same species led to intraspecific
                                                                       GDIs ranging from 0.029 on average for polar bear (Ursus maritimus) to 0.137 for lion (Panthera leo).
                                                                       As expected, comparing the polymorphisms of two individuals between closely related species led
                                                                       to a higher interspecific GDI ranging from 0.437 on average for the wolf/golden jackal (Canis lupus/

Allio et al. eLife 2021;10:e63167. DOI: https://doi.org/10.7554/eLife.63167                                                                                                                                        7 of 39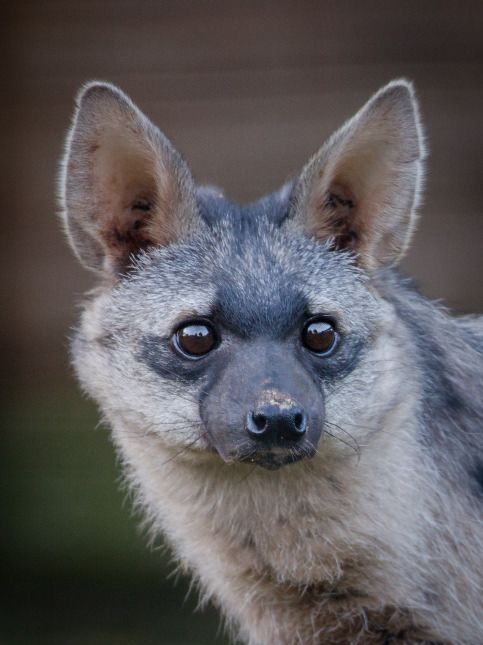
Research article                                                                              Evolutionary Biology Genetics and Genomics

                                    Canis aureus) pair to 0.760 for the lion/leopard (Panthera leo/P. pardus) pair (Figure 3). The genetic
                                    differentiation indexes between the gray wolf (C. lupus) and the golden jackal (C. aureus) averaged
                                    0.44, indicating that the two subspecies of aardwolf (GDI = 0.533) are genetically more differenti-
                                    ated than these two well-defined species, and only slightly less differentiated than the brown
                                    bear (Ursus arctos) and the polar bear (Ursus maritimus). Conversely, the genetic differentiation
                                    obtained between the bat-eared fox subspecies (GDI = 0.294) was lower than the genetic differenti-
                                    ation estimates obtained for any of the four reference species pairs evaluated here (Figure 3). We
                                    verified that differences in depth-of-coverage among individuals did not bias our genetic differentia-
                                    tion estimates by subsampling reads at 15x (Figure 3—figure supplement 1). We also checked that
                                    randomly sampling only three individuals was enough to accurately estimate genetic differentiation
                                    in the case of the brown vs. polar bear comparison (Figure 3—figure supplement 2).

                                    Effective population size reconstructions
                                    We used the pairwise sequential Markovian coalescent (PSMC) model to estimate the ancestral
                                    effective population size (Ne) trajectory over time for each sequenced individual. For both the aard-
                                    wolf and the bat-eared fox, the individual from Eastern African populations showed a continuous
                                    decrease in Ne over time, leading to the recent Ne being lower than that in Southern African popu-
                                    lations (Figure 4). This is in agreement with the lower heterozygosity observed in the Eastern individ-
                                    uals of both species. For the bat-eared fox, the trajectories of the three sampled individuals were
                                    synchronized approximately 200 kya ago (Figure 4a), which could correspond to the time of diver-
                                    gence between the Southern and Eastern populations. In contrast, Ne trajectories for the aardwolf
                                    populations did not synchronize over the whole period (~2 Myrs). Interestingly, the Southern popula-
                                    tions of both species showed a marked increase in population size between ~10 and 30 kya before
                                    sharply decreasing in more recent times (Figure 4).

                                    Phylogenomics of the Carnivora
                                    Phylogenetic relationships within the Carnivora were inferred from a phylogenomic dataset compris-
                                    ing 52 carnivoran species (including the likely new Proteles septentrionalis species), representing all
                                    but two families of the Carnivora (Nandiniidae and Prionodontidae). The non-annotated genome
                                    assemblies of these different species were annotated with a median of 18,131 functional protein-
                                    coding genes recovered for each species. Then, single-copy orthologous gene identification resulted

    a) Bat-eared fox (O. megalotis ssp.)                                      b) Aardwolf (P. cristatus ssp.)

                                                               !"#$%&'(&)(%                                                             #"0121)/&(1'.%
                                                               #"*%&)+,-%                                                               #"*%&)+.&%
                                                               #"*%&)+./%                                                               #"*%&)++3%

Figure 4. PSMC estimates of changes in effective population size over time for the Eastern (orange) and Southern (blue and purple) populations of (a)
bat-eared fox and (b) aardwolf. mu = mutation rate of 10 8 mutations per site per generation and g = generation time of 2 years. Vertical red lines
indicate 20 kyrs and 40 kyrs. Silhouettes from http://phylopic.org/.

Allio et al. eLife 2021;10:e63167. DOI: https://doi.org/10.7554/eLife.63167                                                                      8 of 39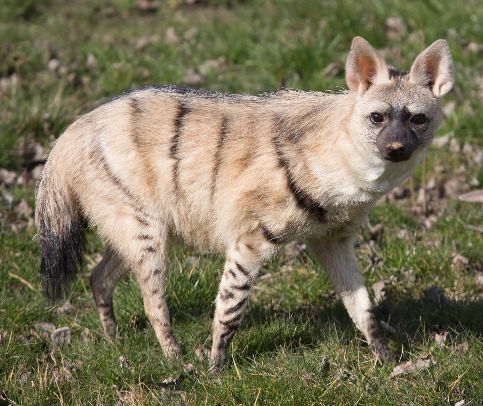
Research article                                                                     Evolutionary Biology Genetics and Genomics

                                    in a median of 12,062 out of the 14,509 single-copy orthologues extracted from the OrthoMaM
                                    database for each species, ranging from a minimum of 6305 genes for the California sea lion (Zalo-
                                    phus californianus) and a maximum of 13,808 for the dog (Canis familiaris) (Supplementary file 5).
                                    Our new hybrid assemblies allowed the recovery of 12,062 genes for the Southern aardwolf (P. c.
                                    cristatus), 12,050 for the Eastern aardwolf (P. c. septentrionalis), and 11,981 for the Southern bat-
                                    eared fox (O. m. megalotis) (Table 1). These gene sets were used to create a supermatrix consisting
                                    of 14,307 genes representing a total of 24,041,987 nucleotide sites with 6,495,611 distinct patterns
                                    (27.0%) and 22.8% gaps or undetermined nucleotides.
                                        Phylogenomic inference was first performed on the whole supermatrix using ML. The resulting
                                    phylogenetic tree was highly supported, with all but one node being supported by maximum boot-
                                    strap (UFBS) values (Figure 5). To further dissect the phylogenetic signal underlying this ML
                                    concatenated topology, we measured gene concordance (gCF) and site concordance (sCF) factors
                                    to complement traditional bootstrap node-support values. For each node, the proportion of genes
                                    (gCF) or sites (sCF) that supported the node inferred with the whole supermatrix was compared to
                                    the proportion of the genes (gDF) or sites (sDF) that supported an alternative resolution of the node
                                    (Figure 5). Finally, a coalescent-based approximate species tree inference was performed using
                                    ASTRAL-III based on individual gene trees. Overall, the three different analyses provided well-sup-
                                    ported and almost identical results (Figure 5). The order Carnivora was divided into two distinct sub-
                                    orders: a cat-related clade (Feliformia) and a dog-related clade (Caniformia). Within the Feliformia,
                                    the first split separated the Felidae (felids) from the Viverroidea, a clade composed of the four fami-
                                    lies Viverridae (civets and genets), Eupleridae (fossa), Herpestidae (mongooses), and Hyaenidae
                                    (hyaenas). In hyaenids, the two species of termite-eating aardwolves (P. cristatus and P. septentrio-
                                    nalis) were the sister-group of a clade composed of the carnivorous spotted (Crocuta crocuta) and
                                    striped (Hyaena hyaena) hyaenas. Congruent phylogenetic relationships among Feliformia families
                                    and within hyaenids were also retrieved with the mitogenomic data set (Figure 2a). The short inter-
                                    nal nodes of the Felidae were the principal source of incongruence among the three different analy-
                                    ses with concordance factor analyses pointing to three nodes for which many sites and genes
                                    support alternative topologies (Figure 5), including one node for which the coalescent-based
                                    approximate species tree inference supported an alternative topology to the one obtained with ML
                                    on the concatenated supermatrix. In the Viverroidea, the Viverridae split early from the Herpestoi-
                                    dea, regrouping the Hyaenidae, Herpestidae, and Eupleridae, within which the Herpestidae and
                                    Eupleridae formed a sister clade to the Hyaenidae. Within the Caniformia the Canidae (canids) was
                                    recovered as a sister group to the Arctoidea. Within the Canidae, in accordance with the mitoge-
                                    nomic phylogeny, the Vulpini tribe, represented by O. megalotis and V. vulpes, was recovered as
                                    the sister clade of the Canini tribe, represented here by Lycaon pictus and C. familiaris. The Arctoi-
                                    dea was recovered as a major clade composed of eight families grouped into three subclades: Ursoi-
                                    dea (Ursidae), Pinnipedia (Otariidae, Odobedinae, and Phocidae), and Musteloidea, composed of
                                    Ailuridae (red pandas), Mephitidae (skunks), Procyonidae (raccoons), and Mustelidae (badgers, mart-
                                    ens, weasels, and otters). Within the Arctoidea, the ML phylogenetic inference on the concatenation
                                    provided support for grouping the Pinnipedia and the Musteloidea to the exclusion of the Ursidae
                                    (bears) with maximum bootstrap support (Figure 5), as in the mitogenomic tree (Figure 2a). How-
                                    ever, the concordance factor analyses revealed that many sites and many genes actually supported
                                    alternative topological conformations for this node characterized by a very short branch length
                                    (sCF = 34.1, SDF1 = 29.2, sDF2 = 36.7, gCF = 46.9, gDF1 = 18.6, gDF2 = 18.2, gDFP = 16.3) (Fig-
                                    ure 5). In the Pinnipedia, the clade Odobenidae (walruses) plus Otariidae (eared seals) was recov-
                                    ered to the exclusion of the Phocidae (true seals), which was also in agreement with the
                                    mitogenomic scenario (Figure 2a). Finally, within the Musteloidea, the Mephitidae represented the
                                    first offshoot, followed by the Ailuridae, and a clade grouping the Procyonidae and the Mustelidae.
                                    Phylogenetic relationships within Musteloidea were incongruent with the mitogenomic tree, which
                                    alternatively supported the grouping of the Ailuridae and the Mephitidae (Figure 2a).

Allio et al. eLife 2021;10:e63167. DOI: https://doi.org/10.7554/eLife.63167                                                         9 of 39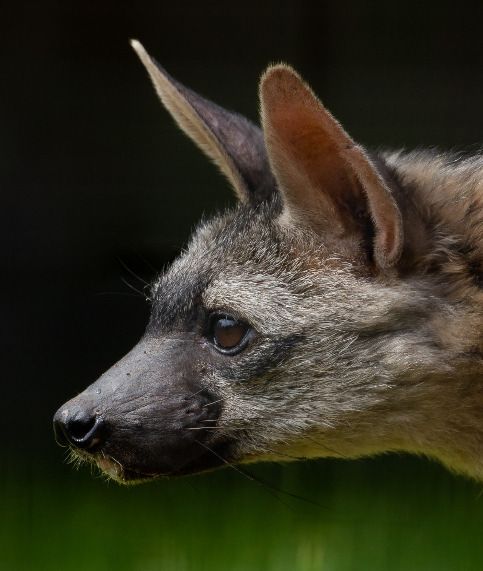
Research article                                                                                         Evolutionary Biology Genetics and Genomics

                                                       !"#$%&'"("#$)"&
                                                                                                                   *"+",-./+/%&01+2"30+-,$4/%&
                                                                                                       5+634-3+-)4"&71+-.&
                                                                                                                             8/+$)"44"&%/+$)"44"&
                                                                                                                             91:-;":1&3"+(":"&
                                                                                                                            !/#;-%&2/#;-&
                                                                                                                    96"1#"&06"1#"&
                                                                                                                    5+-)/4"&)+-)/4"&
                                                                                                                     *+-41:1%&)+$%4"4/%&
                                                                                                                     *+-41:1%&&%1341#4+$-#":$%&
                                                                                               -6"%-.+/(                                                                                                    83$:-;":1&;+")$:$%&
           ;%&=?&,-.+/(                                                                                      @$:/+/%&7/:;1#%&
                                                                                                          *-4-%&7:"(/%&
           *"4#/6-.+/(
Research article Evolutionary Biology Genetics and Genomics
underexploited source material for genomics (Etherington et al., 2020; Maigret, 2019). Roadkill
are indeed relatively easy to survey and the potential coordination with ongoing monitoring and citi-
zen science projects (e.g. Périquet et al., 2018; Waetjen and Shilling, 2017) could potentially give
access to large numbers of tissue samples for frequently encountered species. Even though roadkill
may represent a biased sample of species populations (Brown and Bomberger Brown, 2013;
Loughry and McDonough, 1996), they can also be relevant to generate reference genomes for elu-
sive species that could hardly be sampled otherwise. Despite limited knowledge and difficulties
associated with de novo assembly of non-model species (Etherington et al., 2020), we designed a
protocol to produce DNA extracts of suitable quality for Nanopore long-read sequencing from road-
kill (Tilak et al., 2020). Additionally, we tested the impact of the accuracy of the MinION basecalling
step on the quality of the resulting MaSuRCA hybrid assemblies. In line with previous studies
(Wenger et al., 2019; Wick et al., 2019), we found that using the high accuracy option rather than
the fast option of Guppy 3.1.5 leads to more contiguous assemblies by increasing the N50 value. By
relying on this protocol, we were able to generate two hybrid assemblies by combining Illumina
reads at relatively high coverage (50-60x) and MinION long reads at relatively moderate coverage
(11-13x), which provided genomes with high contiguity and completeness. These represent the first
two mammalian genomes obtained with such a hybrid Illumina/Nanopore approach using the
MaSuRCA assembler for non-model carnivoran species: the aardwolf (P. cristatus) and the bat-eared
fox (O. megalotis). Despite the use of roadkill samples, our assemblies compare favorably, in terms
of both contiguity and completeness, with the best carnivoran genomes obtained so far from classi-
cal genome sequencing approaches that do not rely on complementary optical mapping or chroma-
tin conformation approaches. Overall, our carnivoran hybrid assemblies are fairly comparable to
those obtained using the classic Illumina-based genome sequencing protocol involving the sequenc-
ing of both paired-end and mate-paired libraries (Li et al., 2010). The benefit of adding Nanopore
long reads is demonstrated by the fact that our hybrid assemblies are of better quality than all the
draft genome assemblies generated using the DISCOVAR de novo protocol based on a PCR-free
single Illumina 250 bp paired-end library (Weisenfeld et al., 2014) used in the 200 Mammals Project
of the Broad Genome Institute (Zoonomia Consortium, 2020). These results confirm the capacity of
the MaSuRCA hybrid assembler to produce high quality assemblies for large and complex genomes
by leveraging the power of long Nanopore reads (Wang et al., 2020). Moreover, these two hybrid
assemblies could form the basis for future chromosome-length assemblies by adding complementary
HiC data (van Berkum et al., 2010) as proposed in initiatives such as the Vertebrate Genome Proj-
ect (Koepfli et al., 2015) and the DNA Zoo (Dudchenko et al., 2017). Our results demonstrate the
feasibility of producing high-quality mammalian genome assemblies at moderate cost (5,000–10,000
USD for each of our Carnivora genomes) using roadkill and should encourage genome sequencing
of non-model mammalian species in ecology and evolution laboratories.
Genomic evidence for two distinct species of aardwolves
The mitogenomic distances inferred between the subspecies of O. megalotis and P. cristatus were
comparable to those observed for other well-defined species within the Carnivora. Furthermore, by
comparing the genetic diversity between several well-defined species (divergence) and several indi-
viduals of the same species (polymorphism) based on the COX1 and CYTB genes across Carnivora,
we were able to pinpoint a threshold of approximately 0.02 substitutions per base separating diver-
gence from polymorphism, which is in accordance with a recent study of naturally occurring hybrids
in Carnivora (Allen et al., 2020). This method, also known as the barcoding-gap method
(Meyer and Paulay, 2005), allowed us to show that the two subspecies of P. cristatus present a
genetic divergence greater than the threshold, whereas the divergence is slightly lower for the two
subspecies of O. megalotis. These results seem to indicate that the subspecies P. c. septentrionalis
should be elevated to species level (P. septentrionalis). Conversely, for O. megalotis, this first
genetic indicator seems to confirm the distinction at the subspecies level. However, mitochondrial
markers have some well-identified limitations (Galtier et al., 2009), and it is difficult to properly
determine a threshold between polymorphism and divergence across the Carnivora. The measure of
mtDNA sequence distances can thus be seen only as a first useful indicator for species delineation.
The examination of variation at multiple genomic loci in a phylogenetic context, combined with mor-
phological, behavioral and ecological data, is required to establish accurate species boundaries.
Allio et al. eLife 2021;10:e63167. DOI: https://doi.org/10.7554/eLife.63167 11 of 39Research article Evolutionary Biology Genetics and Genomics
The newly generated reference genomes allowed us to perform genome-wide evaluation of the
genetic differentiation between subspecies using short-read resequencing data of a few additional
individuals of both species. Traditionally, the reduction in polymorphism in two subdivided popula-
tions (p within) compared to the population at large (p between) is measured with several individuals
per population (FST; Hudson et al., 1992). However, given that the two alleles of one individual are
the results of the combination of two a priori non-related individuals of the population (i.e. the
parents), with a large number of SNPs, the measurement of heterozygosity can be extended to esti-
mation of the (sub)population polymorphism. Furthermore, in a panmictic population with recombi-
nation along the genome, different chromosomal regions can be considered to be independent and
can be used as replicates for heterozygosity estimation. In this way, genome-wide analyses of het-
erozygosity provide a way to assess the level of polymorphism in a population and a way to compare
genetic differentiation between two populations. If we hypothesize that the two compared popula-
tions are panmictic, picking one individual or another of the population has no effect (i.e. there is no
individual with excess homozygous alleles due to mating preference across the population), and the
population structure can be assessed by comparing the heterozygosity of the individuals of each
population compared to the heterozygosity observed for two individuals of the same population
(see Methods). Such an index of genetic differentiation, by measuring the level of population struc-
ture, could provide support to establish accurate species boundaries. In fact, delineating species has
been and still is a complex task in evolutionary biology (Galtier, 2019; Ravinet et al., 2016;
Roux et al., 2016). Given that accurately defining the species taxonomic level is essential for a num-
ber of research fields, such as macroevolution (Faurby et al., 2016) or conservation
(Frankham et al., 2012), defining thresholds to discriminate between populations or subspecies in
different species is an important challenge in biology. However, due to the disagreement on the def-
inition of species, the different routes of speciation observed in natura and the different amounts of
data available among taxa, adapting a standardized procedure for species delineation seems com-
plicated (Galtier, 2019).
As proposed by Galtier, 2019, we decided to test the taxonomic level of the P. cristatus and O.
megalotis subspecies by comparing the genetic differentiation observed between Eastern and
Southern populations within these species to the genetic differentiation measured for well-defined
Carnivora species. Indeed, estimation of the genetic differentiation either within well-defined species
(polymorphism) or between two closely related species (divergence) allowed us to define a threshold
between genetic polymorphism and genetic divergence across the Carnivora (Figure 5, see Materi-
als and methods). Given these estimates, and in accordance with mitochondrial data, the two sub-
species of P. cristatus (1) present more genetic differentiation between each other than the two
well-defined species of golden jackal (Canis aureus) and wolf (C. lupus), and (2) present more genetic
differentiation than the more polymorphic species of the dataset, the lion (P. leo). Despite known
cases of natural hybridization reported between C. aureus and C. lupus (Galov et al., 2015;
Gopalakrishnan et al., 2018), the taxonomic rank of these two species is well accepted. In that
sense, given the species used as a reference, both subspecies of P. cristatus seem to deserve to be
elevated to species level. The situation is less clear regarding the subspecies of O. megalotis.
Indeed, while the genetic differentiation observed between the two subspecies is significantly higher
than the polymorphic distances observed for all the well-defined species of the dataset, there is no
species in our dataset that exhibits equivalent or lower genetic divergence than a closely related
species. This illustrates the limits of delineating closely related species due to the continuous nature
of the divergence process (De Queiroz, 2007). The subspecies of O. megalotis fall into the ‘gray
zone’ of the speciation continuum (De Queiroz, 2007; Roux et al., 2016) and are likely undergoing
incipient speciation due to their vicariant distributions. To be congruent with the genetic divergence
observed across closely related species of the Carnivora (according to our dataset), we thus propose
that (1) the taxonomic level of the P. cristatus subspecies be reconsidered by elevating the two sub-
species P. c. cristatus and P. c. septentrionalis to species level, and (2) the taxonomic level for the
two subspecies of O. megalotis be maintained.
Although there is a distinct genetic difference between Eastern and Southern aardwolves, the evi-
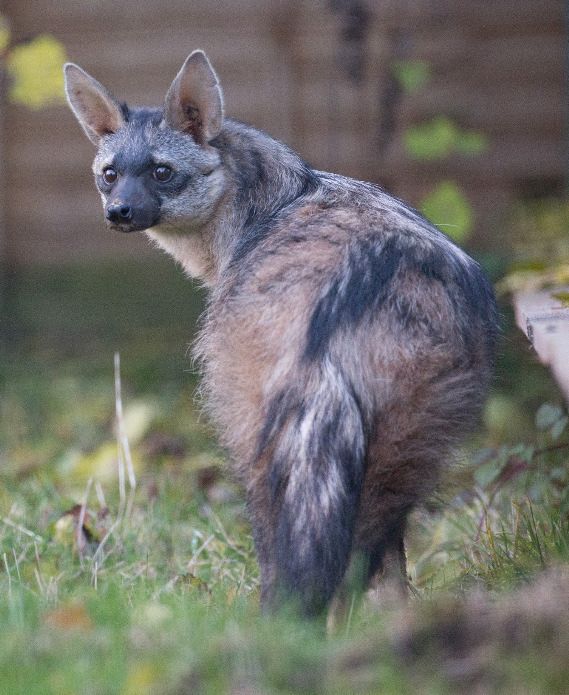
dence for a clear morphological difference is less obvious (Figure 6, Appendix 2—figures 1,
2, Supplementary file 6, Supplementary file 7). The earliest available name for the East African
aardwolf subspecies is P. c. septentrionalis (Rothschild, 1902). This subspecies was first distin-
guished based on pelage characteristics of a specimen from Somaliland, which has a creamy white
Allio et al. eLife 2021;10:e63167. DOI: https://doi.org/10.7554/eLife.63167 12 of 39Research article Evolutionary Biology Genetics and Genomics
Southern aardwolf Eastern aardwolf
(Proteles cristatus) (Proteles septentrionalis)
Figure 6. Phenotypic comparisons, highlighting the differences in fur coloration and stripe pattern, between
captive individuals of Eastern (P. septentrionalis) and Southern (P. cristatus) aardwolves held at Hamerton Zoo Park
(UK). All pictures copyright and used with permission from Rob Cadd.
Allio et al. eLife 2021;10:e63167. DOI: https://doi.org/10.7554/eLife.63167 13 of 39Research article Evolutionary Biology Genetics and Genomics
pelage without any gray tinge, but washed slightly with buff in the neck and side of the rump (Roths-
child, 1902). Also, the striping pattern is less well defined and breaks up into spots on the neck. In
contrast, the Southern aardwolf subspecies P. c. cristatus was described as ashy gray, front and sides
of neck grayish white, black stripes broad and well defined (Rothschild, 1902). Drake-Brock-
man, 1910 also described Somali aardwolves as pale buff with a dark grayish-buff head, but Cab-
rera, 1910 was the first to ascribe diagnostic characters to distinguish between the Eastern and
Southern populations. He described a new subspecies P. c. pallidior from Suakin (Sudan) as a very
pale yellowish cream, almost white ventrally and on the forehead. This contrasts with the grizzled
gray of the forehead of P. c. cristatus (Figure 6). Cabrera, 1910 also described how the fur of P. c.
pallidior is unicolored and lacks the brown base of P. c. cristatus. This latter character appears to be
consistent in an Ethiopian specimen compared with three skins of Namibian and South African origin
in the collections of National Museums Scotland, although it would appear to be a difference in the
coloration of the underfur. However, a further specimen from Zimbabwe also has pale underfur. In
reviewing georeferenced photographs of aardwolves from throughout the range, the striping pat-
tern appeared to be variable, but overall East African specimens tended to be paler, with more con-
trasting stripes with a pale forehead compared with the longer, grayer or ochre-gray fur in Southern
African specimens, which have less distinctive stripes (A.C.K. pers. obs.). However, fur length and
hence stripe distinctiveness may just be a phenotypic response to lower temperatures at higher lati-
tudes compared with equatorial East African specimens. Cabrera, 1910 also proposed differences
in a skull measurement between Eastern and Southern African aardwolves. Three specimens from
Eastern Africa had a wider inter-orbital breadth than two from Southern Africa. However, his meas-
urements also showed that Eastern African aardwolves have larger postorbital breadths, brain case
widths, and maxillary widths at the canines. Adding in measurements of skulls from the literature
(Allen et al., 1909; Heller, 1913; Hollister, 1924; Roberts, 1951; Roberts, 1932) confirmed that
postorbital breadth is significantly greater in P. c. septentrionalis than P. c. cristatus but revealed no
significant differences between other skull measurements including condylobasal length of skull
(Appendix 2—figure 2, Supplementary file 7). However, as noted above from skins, sample sizes
are very limited and thus these morphological differences remain tentative subject to examination of
a much larger sample with more powerful geometric morphometrics methods. These preliminary
observations should nevertheless prompt a deeper investigation of morphological and behavioural
differences that have been reported between the two proposed subspecies of aardwolf to formally
validate our newly proposed taxonomic arrangement. Our results might also have conservation
implications, as the status of the two distinct aardwolf species will have to be re-evaluated separately
in the International Union for Conservation of Nature (IUCN) Red List of Threatened Species
(IUCN, 2020).
Population size variation and environmental change
The Pairwise Sequentially Markovian Coalescent (PSMC) analyses revealed that the Southern and
Eastern African populations have different effective population-size estimates over time, confirming
that they have been genetically isolated for several thousand years, which is more so for the aardwolf
than for the bat-eared fox. This supports the hypothesis of two separate events leading to the same
disjunct distributions for the two taxa, in accordance with mitochondrial dating. Nevertheless, the
population trends are rather similar and are characterized by continuous declines between 1 Mya
and 100–200 kya that are followed by an increase that is much more pronounced in the Southern
populations of both species between 30 and 10 kya. The similar trajectories exhibited by both spe-
cies suggest that they were under the influence of similar environmental factors, such as climate and
vegetation variations.
Aardwolves and bat-eared foxes live in open environments including short-grass plains, shrub-
land, and open and tree savannas, and both are highly dependent on herbivorous termites for their
diet. Therefore, the fluctuation of their populations could reflect the evolution of these semi-arid
ecosystems determining prey abundance during the last million years. However, the global long-
term Plio-Pleistocene African climate is still debated. For Eastern Africa, some studies have sug-
gested an evolution toward increased aridity (deMenocal, 2004; deMenocal, 1995), whereas others
have proposed the opposite (Grant et al., 2017; Maslin et al., 2014; Trauth et al., 2009). There-
fore, our data support the latter hypothesis, as a global long-term tendency toward a wetter climate
in East Africa could have been less favorable for species living in open environments.
Allio et al. eLife 2021;10:e63167. DOI: https://doi.org/10.7554/eLife.63167 14 of 39Research article Evolutionary Biology Genetics and Genomics
Southern populations exhibit a similar decreasing trend between 1 Mya and 100 kya. Once again,
the relevant records appear contradictory. This could be the result of regional variation across South
Africa, with aridification in the Southwestern part and wetter conditions in the Southeast
(Caley et al., 2018; Johnson et al., 2016). Finally, the 30–10 kya period appears to have been more
humid (Chase et al., 2019; Chevalier and Chase, 2015; Lim et al., 2016). This seems inconsistent
with the large population increase detected in Southern populations of both species; however, the
large regions of the Namib Desert that are currently unsuitable could have been more favorable in
wetter conditions.
The global decrease in population size detected in the Southern and Eastern populations could
also reflect the fragmentation of a continuous ancestral range. The global trend toward a wetter cli-
mate may have favored the development of the tropical rainforest in central Africa, creating a belt of
unsuitable habitat. This is in line with previous studies describing diverse biogeographical scenarios
involving the survival and divergence of ungulate populations in isolated savanna refuges during
Pleistocene climatic oscillations (Lorenzen et al., 2012). In this respect, it could be interesting to
study population trends in other species living in semi-arid environments and having a similar range
as disconnected populations. Interestingly, several bird species also have similar distributions includ-
ing the Orange River francolin (Scleroptila gutturalis), the greater kestrel (Falco rupicoloides), the
double-banded courser (Smutsornis africanus), the red-fronted tinkerbird (Pogoniulus pusillus), the
Cape crow (Corvus capensis), and the black-faced waxbill (Estrilda erythronotos), supporting the role
of the environment in the appearance of these disjunct distributions. Finally, these new demographic
results, showing recent population size declines in both regions in both species, might be taken into
account when assessing the conservation status of the two distinct aardwolf species and bat-eared
fox subspecies.
Genome-scale phylogeny of the Carnivora
In this study, we provide a new phylogeny of Carnivora including the newly recognized species of
aardwolf (P. septentrionalis). The resulting phylogeny is fully resolved with all nodes supported with
UFBS values greater than 95% and is congruent with previous studies (Doronina et al., 2015;
Eizirik et al., 2010; Figure 5). Across the Carnivora the monophyly of all superfamilies are strongly
supported (Flynn et al., 2010) and are divided into two distinct suborders: a cat-related clade (Feli-
formia) and a dog-related clade (Caniformia). On the one hand, within the Feliformia, the different
families and their relative relationships are well supported and are in accordance with previous stud-
ies (Eizirik et al., 2010). There is one interesting point regarding the Felidae. While almost all the
nodes of the phylogeny were recovered as strongly supported from the three phylogenetic inference
analyses (ML inferences, concordance factor analyses and coalescent-based inferences), one third of
the nodes (three out of nine) within the Felidae show controversial node supports. This result is not
surprising and is consistent with previous studies arguing for ancient hybridization among the Feli-
dae (Li et al., 2019; Li et al., 2016). Another interesting point regarding the Feliformia and particu-
larly the Hyaenidae is the relationship of the two aardwolves. The two species, P. cristasta and P.
septentrionalis form a sister clade to the clade composed of the striped hyaena (H. hyaena) and the
spotted hyaena (C. crocuta), in accordance with previous studies (Koepfli et al., 2006;
Westbury et al., 2018) and the two subfamilies Protelinae and Hyaeninae that have been proposed
for these two clades, respectively. However, although the phylogenetic inferences based on the
supermatrix of 14,307 single-copy orthologues led to a robust resolution of this node according to
the bootstrap supports, both concordance factors and coalescent-based analyses revealed conflict-
ing signals with support for alternative topologies. In this sense, the description and acceptance of
the Hyaeninae and Protelinae subfamilies still require further analyses, including genomic data for
the brown hyaena (Parahyena brunnea) (Westbury et al., 2018).
On the other hand, within the Caniformia, the first split separates the Canidae from the Arctoi-
dea. Within the Canidae the bat-eared fox (O. megalotis) is grouped with the red fox (Vulpes vulpes)
and the other representative of the Vulpini, but with a very short branch, and concordance analyses
indicate conflicting signals on this node. Regarding the Arctoidea, historically the relationships
between the three superfamilies of arctoids have been contradictory and debated. The least sup-
ported scenario from the literature is that in which the clade Ursoidea/Musteloidea is a sister group
of the Pinnipedia (Flynn and Nedbal, 1998). Based on different types of phylogenetic characters,
previous studies found support for both the clade Ursoidea/Pinnipedia (Agnarsson et al., 2010;
Allio et al. eLife 2021;10:e63167. DOI: https://doi.org/10.7554/eLife.63167 15 of 39You can also read