Hospitality Properties Trust - Investor Presentation August 2017
←
→
Page content transcription
If your browser does not render page correctly, please read the page content below

Sonesta ES Suites Princeton, Princeton , NJ
Operator: Sonesta International Hotels Corp.
Guest Rooms: 124

                     Hospitality Properties Trust
                     Investor Presentation
                     August 2017
Disclaimer.
THIS PRESENTATION CONTAINS STATEMENTS THAT CONSTITUTE FORWARD LOOKING STATEMENTS WITHIN
THE MEANING OF THE PRIVATE SECURITIES LITIGATION REFORM ACT OF 1995 AND OTHER SECURITIES
LAWS. ALSO, WHENEVER HPT USES WORDS SUCH AS “BELIEVE”, “EXPECT”, “ANTICIPATE”, “INTEND”, “PLAN”,
“ESTIMATE”, "WILL", “MAY” AND NEGATIVES OR DERIVATIVES OF THESE OR SIMILAR EXPRESSIONS, HPT IS
MAKING FORWARD LOOKING STATEMENTS. THESE FORWARD LOOKING STATEMENTS ARE BASED UPON
HPT’S PRESENT INTENT, BELIEFS OR EXPECTATIONS, BUT FORWARD LOOKING STATEMENTS ARE NOT
GUARANTEED TO OCCUR AND MAY NOT OCCUR. ACTUAL RESULTS MAY DIFFER MATERIALLY FROM THOSE
CONTAINED IN OR IMPLIED BY HPT’S FORWARD LOOKING STATEMENTS AS A RESULT OF VARIOUS FACTORS.

YOU SHOULD NOT PLACE UNDUE RELIANCE UPON FORWARD LOOKING STATEMENTS.

EXCEPT AS REQUIRED BY LAW, HPT DOES NOT INTEND TO UPDATE OR CHANGE ANY FORWARD LOOKING
STATEMENTS AS A RESULT OF NEW INFORMATION, FUTURE EVENTS OR OTHERWISE.

THIS PRESENTATION CONTAINS NON-GAAP FINANCIAL MEASURES, INCLUDING ADJUSTED EBITDA AND
NORMALIZED FUNDS FROM OPERATIONS. FOR A RECONCILIATION OF THESE NON-GAAP FINANCIAL
MEASURES TO THE MOST DIRECTLY COMPARABLE GAAP FINANCIAL MEASURE, SEE THE APPENDIX TO THIS
PRESENTATION.
Hospitality Properties Trust   Unless otherwise noted, all data presented is as of June 30, 2017.   2

HPT’s high quality properties, conservative profile and secure
cash flows provide a growing and well covered dividend.

   •     Diversified portfolio of well maintained, high quality properties.

   •     Long term portfolio agreements that can provide security of cash flow.

   •     Ramping portfolio and external growth opportunities.

   •     Conservative profile. Capacity to support continued disciplined growth.

   •     Dividend payout ratio only 49.1% in the second quarter 2017.

Hospitality Properties Trust                                                  3

Economic growth continues. Rate growth drives forecast
RevPAR growth.

                                                          Lodging Industry Forecasts

                                                         2017                                                        2018

                                                                                            Industry
                                        CBRE             PWC             STR                YTD 2017       CBRE      PWC      STR
             Supply                      2.0%            2.0%             2.0%                  1.8%        2.1%     1.8%     2.2%
             Demand                      1.9%            2.1%             1.7%                  2.5%        1.8%     1.6%     2.0%
             Occupancy                   -0.1%           0.1%             -0.3%                 0.7%       -0.4%    -0.2%    -0.2%
             Average Rate                3.1%            2.3%             2.5%                  2.3%        2.9%     2.2%     2.7%
             RevPAR                      3.0%            2.3%             2.2%                  3.0%        2.5%     2.0%     2.5%
             Updated:                  Feb-17          May-17           Jul-17                Jun-17       Feb-17   May-17   Jul-17

Hospitality Properties Trust   Source: STR Monthly Hotel Review, PWC Hospitality Directions US and CBRE.                              4
Economic growth continues. Increasing regulation may cater to
full service travel center advantages.
                          Issue                Implication

                                            Fuel and non-fuel demand is
                                            expected to see continued steady
                                            growth over the next decade.

                                            Travel centers which provide
                                            services to professional truck
                                            drivers from restaurants to clean
                                            showers and bathrooms to truck
                                            repair facilities will be in demand.

                                             Larger full service truck stops
                                             with ample parking, for over 200
                                             tractor trailer trucks will have a
                                             competitive advantage – TA’s
                                             reservation program proves
                                             value.

Hospitality Properties Trust                                               5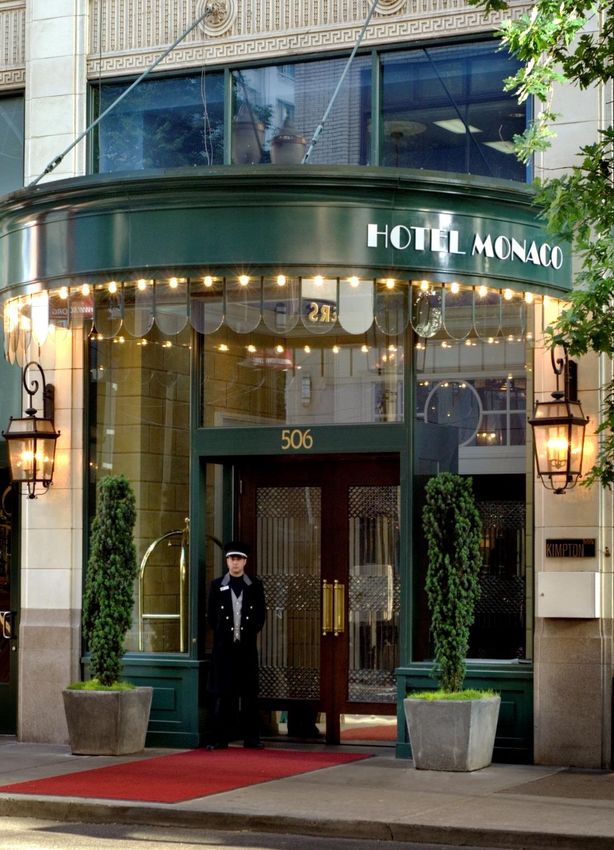
HPT is one of the most geographically diverse lodging REITs and owns
hotels and travel centers operated under recognized brands.
• $9.5 billion investment portfolio (historical investment basis(1)).
• Total of 509 properties located in 45 states, Puerto Rico and Canada.
310 hotels with 48,087 rooms.
199 travel centers located adjacent to the U.S. interstate highway system.
HPT Hotel Brands HPT Travel Center Brands
Hospitality Properties Trust (1) Represents historical cost of properties plus capital improvements funded by HPT less impairment writedowns, if any, and excludes capital improvements made from 6
FF&E reserves funded from hotel operations which do not result in minimum returns or rent.
HPT has $6.0 billion invested in 310 full service, select service and extended
stay hotels.
HPT Hotel Managers Unique Agreements
(by $ invested)
• 9 Hotel Management Agreements/Leases.
Marriott International, Inc.
122 hotels / 17,086 rooms InterContinental Hotels Group
$1,786 million plc (“IHG”) • HPT’s operating agreement structure reduces cash flow
97 hotels / 15,518 rooms
Morgans Hotel volatility in a downturn and allows for upside participation in
$1,942 million
Group
1 hotel / 372 rooms a recovery.
$120 million
• The majority of HPT’s 310 hotel properties are secured by
deposits or guarantees and have potential additional
returns based on performance.
Sonesta International Hotels
Carlson Hotels
Corporation Six agreements covering 221 hotels feature manager
Worldwide
35 hotels / 6,718 rooms
11 hotels / 2,090 rooms Wyndham Hotel Group $1,291 million guarantees and/or security deposits that protect HPT’s
$210 million 22 hotels / 3,579 rooms
cash flow when hotel operations fail to cover minimum
$392 million
Global Hyatt Corporation
rents or returns.
22 hotels / 2,724 suites
$302 million
Hotel management agreements provide for additional
returns to HPT based on hotel net operating income
above certain thresholds.
Hospitality Properties Trust (1) Represents historical cost of properties plus capital improvements funded by HPT less impairment writedowns, if any, and excludes capital improvements made from 7
FF&E reserves funded from hotel operations.
HPT’s mostly upscale hotel portfolio is operated under 21
recognized brands.

                                ~85%                  ~15%
                                (263 Hotels)            (47 Hotels)
                         Midscale to Upscale   Primarily Upscale to Luxury
       Select Service + Extended Stay Hotels       Full Service Hotels

 Based on hotel unit count as of 6/30/2017.

Hospitality Properties Trust                                                 8
Hospitality Properties Trust
                        NYSE: HPT
Crowne Plaza San Jose –October           2013
                         Silicon Valley, San Jose, CA
Operator: InterContinental Hotels Group
Guest Rooms: 304        www.hptreit.com
      Hospitality Properties Trust                      9
Kimpton Hotel Monaco Portland, Portland, OR
Operator: InterContinental Hotels Group
Guest Rooms: 221

   Hospitality Properties Trust               10
HPT has $3.5 billion invested in 199 travel centers located along the U.S.
Interstate Highway System.

• TravelCenters of America operates two of the strongest travel center brands in the
  industry.
HPT owns or leases 149 “TA” travel centers located in 40 states.                              •      5 Triple Net Leases.

                                                     Seville, OH                              •      HPT's travel centers are part of TA’s network of 256 “TA”
                                                                                                     and “Petro” branded travel centers in 43 states and
                                                                                                     Canada.

                                                                                              •      Difficult to replicate real estate located near exits along the
                                                                                                     U.S. Interstate Highway System.

                                                                                              •      Average site is over 25 acres with parking for 200 tractor
                                                                                                     trailers and 100 cars.

                                                                                              •      Multiple diesel fuel and gasoline islands, plus a table
HPT owns 50 “Petro” travel centers located in 26 states.                                             service restaurant (approx. 135 seats) and one or more
                                                  Wilmington, IN                                     quick service restaurants (QSRs) at each site.(1)

                                                                                              •      Large travel and convenience stores averaging over 5,000
                                                                                                     square feet of interior space.

                                                                                              •      Truck repair facilities and parts stores; the only nationwide
                                                                                                     on the road truck repair service along the U.S. Interstate
                                                                                                     Highway System.

                               (1)   In total, TA operates 633 quick service restaurants (QSRs) under contracts with 35 national franchisors including: Arby’s®; Burger King®;
Hospitality Properties Trust         Popeye's Chicken & Biscuits®; Pizza Hut®; Starbucks Coffee®; Subway®; Taco Bell® and Wendy’s®.                                              11
The defining business characteristic of HPT remains its strong
operating agreement terms.
• Portfolio Agreements. 507 of HPT’s 509 properties are part of pooled portfolio agreements. Each
portfolio agreement includes between 11 and 97 geographically diverse properties.
• Minimum Returns and Rents. The majority of HPT’s agreements require its managers or tenants to
pay HPT fixed minimum returns or rents.
• Security Features. The majority of HPT’s agreements include security features to protect HPT’s
cash flows, including some or all of: cash security deposits; subordination of management fees to
HPT’s minimum returns/rents; and full or limited guarantees from parent companies.
• Long Term Agreements. New agreements are generally entered for 15 to 25 years. The weighted
average term remaining for our agreements (weighted by our investment) is 16 years.
• High Likelihood of Contract/Lease Renewals. Renewals are permitted only for all properties in each
portfolio. Because HPT’s agreements generally represent significant percentages of its operators’
brands, renewals are highly likely.
• FF&E Reserves. Hotel operators are generally required to escrow 5-6% of gross revenues for
renovations.
Hospitality Properties Trust 1279% of HPT’s total minimum rents and returns are secured by
deposits or guarantees.
No. of No. of Annual Minimum Coverage (2)
(1)
Operating Agreement Properties Rooms Return/Rent % of Total Q2 LTM Security Features
1 Marriott No. 1 53 7,610 $ 68,952 8% 1.51x 1.28x -
2 Marriott No. 234 68 9,120 106,360 13% 1.30x 1.12x Limited guaranty + deposit.
3 Marriott No. 5 1 356 10,159 1% 0.76x 0.80x Marriott guaranty.
4 InterContinental 97 15,518 181,485 22% 1.30x 1.18x Security deposit.
5 Sonesta 35 6,718 97,134 12% 1.05x 0.72x -
6 Wyndham 22 3,579 28,798 4% 1.19x 0.83x Limited guaranty.
7 Hyatt 22 2,724 22,037 3% 1.37x 1.13x Limited guaranty.
8 Carlson 11 2,090 12,920 2% 1.53x 1.35x Limited guaranty.
9 Morgans 1 372 7,595 1% 0.47x 0.90x -
Subtotal Hotels 310 48,087 535,440 66% 1.26x 1.07x
10 TA No. 1 40 N/A 52,305 5% 1.69x 1.60x TA guaranty.
11 TA No. 2 40 N/A 53,067 7% 1.61x 1.51x TA guaranty.
12 TA No. 3 39 N/A 53,472 7% 1.61x 1.52x TA guaranty.
13 TA No. 4 40 N/A 53,062 7% 1.53x 1.45x TA guaranty.
14 TA No. 5 40 N/A 68,841 8% 1.64x 1.54x TA guaranty.
Subtotal Travel Centers 199 N/A 280,747 34% 1.62x 1.52x
Total/Average 14 agreements 509 48,087 $ 816,187 100% 1.38x 1.22x
8 brand owners
(1) Annualized minimum rent amounts represent cash rent amounts due to us and exclude adjustments, if any, necessary to recognize rental income on a straight line basis in accordance with GAAP .
(2) We define coverage as combined total property level revenues minus all property level expenses and FF&E reserve escrows which are not subordinated to minimum returns and minimum rent payments due to us
Hospitality Properties Trust (which data is provided to us by our managers or tenants), divided by the minimum return or minimum rent payments due to us. Coverage amounts for our Sonesta, InterContinental and TA Nos.1,2,3 and 4 agreements
include data for periods prior to our ownership of certain properties.
13Country Inn & Suites by Carlson, San Diego, CA
Operator: Carlson Rezidor Hotel Group
Guest Rooms: 180
Hospitality Properties TrustCourtyard Columbia, Columbia, MD
Operator: Marriott International, Inc.
Guest Rooms: 152
Hospitality Properties Trust 15HPT believes its portfolio activity and renovations have
resulted in outperformance.
Hotel Renovations TA’s Full Service Offering
• From 2010 through 2016, HPT completed renovations at • TA’s Last Twelve Months Ended June 30, 2017 consolidated
almost all of its 302 comparable hotels at a cost of operating results:
approximately $1 billion.
Revenue: $5.8 billion.
EBITDAR: $364.0 million.
(Dollars) HPT Comparable RevPAR vs. Industry RevPAR EBITDA: $93.0 million.
$140
$120
TA Consolidated Nonfuel Revenues
(Billions)
$2.5
$100
$2.0
$80
$1.5
$60
$40 $1.0
$20 $0.5
$0 $0.0
2012 2013 2014 2015 2016 2017 YTD 2011 2012 2013 2014 2015 2016 6/30/17 LTM
HPT Comparable RevPAR STR RevPAR YTD Non-fuel Revenues
Hospitality Properties Trust 16Sonesta Philadelphia Rittenhouse Square, Philadelphia, PA
Operator: Sonesta International Hotels Corp.
Guest Rooms: 439
Hospitality Properties Trust 17Hyatt Place Tempe / Phoenix Airport, Tempe, AZ Operator: Carlson Rezidor Hotel Group Guest Rooms: 123 Hospitality Properties Trust 18
Financial highlights.
(In thousands except number of properties,                                                                        As of and for the three months ended
number of rooms and per share data.)                                                                                             June 30,
                                                                                                                         2017                                    2016                                   Change                           % Change
                                              Property data:
                                              Number of properties                                                                509                                    502                                             7
                                              Number of rooms                                                                  48,087                                 46,347                                         1,740
                                              Annual minimum returns and rents(1)                             $               816,187                              $ 769,006                                $       47,181                         6.1%
                                              Coverage of annual minimum returns
                                                                                                                                   1.26x                                      1.34x
                                              and rents - hotels(2)

                                              Coverage of annual minimum returns
                                                                                                                                   1.62x                                      1.64x
                                              and rents - travel centers(2)

                                              Key financial data:
                                              Total revenues                                                  $               570,603                              $ 550,299                                $       20,304                         3.7%
                                              Adjusted EBITDA(3)                                              $               220,297                              $ 215,608                                $        4,689                         2.2%
                                              Normalized funds from operations
                                                                                                              $               173,604                              $ 165,714                                $          7,890                       4.8%
                                              (FFO)(3)
                                              Total Debt (book value)(4)/Gross book
                                                                                                                                42.0.%                                      40.8%                                   1.2 pts.
                                              value of real estate(5)
                                              Total Debt (book value) (4)/Annualized
                                                                                                                                     4.4x                                       4.1x
                                              Adjusted EBITDA(3)

                                              Per share data:
                                              Annualized Common dividend                                      $                     2.08                           $           2.04                         $           0.04                       2.0%
                                              Normalized FFO(3)                                               $                     1.06                           $           1.09                         $          -0.03                      -2.8%
                                              Normalized FFO payout ratio(3)                                                     49.1%                                      46.6%                                   2.5 pts.
         (1)   Annualized minimum rent amounts represent cash rent amounts due to us and exclude adjustments, if any, necessary to recognize rental income on a straight line basis in accordance with GAAP.
         (2)   We define coverage as combined total property level revenues minus all property level expenses and FF&E reserve escrows which are not subordinated to minimum returns and minimum rent payments to us (which data is provided to us by our managers or tenants), divided by the minimum
               return or minimum rent payments due to us (which data is provided to us by our managers or tenants), divided by the minimum return or minimum rent payments due to us. Coverage amounts for our InterContinental Hotels Group, plc, or InterContinental, and our Sonesta and TA Nos. 2 and 4
               agreements include data for periods prior to our ownership of certain hotels and travel centers.
         (3)   See exhibits on page 27 for a reconciliation of EBITDA to nearest GAAP measure. See exhibits on page 28 for a reconciliation of FFO to nearest GAAP measure.
         (4)   Debt amounts are net of unamortized discounts and certain issuance costs.
         (5)   Gross book value of real estate assets is real estate properties at cost, before purchase price allocations, less impairment writedowns, if any.

    Hospitality Properties Trust                                                                                                                                                                                                                                                            19
HPT believes it will continue benefitting from a well maintained portfolio.
• HPT funded $5.1 million of hotel improvements during Q2. HPT expects to fund
an additional $39.3 million of hotel improvements for the remainder of 2017.
• HPT expects to have 9 hotels under renovation for all or part of the third
quarter.
• HPT funded $25.5 million of travel center improvements in Q2. HPT expects to
fund an additional $32.9 million of travel center improvements during the
remainder of 2017.
• HPT’s managers have expectations for hotel occupancy to remain relatively flat
with modest increases to rate such that 2017 RevPAR growth may be 0.5% to
1.0%. GOP margins are forecasted to be within the flat to down 50 basis points
range reflecting slower revenue growth and continued cost pressures
especially from wages and travel agent commissions.
Hospitality Properties Trust 20During 2017, HPT has acquired or agreed to acquire 20 hotels and one
travel center.
• In February, HPT acquired the 483 room Hotel Allegro in Chicago, IL for $85.5 million. HPT added this Kimpton®
branded hotel to its management agreement with IHG. HPT obtained an additional $6.9 million to supplement the
existing security deposit in connection with this transaction.
• In March, HPT acquired the 121 room Hotel Alexis in Seattle, WA for a purchase price of $71.6 million. HPT added
this Kimpton® branded hotel to its management agreement with IHG. HPT obtained an additional $5.7 million to
supplement the existing security deposit in connection with this purchase.
• In May, HPT acquired from and leased back to TA a newly developed travel center in Columbia, SC for a purchase
price of $27.6 million, excluding acquisition related costs. This Petro® branded property features 134 truck parking
spots, a Quaker Steak and Lube restaurant, a Starbucks Coffee Company® amongst many other trucking and
entertainment amenities. This property was added to TA No. 4 lease. HPT expects its minimum annual rent under the
Courtyard Guestroom Residence Inn Kitchen
lease to increase by $2.3 million.
• In June, HPT acquired the 389 room Chase Park Plaza hotel in St. Louis, MO for $87.6 million. HPT converted this
hotel to the Royal Sonesta® hotel brand and added it to its management agreement with Sonesta.
• Also in June, HPT acquired the 495 room Crowne Plaza Ravinia hotel in Atlanta, GA for $88.6 million. HPT added
this Crowne Plaza® branded hotel to its management agreement with IHG. HPT obtained an additional $7.1 million to
supplement the existing security deposit in connection with this transaction.
• In August, HPT acquired the 419 room Crowne Plaza & Lofts hotel in Columbus, OH for $49.0 million. HPT plans to
rebrand the Lofts as an Indigo Hotel® and has added it to its management agreement with IHG.
Hospitality Properties Trust 21HPT Acquisitions, Cont.
• In July, HPT entered into an agreement to acquire the 300 room Crowne Plaza Charlotte
Executive Park Hotel in Charlotte, NC for $44.0 million. HPT expects to complete this acquisition
during the third quarter of 2017. HPT plans to add this hotel to its management agreement with
IHG.
• Also in July, HPT entered into an agreement to acquired 14 extended stay hotels with 1,653
suites located in 12 states, for $138 million. HPT expects to complete this acquisition during the
third quarter of 2017. HPT plans to convert these hotels to the Sonesta ES Suite® brand and will
add them to its management agreement with Sonesta.
Courtyard Guestroom Residence Inn Kitchen
Hospitality Properties Trust 22During 2017, HPT has sold or agreed to sell three hotels.
HPT and Carlson agreed to sell three Carlson® branded hotels that as of June
30th had an aggregate carrying value of $14.1 million.
• In June, HPT began marketing for sale its Park Plaza® branded hotel in
Bloomington, MN.
• In July, HPT entered into an agreement to sell its 143 room Country Inn &
Suites in Naperville, IL for $6.6 million. HPT expects to complete the sale of
this Country Inn & Suites® branded hotel during the third quarter of 2017.
• In August, HPT sold its 159 room Radisson® branded hotel in Chandler, AZ
for $9.5 million.
Hospitality Properties Trust 23HPT has a conservative financial profile.
Book Capitalization as of June 30, 2017
($ in thousands)
$3,162
Unsecured floating rate debt (1) $ 676,753 48%
Unsecured fixed rate debt (1) 3,162,275 $2,780
Total debt 3,839,028 42%
Shareholders equity (book value) 2,780,198
$677
Total Book Capitalization $ 6,619,226 10%
Shareholders equity Unsecured fixed rate debt
Unsecured floating rate debt
(1) Debt amounts are net of unamortized discounts and certain issuance costs.
Hospitality Properties Trust 24HPT has well laddered debt maturities and the capacity for
disciplined growth.
• No secured debt. HPT Term Debt Maturities as of
• Unsecured senior notes:
June 30, 2017
($ in millions)
$3,200 million as of June 30, 2017
($3,162 million net of discounts).
$900
All fixed rate.
$800
• Unsecured term loan: $700
$400 million.
$600
April 2019 maturity. $500
• Revolving credit facility: $400
$1 billion ($278 million outstanding as of $300
June 30, 2017).
$200
July 2018 maturity plus one year
extension option. $100
• No derivatives, no off balance sheet liabilities $0
2017 2018 2019 2021 2022 2023 2024 2025 2026 2027
and no material adverse change clauses or
ratings triggers.
Hospitality Properties Trust 25HPT’s high quality properties, conservative profile and secure cash flows provide a growing and well covered dividend. • Diversified portfolio of well maintained, high quality properties. • Long term portfolio agreements that can provide security of cash flow. • Ramping portfolio and external growth opportunities. • Conservative profile. Capacity to support continued disciplined growth. • Dividend payout ratio only 49.1% in the second quarter 2017. Hospitality Properties Trust 26
Calculation of EBITDA and Adjusted EBITDA.
                                                                 CALCULATION OF EBITDA AND ADJUSTED EBITDA (1)
                                                                                   (in thousands)
                                                                                                       For the Three Months Ended,
                                                                           6/30/2017          3/31/2017         12/31/2016        9/30/2016                                 6/30/2016

         Net income                                                                       60,699                37,171                 63,186      $         51,812 $               56,061
         Add: Interest expense                                                            45,189                43,566                 37,349                41,280                 41,698
                 Income tax expense                                                          786                   356                    537                   948                  2,160
                 Depreciation and amortization                                            95,155                93,451                 91,150                90,139                 88,782
         EBITDA                                                                          201,829               174,544                192,222               184,179                188,701

         Add
         (Less): Acquisition related costs (2)                                                  --                     --                  482                    156                   117
                 General and administrative expense paid in
                 common shares (3)                                                           718                   412                     557                  985                    870
                 Estimated business management incentive fee (4)                          17,750                19,620                (56,272)               25,036                 25,920
                 Loss on early extinguishment of debt (5)                                     —                     —                       —                   158                     —
         Adjusted EBITDA                                                       $         220,297      $        194,576      $         136,989      $        210,514 $              215,608

   (1) Please see page 29 for definitions of EBITDA and Adjusted EBITDA and a description of why we believe the presentation of these measures provide useful information to investors.
   (2) Represents costs associated with our acquisition activities. Acquisition costs incurred during the 2017 period have been capitalized in purchase accounting pursuant to a change in GAAP.
   (3) Amounts represent the equity compensation awarded to our trustees, our officers and certain other employees of RMR LLC.
   (4) Incentive fees under our business management agreement are payable after the end of each calendar year, are calculated based on common share total return, as defined, and are included in
       general and administrative expense in our consolidated statements of income. In calculating net income in accordance with GAAP, we recognize estimated business management incentive fee
       expense, if any, in the first, second and third quarters. Although we recognize this expense, if any, in the first , second and third quarters for purposes of calculating net income, we do not
       include these amounts in the calculation of Adjusted EBITDA until the fourth quarter, which is when the actual business management incentive fee expense amount for the year, if any, is
       determined. Adjusted EBITDA includes business management incentive fee expense of $52,407 for three months ended December 31, 2016. Business management incentive fees for 2016
       were paid in cash in January 2017.
   (5) We recorded losses of $158 and $70 on early extinguishment of deb during the three months ended September 30, 2016 and March 31, 2016, respectively, in connection with redemptions of
       certain senior unsecured notes.

Hospitality Properties Trust                                                                                                                                                                     27
Calculation of Funds From Operations (FFO) and Normalized FFO.
(1)
CALCULATION OF FUNDS FROM OPERATIONS (FFO) AND NORMALIZED FFO AVAILABLE FOR COMMON SHAREHOLDERS
(dollar amounts in thousands, except per share data)
For the T hree Months Ended, For the Six Months Ended
6/30/2017 3/31/2017 12/31/2016 9/30/2016 6/30/2016 2017 2016
Net income available for common shareholders $ 60,699 $ 25,483 $ 58,020 $ 46,646 $ 50,895 $ 86,542 $ 97,780
Add: Depreciation and amortization 95,155 93,451 91,150 90,139 88,782 188,606 176,053
FFO available for common shareholders 155,854 119,294 149,170 136,785 139,677 275,148 273,833
Add (Less): Acquisition related costs (2) — — 482 156 117 — 729
Estimated business management 17,750 19,620 -56,272 25,036 25,920 37,370 31,236
Loss on early extinguishment of debt (4) — — — 158 — — 70
Excess of liquidation preference over
Preferred Shares redeemed (5) 9,893 9,893 — — — 9,893 —
Normalized FFO available for common shareholders $173,604 $148,807 $ 93,380 $162,135 $165,714 $322,411 $ 305,868
Weighted average shares outstanding (basic) 164,123 164,120 164,120 157,217 151,408 164,121 151,405
Weighted average shares outstanding (diluted) 164,165 164,128 164,128 157,263 151,442 164,157 151,428
Basic and diluted per share common share amounts:
Net income available for common shareholders $ 0.16 $ 0.16 $ 0.35 $ 0.30 $ 0.34 $ 0.53 $ 0.65
FFO available for common shareholders $ 0.73 $ 0.73 $ 0.91 $ 0.87 $ 0.92 $ 1.68 $ 1.81
Normalized FFO available for common shareholders $ 0.91 $ 0.91 $ 0.57 $ 1.03 $ 1.09 $ 1.96 $ 2.02
(1) Please see page 29 for definitions of FFO and Normalized FFO available for common shareholders, a description of why we believe the presentation of these measures provides useful information to investors regarding our
financial condition and results of operations and a description of how we use these measures.
(2) Represents costs associated with our acquisition activities. Acquisition costs incurred during the 2017 period have been capitalized in purchase accounting pursuant to change GAAP.
(3) Incentive fees under our business management agreement are payable after the end of each calendar year, are calculated based on common share total return, as defined, and are included in general and administrative
expense in our consolidated statements of income . In calculating net income in accordance with GAAP, we recognize estimated business management incentive fee expense, if any, in the first, second and third quarters.
Although we recognize this expense, if any, in the first , second and third quarters for purposes of calculating net income, we do not include these amounts in the calculation of Normalized FFO available for common
shareholders until the fourth quarter, which is when the business management incentive fee expense amount for the year, if any, is determined. Normalized FFO available for common shareholders includes business
management incentive fee expense of $52,407 for three months ended December 31,2016. Business management incentive fees for 2016 were paid in cash in January 2017.
(4) We recorded losses of $158 and $70 on early extinguishment of debt during the three months ended September 30, 2016 and March 31, 2016, respectively, in connection with the redemptions of certain senior unsecured
notes.
(5) On February 10, 2017, we redeemed all 11,600,000 of our outstanding 7.125% Series D cumulative redeemable preferred shares at the stated liquidation preference of $25.00 per share plus accrued and unpaid
distributions to the date of redemption (an aggregate of $291,435). The liquidation preference of the redeemed shares exceeded the carrying amount for the redeemed shares as of the date of redemption by $9,893, or
$0.06 per share, and we reduced net income available to common shareholders in the three months ended March 31, 2017 by that excess amount.
Hospitality Properties Trust 28Non-GAAP financial measures definitions.
Definition of EBITDA and Adjusted EBITDA
We calculate EBITDA and Adjusted EBITDA as shown on page 27. We consider EBITDA and Adjusted EBITDA to be appropriate supplemental measures of our operating
performance, along with net income, net income available for common shareholders and operating income. We believe that EBITDA and Adjusted EBITDA provide useful information
to investors because by excluding the effects of certain historical amounts, such as interest, depreciation and amortization expense, EBITDA and Adjusted EBITDA may facilitate a
comparison of current operating performance with our past operating performance. In calculating Adjusted EBITDA, we include business management incentive fees only in the fourth
quarter versus the quarter when they are recognized as expense in accordance with GAAP due to their quarterly volatility not necessarily being indicative of our core operating
performance and the uncertainty as to whether any such business management incentive fees will be payable when all contingencies for determining such fees are known at the end
of the calendar year. EBITDA and Adjusted EBITDA do not represent cash generated by operating activities in accordance with GAAP and should not be considered alternatives to net
income, net income available for common shareholders or operating income as indicators of operating performance or as measures of our liquidity. These measures should be
considered in conjunction with net income, net income available for common shareholders and operating income as presented in our condensed consolidated statements of income.
Other real estate companies and REITs may calculate EBITDA and Adjusted EBITDA differently than we do.
Definition of FFO and Normalized FFO
We calculate FFO available for common shareholders and Normalized FFO available for common shareholders as shown on page 28. FFO available for common shareholders is
calculated on the basis defined by The National Association of Real Estate Investment Trusts, or NAREIT, which is net income available for common shareholders calculated in
accordance with GAAP, excluding any gain or loss on sale of properties and loss on impairment of real estate assets, if any, plus real estate depreciation and amortization, as well as
certain other adjustments currently not applicable to us. Our calculation of Normalized FFO available for common shareholders differs from NAREIT's definition of FFO available for
common shareholders because we include business management incentive fees, if any, only in the fourth quarter versus the quarter when they are recognized as expense in
accordance with GAAP due to their quarterly volatility not necessarily being indicative of our core operating performance and the uncertainty as to whether any such business
management incentive fees will be payable when all contingencies for determining such fees are known at the end of the calendar year, and we exclude the excess of liquidation
preference over carrying value of preferred shares redeemed, acquisition related costs expensed under GAAP and loss on early extinguishment of debt. We consider FFO available for
common shareholders and Normalized FFO available for common shareholders to be appropriate supplemental measures of operating performance for a REIT, along with net income,
net income available for common shareholders and operating income. We believe that FFO available for common shareholders and Normalized FFO available for common
shareholders provide useful information to investors because by excluding the effects of certain historical amounts, such as depreciation expense, FFO available for common
shareholders and Normalized FFO available for common shareholders may facilitate a comparison of our operating performance between periods and with other REITs. FFO available
for common shareholders and Normalized FFO available for common shareholders are among the factors considered by our Board of Trustees when determining the amount of
distributions to shareholders. Other factors include, but are not limited to, requirements to maintain our qualification for taxation as a REIT, limitations in our credit agreement and
public debt covenants, the availability to us of debt and equity capital, our expectation of our future capital requirements and operating performance and our expected needs for and
availability of cash to pay our obligations. FFO available for common shareholders and Normalized FFO available for common shareholders do not represent cash generated by
operating activities in accordance with GAAP and should not be considered as alternatives to net income, net income available for common shareholders or operating income as
indicators of our operating performance or as measures of our liquidity. These measures should be considered in conjunction with net income, net income available for common
shareholders and operating income as presented in our condensed consolidated statements of income. Other real estate companies and REITs may calculate FFO available for
common shareholders and Normalized FFO available for common shareholders differently than we do.
Hospitality Properties Trust 29Sonesta ES Suites Princeton, Princeton , NJ
Operator: Sonesta International Hotels Corp.
Guest Rooms: 124
Hospitality Properties Trust
Investor Presentation
August 2017You can also read