HOTEL Futures 2019 - Tourism Investment
←
→
Page content transcription
If your browser does not render page correctly, please read the page content below
HOTEL
Futures
2019
A REVIEW OF THE REVENUE PERFORMANCE
OF MAJOR AUSTRALIAN HOTEL MARKETS
WITH FORECASTS TO 2027

www.dransfield.com.au
HOTEL FUTURES DARWIN
FY18 8.4% CONTENTS
2019
RevPAR Growth FY19 -20.6%
FY2018 & FY2019 HF2019 Snapshot 3
Australia at a Glance 4
CAIRNS
FY18 6.0% Short & Medium Term Outlook 6
FY19 -2.2% Long Term Outlook 7
City Summaries 8
BRISBANE
Transaction Trends 9
FY18 4.1%
Transactions 10
FY19 -4.9%
Background to Forecasts
GOLD COAST Supply & Demand 12
AUSTRALIA RevPAR FY18 7.5%
Arrivals & Departures 17
FY2018 2.6% Actual FY19 -1.1%
Adelaide 18
FY2019 -2.5% Forecast
Brisbane 22
Cairns 26
SYDNEY
FY18 3.2% Canberra 30
FY19 -3.8% Darwin 34
Gold Coast 38
CANBERRA Hobart 42
PERTH ADELAIDE FY18 5.0%
Melbourne 46
FY18 -6.0% FY18 5.1% FY19 2.7%
FY19 -3.8% FY19 -2.7% Perth 50
MELBOURNE Sydney 54
FY18 -1.2% Methodology & Background 58
Source: FY2018 actuals STR
IMPORTANT: STR data remains the property FY19 0.3%
of STR. Any republication or other re-use of
HOBART Data Geography 60
any data within this document without the FY18 -2.1% Coverpage properties:
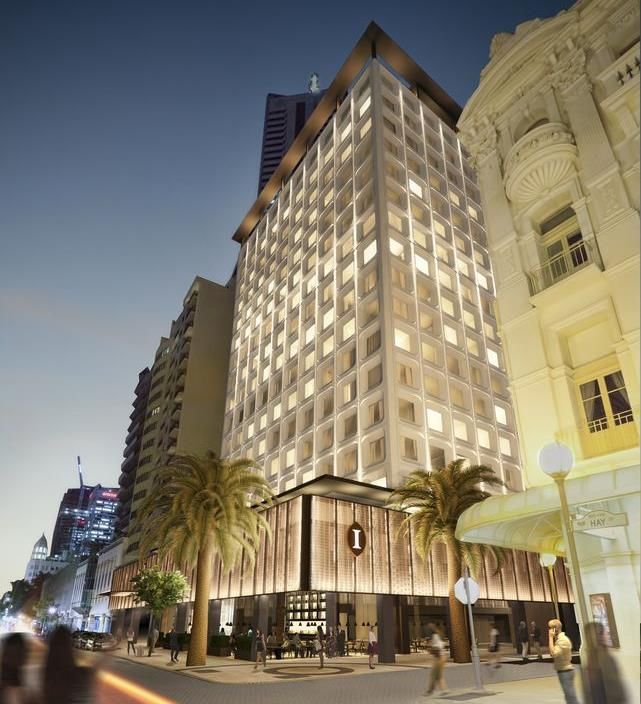
express written permission of STR is strictly Intercontinental Perth, Glossary & Sources of Data 61
prohibited FY19 8.9% Crystalbrook Collection – The Riley Cairns,
The Calile Brisbane
P1 www.dransfield.com.au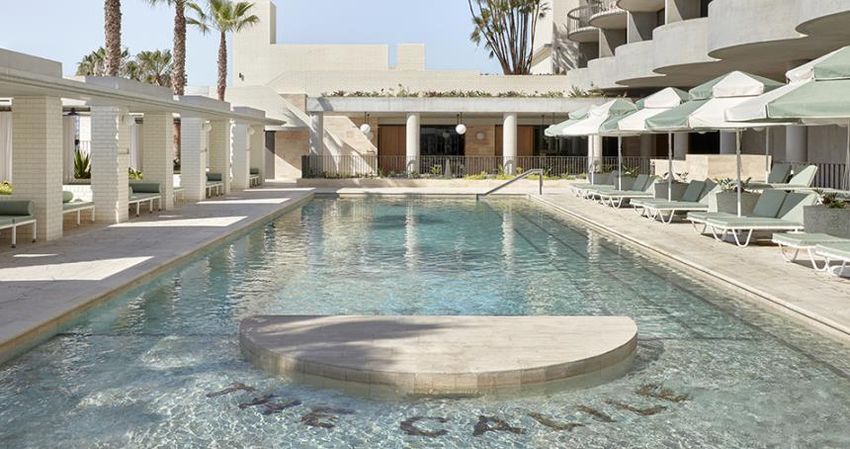
About
Dransfield
                                       Our core offering is the ability to integrate our service lines and skill sets into a cohesive solution for
DRANSFIELD is a specialist
                                       development, operations and overarching advice. Service streams include:
professional services organisation
advising the tourism, finance and      TRANSACTIONS                                    STRATA/COMMUNITY TITLE          ADVISORY AND FINANCE
property industries.                   • Agency                                        • Scheme Concepts               • Operations
Our experience includes a wide
                                       • Operator Selection                            • PDS & Prospectus              • Feasibility & Best Use Studies
                                       • Due Diligence                                   (AFS Licensed)                • Strategic Consulting
range of property and business
                                       • Vendor Representation                         • Offer Structure               • Restructuring Services
related projects involving over
75,000 hotel rooms and numerous        • Bid Advisory                                  • Project Design and            • Investment Risk Analysis
                                       • Transaction Management                          Commercialisation             • Portfolio Assessment
food and beverage outlets in more
than 700 hospitality enterprises       • Leasing                                       • Operator Selection            • Debt & Equity Sourcing
throughout Australia and Asia.                                                         • Project Marketing             • Refinancing
                                       DEVELOPMENT
                                       • Development Management                        EXPERT’S REPORTS                • Valuation Management
For further information on the range
of services we provide, and the ways   • Commercialisation of Design                   • Independent Expert Reports    • Joint Venture/Equity
                                                                                         – Prospectus                    Participation
in which we can assist you, please     • Integration of Development
visit our website                        & Operations                                    – PDS                         • Independent Advisory
www.dransfield.com.au                  • Feasibility Assessment                        • Expert Witness                • Debt Restructuring
or contact us.                         • Planning                                        – Independent Court Reports   DISCLAIMER This document contains both
                                                                                                                       qualitative and quantitative statements concerning
                                       • Design                                          – Litigation Support          the future performance of hotel and property
                                                                                           & Management                markets, which may or may not prove to be correct.
                                                                                                                       Dransfield & Co Pty Ltd (Dransfield) does not make
                                       SHARED OWNERSHIP
DEAN DRANSFIELD                                                                        ASSET MANAGEMENT
                                                                                                                       any representation or warranty, express or implied
                                       • Scheme Concept                                                                that such statements will prove correct, or that
                                                                                                                       estimates or forecasts contained in this document
Director & Owner                       • Responsible Entity                            • Total Asset Management        will be achieved. The projections contained in this
                                                                                                                       document are estimates and represent only one
                                       • Marketing & Sales                             • Strategy Development &        possible result, depending on the assumptions made.
T +61 2 8234 6644                                                                        Implementation                Potential users of these forecasts should satisfy
                                       • Feasibility                                                                   themselves as to the current market conditions.

E dean.dransfield@dransfield.com.au                                                    • Operations Implementation     Individual hotel performance may differ to market
                                       • Advisory                                                                      averages. Due to the difficulty in predicting future
                                                                                       • Financial & Operational       events, the assumptions we have used may not hold
                                                                                                                       true. Dransfield accepts no responsibility for any
                                       IMPORTANT: STR data remains the property          Reporting                     action taken or any failure to act, in reliance upon the
                                       of STR. Any republication or other re-use of                                    information contained in this document. No liability
                                       any data within this document without the       • Stakeholder Management        for negligence or otherwise is accepted by Dransfield
                                                                                                                       directly or indirectly in relation to the material
                                       express written permission of STR is strictly
                                       prohibited
                                                                                       • Refurbishment                 contained in this document.

                                                                                                                       Hotel Futures 2019 was compiled by Dean Dransfield,
P2   www.dransfield.com.au                                                                                             Raq Pustetto, Scot McLaughlin, Grace Lam, and
                                                                                                                       Hayden Longmuir © June 2019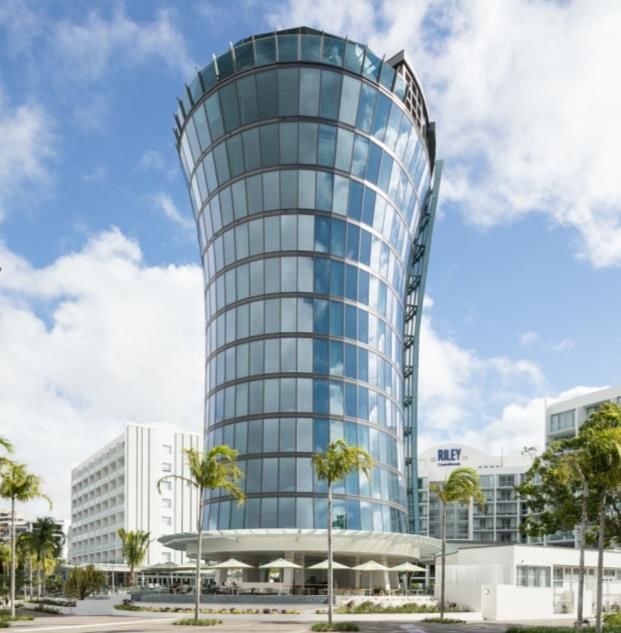
HF2019 Snapshot
                                                                             Long term RevPAR growth averaging 3.3% per annum, and 4.1% from FY2020, impacted
                                                                             by a soft short and medium term as new supply impacts both occupancy levels and rate
                                                                             confidence. Very high occupancy levels throughout the forecast underpin growth

FY2018 Actual                                                                                            TOTAL AUSTRALIAN MAJOR CITIES (WEIGHTED)
In FY2018, the Major Australian Cities Hotels recorded 2.6% revenue growth (RevPAR). Rates
improved 2.2% as high occupancy persisted, improving marginally and staying above 80%. Growth                                                                                                    $2018
                                                                                                                     Sample          Sample
was, however, slightly below our 3.8% expectations                                                         Year                                         ARR        % Chng RevPAR % Chng           Real      Occ
                                                                                                                      Size          Coverage
                                                                                                                                                                                                RevPAR
RevPAR Forecast                                                                                            HISTORICAL – STR
The long term revenue forecast is above inflation RevPAR growth averaging 3.3% p.a.                        FY2017                                      $193.55               $155.01                       80.1%
•   The forecast represents a slight downgrade to prior expectations, although remains strong and          FY2018        92,838           76%          $197.90      2.2%     $159.02    2.6%    $155.75    80.4%
    underpinned by high occupancy levels despite material supply growth expectations over the next
    five years
                                                                                                                                                                                                 $2018
•   Long term growth outperforms the medium term with supply absorption impacting the near term.                                  Supply Demand
                                                                                                         Year       Rooms*                               ARR        % Chng RevPAR % Chng          Real      Occ
    We expect long term growth for all 10 cities, with some periods of volatility across all markets                              % Chng % Chng
                                                                                                                                                                                                RevPAR
Supply                                                                                                     FORECAST - DRANSFIELD
                                                                                                          FY2019     112,503       4.1%         1.7%    $197.62      -0.1%    $155.01   -2.5%   $148.84    78.4%
Hotel Futures 2019 represents a small increase in absolute supply, with 3.8% p.a. growth expected
long term to FY2027. We anticipate the market will deliver 43,000 additional rooms, which will be         FY2020      117,913      4.8%         4.3%    $202.14      2.3%     $157.77   1.8%     $148.17    78.1%
fully absorbed. The supply growth uplift to prior expectations represents a relatively small 0.2% p.a.
over the life of the forecast                                                                             FY2021     123,763       5.0%         5.3%    $207.29      2.5%     $162.39   2.9%     $149.15   78.3%

•   The uplift is largely concentrated in Melbourne, as developers continue to recognize favorable        Avg FY 19-21             4.6%         3.8%                 1.6%               0.7%    $148.72    78.3%
    demand fundamentals. Sydney activity has been slightly wound back as short term                       FY2022     130,878       5.7%         5.7%     $213.16     2.8%     $166.91   2.8%     $149.12   78.3%
    underperformance reflects negatively on highest and best use against both office and residential
                                                                                                          FY2023     137,774       5.3%         5.2%     $219.71     3.1%     $171.91   3.0%     $149.41   78.2%
•   Construction activity has become the dominant pipeline component this year, representing almost
                                                                                                          FY2024     143,133       3.9%         4.3%    $226.27      3.0%     $177.72   3.4%     $150.25   78.5%
    half of the pipeline, increasing from just over a quarter last year
                                                                                                          FY2025     145,380       1.6%         3.3%    $236.41      4.5%     $188.83   6.2%     $155.29   79.9%
Demand
                                                                                                          FY2026     148,108       1.9%         3.3%    $247.57      4.7%    $200.48    6.2%    $160.38    81.0%
Hotel Futures 2019 long term demand forecast is for average annual growth of 4.0% to FY2027
                                                                                                          FY2027     150,844       1.8%         3.3%    $259.29      4.7%     $212.93   6.2%     $165.71    82.1%
•   Dransfield’s demand profile has been slightly upgraded taking regard of moderate upgrades to
                                                                                                          Avg FY22-27              3.4%         4.2%                 3.8%               4.6%    $155.02    79.7%
    supply expectations, favorable movement in the exchange rate and continued improvements to
    infrastructure and attraction development                                                             Total Forecast Avg
                                                                                                                                   3.8%         4.0%                 3.1%               3.3%    $152.92    79.2%
                                                                                                          FY 2019-2027
•   The forecast for demand remains above supply expectations in the long term
Average Room Rate (ARR)
                                                                                                                                                                                                       Source: STR
Long term rate growth expectations averaging 3.1% p.a. are expected. These are underpinned by
high occupancy levels for the entirety of the forecast
•   Rate growth through the short and medium term are below the long term forecast, impacted by
    arriving supply and conservative hotelier behaviour in some markets
•   Our rate growth expectations have reduced relative to prior forecasts with lesser pressure
    generated from a slightly softer supply and demand equation, reflecting in conservative rate
    behaviour

    P3      www.dransfield.com.au
AUSTRALIA AT A GLANCE FY2018
This is the 22nd edition of Hotel Futures. We report on major Australian hotel markets during FY2018
with long term forecasts to FY2027

• The Australian Major City Hotel market, as captured by STR, recorded modest               AUSTRALIAN MAJOR CITY HOTEL (STR)
    2.6% revenue growth (RevPAR) in FY2018. This was below our 3.8%                         FY2018 PERFORMANCE
    expectations
•   Australian City supply increased by 3.7%, which was slightly exceeded by
    demand growth of 4.0%, pushing occupancy levels up 0.3 points to a very                                FY2018 Performance
    healthy 80%
•   Tourism Research Australia’s visitor night data for FY2018 revealed growth of                           Rate                 RevPAR
                                                                                            Location                 Occupancy
                                                                                                           Growth                Growth
    4.8% in capital cities, as an indirect guide to short term accommodation demand,
    which was slightly lower                                                                Adelaide        3.6%       80.2%      5.1%
      – International visitor nights in capital cities increased 3.0% to 210M               Brisbane        0.9%       75.5%      4.1%
      – Domestic visitor nights in capital cities grew 8.2% to 116M
                                                                                            Cairns & P.D    5.5%       78.6%      6.0%
•   Rate growth of 2.2% was slightly behind 2.6% expectations with six cities
    recording growth below the 3% benchmark                                                 Canberra        2.3%       78.2%      5.0%
•   Seven of the ten major cities experienced year on year RevPAR growth:
                                                                                            Darwin          0.8%       75.2%      8.4%
      – Darwin was the biggest mover, increasing 8.4% following several years of
         decline                                                                            Gold Coast      5.6%       72.8%      7.5%
      – Cairns, Gold Coast, Adelaide and Canberra all grew more than 5%
                                                                                            Hobart          2.8%       78.8%      -2.1%
      – Brisbane stemmed their market reset, improving steadily despite continued
         additional supply                                                                  Melbourne       -0.1%      84.4%      -1.2%
      – Sydney and Melbourne maintained Occupancy above 87% and 84%                         Perth           -3.6%      76.2%     -6.0%
         respectively, while Adelaide also joined the 80% club
      – Perth, Hobart and Melbourne all contracted, impacted by additional supply           Sydney          4.5%       87.8%      3.2%

                                                           *Source: DHR internal research   Total Market    2.2%       80.4%      2.6%

                                                                                                                                  Source: STR

P4      www.dransfield.com.au
AUSTRALIA AT A GLANCE FY2018
In FY2018 there was varied performance across the country, with major city RevPAR growth averaging 2.6%, with a high of 8.4%
growth and a low of -6.0% contraction. Subdued rate growth was evident across the high occupancy markets of Sydney and
Melbourne, although they remain the overall performance benchmark. Recent strugglers Darwin and Brisbane appeared to turn the
tide, but this is short lived for Darwin. Adelaide and Canberra continue to thrive, while Hobart and Perth record declines
REVPAR – ACTUAL & % CHANGE FY2018 OCCUPANCY – ACTUAL & % CHANGE FY2018
$250 10% 100% 6%
8%
KEY 4% KEY
$200 6% 80%
4%
2%
$150 2% 60%
RevPAR Occ
0% 0%
$100 -2% 40%
-2%
-4% % CHANGE
% CHANGE (2nd Axis)
$50 -6% (2nd Axis) 20%
-4%
-8%
$0 -10% 0% -6%
Average Average
Hobart
Adelaide
Adelaide
Melbourne
Hobart
Darwin
Darwin
Gold Coast
Cairns
Gold Coast
Cairns
Australia
Melbourne
Australia
Brisbane
Brisbane
Perth
Sydney
Canberra
Sydney
Canberra
Perth
% CHANGE % CHANGE
(2nd Axis) (2nd Axis)
Source: STR Source: STR
ARR – ACTUAL & % CHANGE FY2018 SUPPLY AND DEMAND % CHANGE FY2018
$300 8% 16% 5%
KEY
6%
$250 KEY 12% 4%
Supply
4% % CHANGE
$200
8% 3%
2%
ARR Demand
$150
% CHANGE
0% 4% 2%
$100
-2% % CHANGE
(2nd Axis) 0% 1% Aust Avg Demand %
$50 -4% CHNG (2nd Axis)
$0 -6% Average -4% 0%
Hobart
Adelaide
Darwin
Melbourne
Gold Coast
Cairns
Australia
Australia
Brisbane
Sydney
Canberra
Adelaide
Perth
Hobart
Darwin
Gold Coast
Melbourne
Cairns
Australia
Brisbane
Sydney
Canberra
Perth
Demand
% CHANGE
Supply
Aust Avg Supply %
(2nd Axis) CHNG (2nd Axis)
Source: STR Source: STR
P5 www.dransfield.com.au
AUSTRALIA AT A GLANCE

Short & Medium Term Outlook
FY2019 National Outlook                                                                                        AUSTRALIAN MAJOR CITY HOTEL MARKET
•   RevPAR for FY2019 is anticipated to slightly unwind following 8 consecutive years of growth. A 2.4%        REVENUE FORECASTS
    decline is expected, with reduced occupancy levels and stagnant rate outcome
•   The decline represents a moderate downgrade to Hotel Futures 2018 RevPAR expectations which                                Forecast Average RevPAR Growth
    were for growth of 2.8% and reflects a change in short term market sentiment
•   Occupancy levels are likely to fall just under 2 percentage points, albeit to a still high 78.4%. Demand                          Short       Medium         Long
                                                                                                                Location
    growth of just 1.7% is not immediately absorbing moderate supply                                                                 FY2019       FY19-21       FY19-27

•   Resulting rate growth underperformance was both a factor of the softer occupancy environment,               Adelaide              -2.7%        -0.1%         2.6%
    and conservative/defensive hotelier behavior in some markets
                                                                                                                Brisbane              -4.9%         1.7%         4.9%

Medium Term Outlook to FY2021                                                                                   Cairns                -2.2%        0.7%          2.6%

•   RevPAR growth averaging a low 0.7% p.a. is expected over the medium term, dragged by soft                   Canberra              2.7%         2.7%          3.2%
    FY2019 performance
                                                                                                                Darwin               -20.6%        -3.1%         2.2%
•   RevPAR growth is below the 2.6% p.a. previously expected, impacted by softer demand and
    subsequent rate growth. We expect this softer short term forecast will strengthen through the longer        Gold Coast            -1.1%         1.0%         3.3%
    term, with stronger back ended opportunities eventuating as weaker performance metrics lead to
    lesser/later development activity, which should see occupancy and rate pressures return                     Hobart                8.9%          1.3%         2.6%

•   Expected new supply has been slightly delayed, although remains high relative to historical levels.         Melbourne             0.3%         0.8%          2.8%
    Annual average growth of 4.6% is now expected compared to 5.3% previously
                                                                                                                Perth                 -3.8%        -2.3%         3.8%
•   Demand growth expectations averaging 3.8% p.a. over the medium term are expected, which are
    unlikely to immediately absorb all new supply. The softer demand outlook is a factor of short term          Sydney                -3.8%         1.1%         3.2%
    supply delays blocking growth in some cities, and some weaker visitation in other cities.
                                                                                                                Total Market          -2.5%        0.7%          3.3%
•   Occupancy is expected to remain high through the medium term, albeit slightly reduced. We expect
    occupancy will soften 1-2 percentage points over this period. The majority of the occupancy
    compression has already occurred through the first three quarters of FY2019
•   Rate growth expectations are for a relatively low 1.6% growth p.a. This has reduced from 3.3% p.a.
    expectations. Rate has been impacted by a slightly softer supply and demand equation which is
    generating less upward pressure. A conservative hotelier strategy despite many high/extreme
    occupancy markets is similarly contributing to the below inflation growth.

P6       www.dransfield.com.au
AUSTRALIA AT A GLANCE

Long Term Outlook to FY2027
Long Term Outlook to FY2027                                       TOTAL AUSTRALIAN MAJOR CITIES (WEIGHTED)
•   Australian major city RevPAR is forecast to grow at a                                                                                            $2018
    healthy average of 3.3% p.a. over the long term and 4.1%                                Supply   Demand
                                                                   Year           Rooms                        ARR      % Chng   RevPAR    % Chng     Real    Occ
    after FY2019                                                                            % Chng   % Chng
                                                                                                                                                    RevPAR
    – A positive supply and demand equation and sustained
      high occupancy levels will create rate growth                                                              FORECAST
      opportunities
                                                                   FY2019         112,503    4.1%     1.7%    $197.62    -0.1%   $155.01    -2.5%   $148.84   78.4%
    – Despite the positive overall outlook, the forecast
      represents a downgrade to prior expectations, impacted
      by recent hotel demand underperformance, a moderate          FY2020         117,913    4.8%     4.3%    $202.14    2.3%    $157.77    1.8%    $148.17   78.1%
      supply arrival schedule which has slightly increased and
      illogical rate behavior in some markets
                                                                   FY2021         123,763    5.0%     5.3%    $207.29    2.5%    $162.39    2.9%    $149.15   78.3%
    – Growth expectations are still well above recent history,
      which averaged 2.2% p.a. over the last 5 years
                                                                   Avg FY 19-21              4.6%     3.8%               1.6%               0.7%    $148.72   78.3%
•   Supply expectations are for 3.8% growth p.a. representing a
    minor increase to Hotel Futures 2018, although largely
    offset by increases to demand expectations                     FY2022         130,878    5.7%     5.7%    $213.16    2.8%    $166.91    2.8%    $149.12   78.3%

•   Live projects (recently completed, under construction,
                                                                   FY2023         137,774    5.3%     5.2%    $219.71    3.1%    $171.91    3.0%    $149.41   78.2%
    proposals) have increased considerably, with 49% of the
    pipeline having now broken ground
                                                                   FY2024         143,133    3.9%     4.3%    $226.27    3.0%    $177.72    3.4%    $150.25   78.5%
•   Our forecast assumes 43,000 additional rooms to enter the
    market over the next 9 years, with concentration through
    the first 5 years                                              FY2025      145,380       1.6%     3.3%    $236.41    4.5%    $188.83    6.2%    $155.29   79.9%
•   Supply is expected to be fully absorbed over the long term,
    albeit some slight occupancy softening to arise through the    FY2026         148,108    1.9%     3.3%    $247.57    4.7%    $200.48    6.2%    $160.38   81.0%
    middle of the forecast, as sustained supply comes to market
•   Demand has been marginally upgraded, with 4.0% p.a.            FY2027      150,844       1.8%     3.3%    $259.29    4.7%    $212.93    6.2%    $165.71   82.1%
    growth now expected, as capacity constraints ease. Access
    infrastructure and flight schedules are also improving, and
                                                                   Avg FY22-27               3.4%     4.2%               3.8%               4.6%    $155.02   79.7%
    the diversity in demand drivers across many cities is
    growing
                                                                   Total Forecast Avg FY
•   Occupancy levels have been slightly tempered, although         2019-2027
                                                                                             3.8%     4.0%               3.1%               3.3%    $152.92   79.2%
    don't drop below a still high 78% average, and return above
    80% in the late term.

P7       www.dransfield.com.au
CITY SUMMARIES
                 Long Term
City               RevPAR        Comment
                  (avg. p.a)

                                 In FY2018 Adelaide RevPAR growth of 5.1% was strong, albeit half of this has been given back through the start of FY2019. A significant shift from supply proposal
Adelaide            2.6%         activity to construction occurred this year and will deliver material supply through FY2021-FY2023., though this is expected to be fully absorbed. Long term RevPAR
                                 expectations of 2.6% growth p.a. are a little underwhelming given the high occupancy environment, impacted by conservative rate growth behaviour

                                 In FY2018, Brisbane Hotels stemmed the persistent market decline of the last five years, recording demand led RevPAR growth of 4.1%. Another big year of new
                                 supply will arrive during FY2019 which will impact short term growth, although this should be short-lived. A once in a generation improvement to tourism
Brisbane            4.9%
                                 infrastructure and improved demand drivers will lead growth in this cycle, attracting a new range of visitors. Long term RevPAR expectations are positive with 4.9%
                                 annual growth expected, with backend outperformance

                                 In FY2018, Cairns & Port Douglas RevPAR continued to grow, recording 6.0% improvement and marking the 8th consecutive year of growth. Heavy rain and cyclone
Cairns &
                    2.6%         activity has affected demand in FY2019, with occupancy decline compounded by new supply. Supply arrivals will continue for the next couple of years which will
Port Douglas                     limit growth opportunity as its absorbed. Long term RevPAR expectations are for 2.6% growth p.a., with short and medium term underperformance

                                 In FY2018, Canberra RevPAR continued to perform well, increasing 5% following a very strong prior year. Growth has continued in FY2019, albeit at a lesser rate.
Canberra            3.2%         Supply proposal activity has increased in light of robust recent performance and positive corporate, tourism and education sector sentiment. Long term RevPAR
                                 expectations of 3.2% growth are slightly above inflation targets upheld by moderate rate growth opportunities in a stable occupancy market

                                 In FY2018, Darwin posted minor RevPAR growth following a large and sustained decline over the last four years. The turn was short lived with FY2019 expected to
                                 record a very high 20% decline as the structural composition of demand resets, seeing occupancy levels fall 15 percentage points. Corporate demand softness has
Darwin              2.2%
                                 led to cuts in access, with air capacity materially reducing. This will no doubt affect medium and perhaps long term occupancy while yielding opportunities also take
                                 a hit. Long term RevPAR expectations are for growth of 2.2% p.a, severely dragged by a 20% decline in the short term

                                 In FY2018, Gold Coast hotels reaped the rewards from Commonwealth Games induced visitation, and also performed well across the balance of the year. Looking
Gold Coast          3.3%         forward, we expect a moderate long term outlook with subdued growth over the medium term as the market unwinds from the Commonwealth Games, and new
                                 supply enters. Long term RevPAR expectations are for 3.3% growth p.a, underpinned by a positive supply and demand ratio

                                 In FY2018, double digit supply growth led to an occupancy driven RevPAR decline. Strong demand growth absorbed the new supply through the high season,
Hobart              2.6%         however the additional rooms were unable to adequality fill in the shoulder. The supply pipeline remains fully loaded with proposal activity above market needs if all
                                 eventuate. Long term RevPAR expectations are for 2.6% p.a. with upside and downside linked to supply development behaviour

                                 In FY2018, Melbourne hotels continued to trade at high levels despite a slight RevPAR decline. Sustained supply additions over the next 5-6 years will test equivalent
Melbourne           2.8%         demand growth and operators may respond with rate competition. We expect occupancy levels will slightly depress through the height of supply arrivals, largely
                                 upheld through considerable growth in demand generators over the parallel period. Full forecast expectations to FY2027 are for 2.8% growth p.a.

                                 In FY2018, Perth recorded a 6% decline as supply continued to arrive. Almost three quarters of the remaining pipeline is under construction and is due to arrive over
Perth               3.8%         the next 4 years, which will hamper medium term growth. Projects which haven't broken ground are at high risk to complete. The long term outlook remains positive,
                                 although 2-3 more years of volatility is expected as supply deliveries peak. Full forecast expectations to FY2027 are for 3.8% growth p.a.

                       In FY2018, Sydney hotels reacted well to new supply, growing RevPAR by 3.2%. This has reversed in FY2019 with a minor drop in occupancy leading to a larger drop
                       in rates, despite market wide occupancy above 87%. Demand growth continues to be limited by room availability, which should be eased through the medium term
Sydney        3.2%     with consistent moderate supply expected to arrive. Occupancy will be impacted by this supply, although this is expected to be absorbed over the longer term. Long
P8     www.dransfield.com.au
                       term RevPAR forecasts are only slightly above inflation expectations despite ultra high occupancy. Growth appears restrained by nervous hoteliers who are not just
                       missing rate growth opportunities, but actually reducing them! Full forecast expectations to FY2027 are for 3.2% growth p.a.
CITY SUMMARIES
MAJOR CAPITAL CITY REVPAR COMPARISON SECONDARY CAPITAL CITY REVPAR
Australia Brisbane Melbourne Perth Sydney Australia Canberra Hobart Adelaide
$350 $225
$300 $200
$175
$250
$150
$200 $125
$150 HF2018 $100
$75
$100
$50
$50 $25
$0 $0
2003
2005
2007
2009
2011
2013
2015
2017
2019
2021
2023
2025
2027
2003
2009
2005
2007
2011
2013
2015
2017
2019
2021
2023
2025
2027
Financial Years Financial Years
LEISURE BASED CITY REVPAR Relative RevPAR
• Average RevPAR growth of 3.3% p.a. across Australia to FY2027, with Sydney
Australia Cairns Gold Coast Darwin leading the way. Sydney RevPAR is more than $55 above Melbourne and extends
$225 the gap as we move through the forecast period
$200 • Melbourne will absorb material supply for the next six years, impacting both
occupancy and rate, and moving behind the national RevPAR average (albeit
$175 underpinned by a strong Sydney), despite moderate growth just below 3%
$150
• Following market resets, Brisbane and Perth are both set to move into their upward
$125 swing following softness caused by material additional supply conceived through
$100 the mining boom. They will both make some ground on Melbourne through the
back half of the forecast. Perth still has slightly longer to run before the upturn,
$75
however, both cities are primed for long term success, with refreshed and
$50 diversified supply, and an improved demand environment
$25 • Adelaide upside is evident given their occupancy position, with soft rate growth
$0 holding the market below Hobart and Canberra on an absolute level. The
emergence of individual projects in Hobart could swing the RevPAR considerably
2003
2005
2007
2009
2011
2013
2015
2017
2019
2021
2023
2025
2027
given the market’s small size and seasonality
Financial Years • Darwin resets once again, with the evaporation of the last high value corporate
contracts seeing them post the lowest national RevPAR, a position they hold for
the length of the forecast
• Leisure markets of Gold Coast and Cairns are well placed to capture holiday
makers, this is both a function of broader tourism infrastructure including access, as
well as new and refurbished hotel product.
P9 www.dransfield.com.auTransaction TRENDS
Hotel transactions reached $1.7B in 2018 and $700M though the first five months of 2019. We expect transaction activity will increase in the next
2-3 years as capital flows which are peaking in the development space, transfer back to sales as developers recycle the capital for new projects
HOTEL TRANSACTION HISTORY: 2013 – 2019 (YTD May 2019)
• Transactional volume continues to be constrained by stock
availability, with many owners happy to sit tight from a good entry 4.0 70
Number of Transactions
point and back further cap rate compression to add value to their 3.5 60
holdings
Sales Volume ($b)
3.0
50
• Despite reduced asset availability, there has been more market 2.5
activity than many market participants expected in 2018, with in 40
2.0
excess of $1.7B of assets changing hands 30
1.5
• Through the first 5 months of 2019, transaction volume has reached 20
1.0
$700M, whilst there are a number of large transactions which are
close to exchange, but are not quite there yet with transaction 0.5 10
timetables elongating 0.0 0
2013 2014 2015 2016 2017 2018 YTD2019
• A number of the potential deals have a development perspective,
Value Transactions
which requires significantly more design, contractual and operating
comfort than sales on completion or for established product * Based on published sales prices for reported sales and Dransfield estimates
• Exuberant Asian money has largely gone, although this has been
replaced by measured international and domestic buyers
• A- and B+ stock is facing some challenges as vendor price
expectations reset into normal ranges in pricing and upper limit
grasping eases. The quality of stock has also drifted towards
investment, from trophy
• Capitals flows continue to push towards development, with increases
in the development pipeline. Many of these developers are not long
term holders and will look to recycle capital either through the
development process (fund through), on completion or as income is
stabilised. This should see asset availability increase in the next few
years
• Notable transactions for the 12 months to May 2019 are included over
page.
Pullman
Westin Olympic
Perth Park
P 10 www.dransfield.com.auTransactions
MAJOR TRANSACTIONS BY VALUE: April 2018 – May 2019
Approx. Price
Property Rooms Purchaser Origin Approx. Price
Per Key
ADIA Homebush Portfolio (Pullman, Novotel,
831 AXA Investment Managers-Real Assets Australia $330m $398k
Ibis) & Novotel Canberra
Westin Perth 368 YTL Hospitality REIT Malaysia $200m $543k**
Pullman on the Park Melbourne 419 iProsperity Asia $156m $372k
Bell City - Mantra & Breakfree, Melbourne 844 Gaw Capital Hong Kong $127m $151k
Next Hotel, Brisbane 304 Salter Brothers Australia $113m $371k
Elanor Hospitality & Accommodation Fund
374 Elanor Metro and Prime Regional Hotel Fund Australia $104m $278k
Portfolio*
Ibis Styles Brisbane 367 Legend Land Singapore $100m $272k
Adabco Boutique Hotel & Mayfair Hotel,
239 Elanor Luxury Hotel Fund Australia $99m $414k
Adelaide
Quincy, King St/Flinders Lane, Melbourne 241 Interglobe (Kapil & Rahul Bhatia) India $91m $378k
Novotel Twin Waters, Sunshine Coast 361 Shakespeare Property Group Australia $89m $245k
Hilton Hotel Surfers Paradise 169 Jerry Schwartz Australia $70m $414k
Felix by 8Hotels, Baxter Road, Sydney 150 Ascott REIT Singapore $60m $404k
Park Regis Hotel, Sydney 122 Yeh Group Singapore $54m $444k
Aloft Perth 224 Hiap Hoe Singapore $51m $229k
LinQ Hotel, City Road, Melbourne 162 Next Story Singapore $45m $278
* Portfolio consists of: Ibis Styles Port Macquarie, Ibis Styles Tall Trees, Mantra Pavilion Wagga Wagga, Mantra Wollongong, Parklands Resort Mudgee, Peppers Cradle Mountain Lodge
** Price includes existing DA approval for 36,545sqm of office, on an already constructed base
P 11 www.dransfield.com.auSUPPLY FORECAST
Supply growth expectations have increased, however remain slightly below demand growth forecasts. Construction activity
becomes the dominant component of the long term pipeline as proposals activate
National Supply - Actual and Outlook Supply Cycle Comparison – HF2018 vs HF2019
• In FY2018, we estimate that Major City supply stock increased by a relatively high 3.7%, • Australian Major City long term supply forecasts have increased 2,700 rooms over 9 years,
which is equivalent to 3,800 new rooms. This opening activity is above the 2.2% growth which is relative to a base of just over 100,000 rooms. The increase represents a relatively
recorded in the prior year, which itself was one of the largest year on year growth rates small supply uplift of 0.2% p.a. over the forecast life and is expected to be fully absorbed
over the last decade
• The identified live pipeline (construction and proposals) has infilled, increasing to 29,300
• Construction activity has doubled this year as we edge closer to the supply arrival peak rooms compared with 21,900 in the previous forecast
in FY2022. Rooms under construction now make up 49% of the total pipeline
• Certainty has improved with the transition of Proposals to Construction, and Market
• The Hotel Futures 2019 forecast represents an upgrade in absolute supply levels to prior Response allowances being taken up by specific Proposals
expectations. Long term demand expectations exceed supply over the long term,
– Construction activity has significantly increased to 19,500 rooms compared with 9,900
however, soft early indications for FY2019 are likely to produce some occupancy
previously
contraction over the short and medium term which could temper back end supply
– Gross Proposed rooms (assuming 100% probability of all proposals) have subsequently
– In FY2019 supply is forecast to grow 4.1%, which is slightly below prior expectations.
decreased, albeit slightly, to 24,500 to which we have applied a blended 40% prospect of
This arises as some projects have been slightly delayed
completion, delivering 9,800 net rooms. Over the same period last year, our forecast
– Supply growth is expected to average 4.6% p.a. over the medium term to FY2021 anticipated 12,000 net rooms at 46%. The probability percentage reduction reflects
which is unlikely to be immediately absorbed. These rooms are fairly certain as the vast current projects being earlier in the planning process with higher completion risk following
majority are under construction more projects breaking ground
– The last three years of the supply forecast have been reduced following the increase • Market Response for the forecast period to FY2026 allows for an additional 10,700 rooms
through the front end. Feasibility and financing has become tougher in some markets above the identified and currently live projects and proposals
following the raft of new rooms expected and the subsequent effect on rate providing
– This is a 4,700 room decrease to prior expectations, responding to the uplift and transfer
self regulation
to Construction and Proposal activity over the last year
– Our national long term forecast is for supply to increase by 3.8% p.a. over the next 9
years to FY2027 • Market Response to FY2026 now accounts for 27% of all new supply compared with 41% in
the previous forecast
Supply Cycle Comparison FY2019 to FY2026 : HF2018 vs HF2019 Supply by Type – Short, Medium and Long Term: Comparative Forecast to FY2026
Hotel Futures Hotel Futures FY19 FY19-FY21 FY19-FY24 FY19-FY26
Var.
2018 2019 1 Yr 3 Yrs 6 Yrs 8 Yrs
Construction & Recently
9,900 19,500 9,600 Construction 98% 88% 56% 49%
Completed
Net Proposals Proposals
(% probability applied)
12,000 9,800 -2,200 0% 0% 26% 24%
Market Response 15,400 10,700 -4,700 Market Response 2% 12% 18% 27%
Supply Pipeline 37,300 40,000 2,700
Supply Pipeline Uplift 1.9%
Average Annual Uplift (9 years) 0.2%
P
12 www.dransfield.com.au
*Boundaries for Hotel Futures 2019 have changed. We have amended Hotel Futures 2018 data in this table to reflect a like for like regionSUPPLY national
Supply expectations have increased 1.9% or 0.2% p.a. in Hotel Futures 2019 following a large movement from proposals to
the construction phase. The increased volume presents through FY2022-FY2024 as new proposals have emerged,
however slight delays are expected over the medium term as feasibility and funding concerns materialise in some markets
MAJOR CITY SUPPLY GROWTH PERFORMANCE AND FORECASTS TO FY2027 – ROOMS
Rooms Occ.
8,000 83%
7,000 81%
6,000 79%
5,000 77%
4,000 75%
3,000 73%
2,000 71%
1,000 69%
0 67%
-1,000 65%
FY2014 FY2015* FY2016* FY2017 FY2018 FY2019 FY2020 FY2021 FY2022 FY2023 FY2024 FY2025 FY2026 FY2027
Market Response Proposals Construction
Completed HF2018 Expectations Occupancy Act. & Exp. (2nd Axis)
P 13 www.dransfield.com.au
* In FY2015 and FY2016 we have normalised data following ABS data set
changes to reflect estimated actual new supply net of base calculation errorsSUPPLY Forecast 14
• Construction activity becomes the dominant pipeline component this year with a boom in SUPPLY BY TYPE COMPARISON - HF2018 vs HF2019: FY2019 to FY2026
development across many markets, and now accounting for 49% of the pipeline to FY2026
• Proposals are also being replaced at a faster rate than delivery expectations, absorbing the
•
Market Response Allowance
Across the country, markets are in various stages of the supply cycle:
HF2018 HF2019
– Brisbane leads the pack and will have largely completed their cycle closing out FY2019,
with 10% supply growth. Perth is similarly well advanced, with another two years of high
supply arrivals imminent
– Melbourne activity has surged in the last 12 months with a large movement of proposals 27% 27%
into the construction phase. These have been replaced, above prior expectations, giving 41%
Melbourne the mantle of the largest live pipeline of all capital cities 49%
– Sydney activity is progressing, albeit many projects have not yet started construction.
Significant additional scope for further rooms remains, with site availability and best use 32% 24%
comparisons continuing to frustrate development. Projects that have not commenced are
at higher risk than 12 months ago
– Hobart and Cairns are moving closer to their peak, with high levels of supply under
construction and due in the next couple of years. Both these markets are highly seasonal, 37,300 rooms 40,000 rooms
making feasibility difficult. Hobart proposal activity remains high and at considerable risk.
The outcome of several large developments could easily swing the market upwards or
downwards
– Adelaide is slightly ahead of Canberra, with slightly higher construction activity and lesser
Market Response allowance
MAJOR CITY FORECAST SUPPLY GROWTH BY TYPE FY2019-2027
40,000 % denotes the percentage 12,000
growth based on the FY2018 51%
35,000 Actual 51% 29%
10,000
36%
30,000 36%
8,000
25,000
14%
20,000 25% 6,000
32% 45%
15,000
44% 4,000
10,000
2,000
5,000
0 0
Rooms Brisbane Gold Coast Melbourne Perth Sydney Rooms Adelaide Cairns Canberra Darwin Hobart
P Actual Construction Proposals Market Response Actual Construction Proposals Market ResponseARRIVALS AND DEPARTURES
In FY2018, international arrivals grew at a faster rate than resident INTERNATIONAL VISITOR ARRIVALS TO AUSTRALIA
departures (6.0% vs 4.2%). India’s growth was the most
substantial this period, increasing 5x the rate of the prior year 1,200,000
1,000,000
Visitor Arrivals
• International arrivals increased 6.0% in FY2018 to 9.1M with growth 800,000
displayed in all but two months. Three months recorded double digits
growth 600,000
• Average arrival growth for the last 3 years now sits at a very strong 8.3% 400,000
p.a.
• Three out of the top five international markets by visitor nights recorded 200,000
declines in FY2018, led by USA. India recorded significant growth and is
now the third largest contributor of visitor nights 0
China 10.6%, UK -8.7%, New Zealand -10.9%, U.S.A -11.1%, India 22.8% Jul Aug Sep Oct Nov Dec Jan Feb Mar Apr May Jun
• Visitor nights from Indonesia displayed the most significant increase of FY2016 FY2017 FY2018 FY2019
those outside the top 5, recording 12.8% growth
• Visitors nights from Asia now account for 58.1% of all visitor nights in
Australia, up 2.4% on the prior year RESIDENT DEPARTURES – SHORT TERM LESS THAN 1 YEAR
• In FY2019 (YTD January, 2019), growth has continued, with a 3.8% increase
1,400,000
on the prior corresponding period
1,200,000
Resident Departures 1,000,000
• In FY2018, domestic departures increased 4.2% to 11.1M 800,000
• All but one month recorded period on period growth
600,000
• Through the first half of FY2019 Resident departure growth has continued,
recording growth of 5.0% 400,000
200,000
0
Jul Aug Sep Oct Nov Dec Jan Feb Mar Apr May Jun
FY2016 FY2017 FY2018 FY2019
Source: ABS Overseas Arrivals and Departures Cat. 3401;
TRA State of the Industry 2017-18
P 15 www.dransfield.com.auDEMAND TRA FORECASTS
Tourism Research Australia’s long term visitor night forecast to FY2027, last published in August 2017, is for average annual growth of 3.9%
p.a. The larger city component is forecast to grow at a faster 4.9% p.a., whilst regional areas are expected to see 2.9% average annual growth
TRA Domestic Forecasts TRA FORECAST VISITOR NIGHT MOVEMENT – Capital Cities to FY2027
Domestic visitor night forecasts to FY2027 are for 2.3% growth p.a, and slightly
7.0%
higher for capital cities at 2.4% p.a
• In FY2018 domestic visitor nights in capital cities grew 8.2%, well above 6.0%
expectations. Melbourne, Adelaide and Perth recorded double digit growth,
whilst, Sydney and Queensland Capitals recorded 5%+ growth. Hobart and 5.0%
Darwin were the worst performing, each contracting by more than 5% 4.0%
• Long term city growth expectations of 2.4% p.a. is marginally stronger than
2.3% for regional areas. In FY2027, regional nights will make up 64% of the total 3.0%
nights which is similar to current levels
2.0%
• Nights for the purpose of Business are expected to grow at the fastest pace
over the long term to FY2027 (4.2% p.a. to 96M), with the larger VFR (1.9% p.a. 1.0%
to 125M) and Holiday (1.5% p.a. to 170M) markets growing slower
0.0%
• Over the long term, domestic visitor nights are expected to reach 421M by
FY2027
TRA International Forecasts International Domestic Total
Long term International visitor night forecasts to FY2027 are for 5.6% growth p.a. Source: TRA State and Territories Forecast 2017 - 2 August 2017, State of the Industry 2018, Tourism Research Australia,
Canberra. International Visitor Survey, November 2018, Domestic Visitor Survey, December 2018.
across the country with capital cities slightly higher at 5.8% p.a
• In FY2018 international visitor nights in capital cities increased by 3.0%, well Outbound Travel Forecasts
below expectations. The larger cities of Sydney, Melbourne and Brisbane/Gold
Coast all recorded growth of 2-4%. Significant movement was recorded in Long term resident departure expectations to FY2027 are in line with visitor
Hobart (up 58%), Canberra (up 24%) and Darwin (down 21%) night growth expectations of 3.9% p.a.
• Long term city growth expectations of 5.8% p.a. is stronger than 5.0% for • In FY2018 resident departures increased 4.2%, largely inline with 4.0%
regional areas. In FY2027, city nights will make up an 82% component of the expectations
total nights which is slightly higher than the current 81% • New Zealand, Indonesia and the United States are the primary
• VFR travellers is the fastest growing segment, forecast to average 6.7% p.a. destinations, maintaining these podium positions for the life of the
This is above 5.7% p.a. growth for holiday makers and 3.2% growth for business forecast
purposes • China will see the fastest growth of all the major destinations, averaging
• Total international visitor nights are expected to reach 471M by FY2027 4.4% p.a. long term
P 16 www.dransfield.com.auDEMAND Dransfield Outlook
Dransfield’s demand forecast for major city hotel rooms has been slightly upgraded taking regard of moderate upgrades to supply
expectations, favorable movement in the exchange rate and continued improvements to infrastructure and attraction development. Our
forecast is for long term average annual growth of 4.0% which is slightly above previous expectations
National Demand FY2018 – Major Cities
Visitor night statistics reported moderate growth in FY2018. Growth was slightly DRANSFIELD LONG TERM DEMAND FORECAST
below expectations
• Tourism Research Australia recorded a 4.8% increase in total visitor nights 6.0%
across Australian Major Cities in FY2018. Visitor nights in Hotels/Resort/Motel
or Motor Inns (*HRMMI’s) increased at a similar rate, recording 4.6% growth,
although upheld by strong domestic hotel stays 5.0%
– International visitor nights in major cities grew 3.0% to 210M, while nights in
HRMMI’s actually declined by 3.1% to 24M, indicating leisure tourism softness 4.0%
being the predominant users of paid accommodation
– Domestic visitor nights in major cities grew 8.2% to 116M, while nights in 3.0%
HRMMI’s grew slightly faster at 9.0% to 48M
Dransfield National Demand Forecast
2.0%
Hotel Futures 2019’s long term demand forecast is a slight upgrade to the
previous forecast, and is a mixed bag across the various cities, with uplift and
reductions both evident 1.0%
• We expect demand to increase by 1.7% in FY2019 which is below previous
forecasts for 3.9% growth. Much of this performance has already occurred at
0.0%
the time of print, with underperformance in several key cities
Cairns
Melbourne
Perth
Darwin
Canberra
Sydney
Gold Coast
Australia
Adelaide
Brisbane
Hobart
Annual Growth
• Medium term demand growth is expected to average 3.8% p.a, which is behind
% Average
prior forecasts, albeit dragged by the soft short term. Demand growth for this
period is slightly behind supply growth expectations and we expect a small
reduction in occupancy levels to emerge
HF18 HF19
• Our long term forecast is for average growth of 4.0% p.a. underpinned by
growth in both international and domestic leisure tourism as well as office
development activity which will ensure core corporate travel needs.
* Source: TRA special request
P 17 www.dransfield.com.auIn FY2018 Adelaide RevPAR growth was strong, albeit half of this has been given back
through FY2019. Minor volatility continues to define the market as does low rate growth.
Demand should exceed supply long term, keeping average occupancy levels high. RevPAR
growth of 2.6% p.a. is expected, with the long term impacted by below inflation rate growth
ADELAIDE
FY2018 SNAPSHOT FY2018 Year In Review
STR • In FY2018 Adelaide hotel performance was strong, recording 5.1% RevPAR growth, largely in line with 6.7%
expectations and absorbing new supply
Establishments 54
– Occupancy levels increased 1.1 points to 80.2%, finishing the year as the third highest of the major cities
STR Sample Rooms 5,454
– Rates improved by 3.6%, helped by a strong calendar of corporate and leisure events driving compression night
STR Sample Coverage 92% rates
Occupancy 80.2% • Preliminary STR data for YTD FY2019 (YTD April 2019) shows a slight market reset, dragged by an Ashes induced
Rate $157.68 unwind (42% RevPAR increase in the P.C.P) in December. Removing December performance, the market has
RevPAR $126.46 remained in line with the prior year
Source: STR Demand Driver Analysis
Adelaide performed in line with TFC tourism forecasts in FY2018, although is trending behind through the first half of
FY2018 YEAR IN REVIEW FY2019
FORECAST ACTUAL • Public sector spending on renewable energy projects should help improve corporate activity, whilst strong
Variance international growth expectations will be enabled if additional flights can be attracted following expansion of the
FY2018 FY2018
international terminal
Supply 3.3% 3.7% 0.4% ▲
• City data for FY2018 for Adelaide reveals:-
Occupancy* 1.3 1.1 -0.2 ▼
– International visitor nights decreased by 3.0% to 8.7M nights
ARR 5.0% 3.6% -1.4% ▼
– Domestic visitor nights increased 15.2% to 9.6M nights
RevPAR 6.7% 5.1% -1.7% ▼
* Percentage Point Change – Total visitor nights increased by 5.7% to 18.3M nights, inline with 6.6% TFC forecasts, of which 22% are captured in
Hotels
Source: STR
• In FY2018 Adelaide hotel’s domestic visitor night content increased slightly to 76% from 75%
• The updated 2019 TFC visitor night forecasts have not been released at the time of the forecast. The long term
outlook for FY2020 to FY2027 remains growth of 4.0% p.a:-
– Annual domestic visitor night growth expectations remain at 2.0% p.a.
– Annual international visitor night growth expectations remain at 5.6% p.a.
Dransfield Demand Forecast for Adelaide City Hotels
Annual demand growth of 3.9% is expected for Adelaide hotels over the long term, which is a minor upgrade to the
prior forecast influenced strong event growth and helped by a slight increase in supply and a stretch in supply timing
which assists long term absorption
• We expect demand to increase marginally in FY2019, in line with room additions
• Medium term demand growth to FY2021 is expected to average 3.3% p.a. This is 1% below TRA visitor forecasts
• Long term growth expectations represent a minor upgrade to prior forecasts and remain slightly below TRA visitor
night forecasts. Tourism and Events infrastructure improvements are enabling and attracting more visitors, both
P 18 www.dransfield.com.au corporate and leisure. We expect demand growth to outstrip supply growth over the long term.A significant shift from proposal activity to construction occurred this year, while the
proposal pipeline was refilled. Risk in delivery remains for the 50% of the pipeline yet to
break ground, and this may depend on how well the initial supply wave is absorbed and
how well rate reacts, impacting feasibility inputs
ADELAIDE
SUPPLY ACTUAL & FORECAST BY TYPE FY13-FY27
Supply Actual
1,200
1,000
• In FY2018, just over 200 rooms came online, increasing supply by 3.7%
ABS • Through the first three quarters of FY2019, all of the very small increase in supply was
# of rooms
800 Dataset the result of an annualised increase from a single hotel opening in late FY2018. No new
Change hotels have come to market
600
400 • Construction activity has doubled with five projects now underway, representing 50% of
the pipeline. These will be delivered through to FY2022.
200
Supply Forecasts
-
• Dransfield’s supply forecast is for 2,100 new rooms to enter the market over the next 9
-200 years to FY2027 (36% of current stock) at an average annual growth rate of 3.5%
FY24
FY13
FY14
FY15
FY16
FY17
FY18
FY19
FY20
FY21
FY22
FY23
FY25
FY26
FY27
– Our forecast supply pipeline is 200 rooms above our prior forecast from Hotel Futures
2018, with new proposal activity replacing projects which moved in to construction
Market Response Proposals Construction Completed
– 950 rooms are now under construction with the first rooms to arrive in early to mid
2020
FORECAST COMPARISON HF18 VS HF19 - % ANNUAL SUPPLY GROWTH
• The prior years proposals which moved into construction have been fully replaced at the
12% gross level, although the new and less progressed schemes have higher risk for
completion. This sees a minor reduction in net proposals
9%
– 550 net proposed rooms at a 31% probability to complete are currently expected
% Growth
6% – Our Market Response allowance has reduced in light of the more pronounced live
pipeline. Our forecast Market Response to FY2027 is for a low 400 additional rooms
3%
representing 21% of the total pipeline
0% • Supply growth in the medium term to FY2021 is expected to average 3.7% p.a. which is
FY19 FY20 FY21 FY22 FY23 FY24 FY25 FY26 FY27 highly backended
HF2019 - % Annual Growth HF2018 - % Annual Growth
– Material supply arrivals begin to arrive through FY2021 with three years of growth
averaging just shy of 8% p.a, before reverting back to low levels which is all Market
FORECAST COMPARISON HF18 VS HF19 - PIPELINE BY TYPE TO FY2026 Response at this stage
650 Rooms – We expect supply to be fully absorbed over the long term with occupancy levels
1,750
HF2018 22% 36% @ 44% 42% 750 Rooms moving back above 80% in FY2025
Rooms
• Similar to many major markets in this cycle, the level of quality and sophistication of
550 Rooms 1,950 product is significantly improving the supply base. Lifestyle brands and serviced
HF2019 50% 950 Rooms 30%
@ 27%
21%
Rooms apartment products are well represented along with the upper upscale and luxury
products already under development.
P www.dransfield.com.au 19Long term RevPAR expectations are for quite low 2.6% growth p.a, which is impacted by
medium term additional supply, and a conservative rate environment. High occupancy
levels provide opportunity for rate growth, however, this opportunity is often left on the
table in Adelaide
ADELAIDE
Conclusion
A slightly underwhelming long term market outlook given the high occupancy • Our forecast is for a moderate 6.0% decrease in average long-term real RevPAR
environment. Upside opportunity is constrained by medium term supply compared to our prior forecast, largely a result of rate underperformance in the
expectations and there is downside risk. It will be interesting to see how rate reacts prior year and year to date, which carries through for the life of the forecast
as the first new high quality hotels currently under construction are completed
• A benign rate outcome once again limits Adelaide as hoteliers cut rates despite
The Adelaide forecast represents a small downgrade to prior expectations, with maintaining 80% occupancy. 2,000 additional rooms over the longer term are
short term rate underperformance, despite occupancy levels maintaining. Current likely to keep rate upside in check, although these rooms are expected to be fully
rate behaviour has reduced our forward looking rate sentiment
absorbed.
• Over the period of the forecast, average occupancy of 80% is expected with
strong backended growth following a period of material additional supply • RevPAR growth rates for the comparable period to FY2026 have been reduced
through the middle of the forecast from 3.0% p.a. to 2.2% p.a.
– In FY2019, occupancy levels are expected to largely maintain with no real – In FY2019, RevPAR will decline as rates reduce in an environment of stable
increase in supply recorded occupancy, led by the Ashes period unwind seeing RevPAR drop 12% for that
month
– Over the medium term to FY2021, occupancy movement is expected to be
quite neutral despite some high supply arrivals at the end of this period. – In the medium term to FY2021, RevPAR growth is dragged by the soft FY2019,
Occupancy is likely to depress 3-4 percentage points in the period following, and then impacted by significant supply arrivals in FY2021. Occupancy and rate
with three years of material supply to arrive, challenging demand to keep pace. growth through this period are likely be neutral. This is likely to extend through
Occupancy may drop 5 points from peak to trough
to FY2023 as supply arrivals continue to impact rate
• Rate growth expectations have reduced and now sit below inflation targets.
Market behaviour is indicating a more conservative stance, with FY2019 YTD – Long term expectations are positive with outperformance anticipated over the
figures proving less boisterous. Adelaide rate yielding is closely linked to event back end as supply additions slow. Rate opportunities should ramp up over this
nights, so any improvement in the scale and frequency of these will likely reap time as occupancy levels push towards and above 80% and the quality of stock
benefits settles a step above the historical market
– There is an element of both rate risk and rate upside in our forecast despite the – Full forecast expectations to FY2027 are for 2.6% growth p.a.
high occupancy position, with hoteliers response to new supply posing volatility
– In the medium term, rate growth opportunity is impacted by arriving supply,
albeit much of it at the upscale end which may promote organic increases. We
expect average growth of less than 0.5% p.a. over this period
– Long term expectations are for more robust rate growth as supply arrivals slow.
Late term expectations are above 4% p.a, whilst the full forecast expectations
average 2.6% p.a.
P 20 www.dransfield.com.auLong term RevPAR expectations are for quite low 2.6% growth p.a, which is impacted by
medium term additional supply, and a conservative rate environment. High occupancy
levels provide opportunity for rate growth, however, this opportunity is often left on the
table in Adelaide
ADELAIDE
ADELAIDE – HOTELS, MOTELS AND SERVICED APARTMENTS
ACTUAL – STR DRANSFIELD FORECAST
$2018 $2018
Sample Sample Supply Demand
Year ARR % Chng RevPAR % Chng Real Occ Year Rooms ARR % Chng RevPAR % Chng Real Occ
Size Coverage % Chng % Chng
RevPAR RevPAR
HISTORICAL
FORECAST
FY2017 $152.18 $120.37 79.1%
FY2019 5,824 0.7% 0.5% $153.74 -2.5% $123.05 -2.7% $120.64 80.0%
FY2018 5,454 92% $157.68 3.6% $126.46 5.1% $126.46 80.2%
FY2020 5,935 1.9% 3.0% $158.35 3.0% $128.10 4.1% $122.82 80.9%
Source: STR FY2021 6,437 8.5% 6.5% $158.35 0.0% $125.78 -1.8% $117.95 79.4%
ADELAIDE CITY REAL REVPAR IN $2018 Avg FY 19-21 3.7% 3.3% 0.2% -0.1% $120.47 80.1%
FY2022 7,010 8.9% 6.5% $158.35 0.0% $123.01 -2.2% $112.21 77.7%
$160
FY2023 7,435 6.1% 5.0% $160.72 1.5% $123.60 0.5% $109.68 76.9%
$140 FY2024 7,532 1.3% 4.0% $167.15 4.0% $131.97 6.8% $113.92 79.0%
FY2025 7,607 1.0% 3.2% $174.67 4.5% $140.92 6.8% $118.32 80.7%
$120
FY2026 7,721 1.5% 3.2% $182.53 4.5% $149.73 6.3% $122.29 82.0%
$100
FY2027 7,876 2.0% 3.2% $190.75 4.5% $158.30 5.7% $125.78 83.0%
$80 Avg FY22-27 3.5% 4.2% 3.2% 4.0% $117.03 79.9%
Total Forecast Avg
3.5% 3.9% 2.2% 2.6% $118.18 80.0%
$60 FY 2019-2027
$40
$20
$0
'02 '03 '04 '05 '06 '07 '08 '09 '10 '11 '12 '13 '14 '15 '16 '17 '18 '19 '20 '21 '22 '23 '24 '25 '26
HF18 Real RevPar in $2018 Actual Real RevPar HF19 Real RevPAR in $2018
* There is a step in the data from FY2017 onwards being a change from ABS census to STR sample. The STR census data
has a higher performance base as properties included are typically skewed towards larger and branded product
P 21 www.dransfield.com.auBrisbane In FY2018 Brisbane RevPAR exceeded strong expectations, growing above 4% as demand
surged, improving occupancy levels two percentage points after absorbing a high level of supply.
The effect is going to be short lived with double digit supply coming online in FY2019 which won’t
be fully absorbed. Brisbane’s capacity to grow demand is, however, now more multidimensional,
with corporate sentiment improving and $12B in tourism infrastructure planned to induce leisure
visitors. Very strong back end growth averaging 4.9% p.a. is expected over the long term
FY2018 Year in Review
FY2018 SNAPSHOT
• In FY2018, Brisbane Hotels stemmed the persistent market decline of the last five years, recording demand led RevPAR
STR growth of 4.1%. This surpassed our 3.0% expectations
Establishments 126 – Occupancy levels improved 2.3 points to 75.5%, made even more impressive when considering the absorption of a 5.4%
STR Sample Rooms 10,935
supply increase as the city continues to welcome a raft of quality new hotels
– Rates strengthened 0.9%, a strong result considering typical market dynamics in a city with consistent supply additions.
STR Sample Coverage 83%
Some event related (Ashes Tour) outperformance in November (10% ADR growth) has contributed quite a bit of weight
Occupancy 75.5%
• Preliminary STR data for the YTD FY2019 (Apr 2019) indicates moderate market contraction as demand has not
Rate $159.59 immediately absorbed the next influx of supply. This is manifesting in a drop in both occupancy levels and rate. The
RevPAR $120.42 situation is exacerbated amongst other things by the November Ashes related unwind from the p.c.p.
Source: STR Demand Driver Analysis
Brisbane underperformed to TFC tourism forecasts in FY2018, however, is outperforming through the first half of FY2019
FY2018 YEAR IN REVIEW
• Demand drivers are primed for growth with the once in a lifetime $12B investment in tourism infrastructure, and a
FORECAST ACTUAL government committed to investing more in tourism than any QLD government previously. This positions Brisbane well to
Variance quickly absorb recent and upcoming supply
FY2018 FY2018
Supply 6.8% 5.4% -1.4% ▼ • City data for FY2018 for Brisbane reveals:-
Occupancy* 1.5 2.3 0.8 ▲ – International visitor nights increased by 3.8% to 28M nights
ARR 1.0% 0.9% -0.1% ▼ – Domestic visitor nights increased by 6.4% to 21M nights
RevPAR 3.0% 4.1% 1.0% ▲ • Total visitor nights increased by 4.9% to 49M nights, albeit below the 6.5% TFC forecasts, of which a low 16% is captured
* Percentage Point Change
in Hotels
Source: STR
• In FY2018 Brisbane hotel’s domestic visitor night content increased slightly to 73% from 70% previously
• The updated 2019 TFC visitor night forecasts have not been released at the time of this forecast. The long term outlook
for FY2020 to FY2027 for QLD Capital cities (Brisbane & Gold Coast) remains growth of 4.0% p.a:-
– Annual domestic visitor night growth expectations remain at 1.8% p.a
– Annual international visitor night growth expectations remain at 5.6% p.a
Dransfield Demand Forecast
Annual demand growth of 4.3% is expected for Brisbane hotels over the long term. This is a marginal increase to the prior
forecast, induced by a slight uplift to supply expectations at the back end of the forecast
• We expect demand to increase by a high 6% in FY2019, albeit below expected supply growth. The demand growth result
is strong despite unwind from the Ashes which saw occupancy levels up 5% for the respective month in the prior year
• Medium term demand growth to FY2021 is above the long term average and is expected to average 5.0% p.a. This is in
line with supply expectations over the same period, with the quality of new supply attracting visitors who may not have
previously had Brisbane on their hit list
• Long term growth expectations take advantage of enabling travel infrastructure and tourism investment led by the
Queens Wharf casino and Brisbane Live precincts which appeal to both international and domestic leisure visitors.
P 22 www.dransfield.com.auYou can also read