Housing and Business Development Capacity Assessment - BLENHEIM URBAN AREA
←
→
Page content transcription
If your browser does not render page correctly, please read the page content below
BLENHEIM URBAN AREA | 2018

Housing and Business
Development Capacity
Assessment
BLENHEIM URBAN AREA | 2018

Housing and Business
Development Capacity
Assessment

Table of Contents
Table of Contents                                        0
Executive Summary                                        1
     Recommendations                                     6
     Background                                          8
        Marlborough Demographics                        13
Part One - Housing                                      21
       Housing Trends                                   21
       Assessing Housing Demand                         29
           Residential Demand Assessment                30
              Demand Drivers                            30
              Typology                                  31
              Section Sales                             35
              Location                                  35
              Price Point                               36
              Home Ownership and the Rental Market      38
              Housing Need                              39
              Supply of Seasonal Worker Accommodation   40
       Assessing Housing Supply                         42
                 Short Term Supply                      43
                 Medium Term Supply                     44
                 Long Term Supply                       45
           Further Discussion on Supply                 47
           Greenfield Land                              47
           Other Residential Supply                     50
           Price Point and Typology                     51

Part Two - Business Land                                52
            Non-residential Development Trends          52
        Business Land Demand                            53
        Business Land Supply                            56

APPENDIX ONE - NPS Policies                             58
APPENDIX TWO - Stakeholder Engagement                   59
APPENDIX THREE - Residential Supply Analysis            60
APPENDIX FOUR - Unutilised Industrial Land              69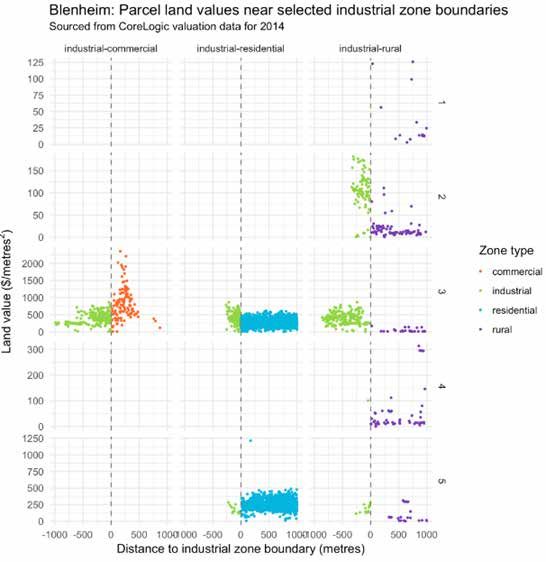
Executive Summary
The National Policy Statement on Urban Development Capacity (NPS UDC) requires local authorities
classified as having high and medium urban growth to prepare housing and business development
capacity assessments that forecast demand and “feasible” development capacity, and the likely take-
up of capacity on at least a three-yearly basis.

These Assessments are required from 31 Dec 2018. This is in addition to the quarterly market
monitoring reports which Council has been producing since 31 December 2017. See Appendix One
for specific NPS UDC policies.

The overall objective of this Assessment and the quarterly reporting is to have a robustly developed,
comprehensive and frequently updated evidence base to inform planning decisions in the Blenheim
urban area, to ensure that Council adequately provides for urban growth.

Council’s principal role in enabling urban development relates to zoning of land and infrastructure
provision. It also extends to processing of resource and building consents, provision of senior
housing, development contributions policies, and as the lead voice for the region. The Council has
also been a developer in the past by utilising land that it owns to provide for residential growth. Forest
Park and Boulevard Park on Taylor are both residential subdivisions undertaken by Council. Many
other individuals and organisations also play a role too - including developers, land owners, builders,
government, development professionals and individuals buying, selling and investing in property.

This Assessment estimates the demand for residential dwellings and business land in Blenheim,
and the supply of development capacity to meet that demand. It predicts whether there is sufficient
capacity to meet need in the short, medium and long term. 1

This Assessment should be read in conjunction with quarterly reports produced under the NPS UDC;
Council’s Long Term Plan and Infrastructure Strategy 2018; and “Growing Marlborough - A Strategy
for the Future” (the Growth Strategy) which was completed in 2014.

Data has been used from a number of sources including existing Council plans and reports and
information on building and resource consents; indicators prepared by the Ministry for Business,
Innovation and Employment; Statistics NZ (Stats NZ) census data; and specific reports prepared for
other organisations. Unfortunately there are some limits on the usefulness of data provided by MBIE
to assist the assessment, due to the geographical boundaries used in their data analysis. Council has
requested that should this reporting continue to be a requirement for under the NPS UDC, that MBIE
work with Council to improve the alignment of the data with the study area.

A number of stakeholders were interviewed across various sectors including developers, builders,
real estate companies, surveyors, social and community housing providers, Iwi and Grey Power.
See Appendix Two for a full list.

1   Short Term (0-3 yrs) 2018 - 2021; Medium Term (3-10 years) 2021 - 2028; Long Term (10-30 yrs) 2028 - 2048.

                                    Housing and Business Development Capacity Assessment for Blenheim 2018       1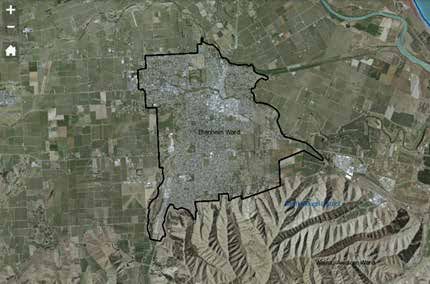
Demographics
Estimated at 46,600 people in 2018, Marlborough’s population growth has trended close to Stats
NZ’s high growth projections over the past five years with significant peaks of growth in 2015 and
2017. Most of the growth can be attributed to migration with an average natural increase of only 100
people per year. Growth in the Blenheim Urban Area accounts for approximately 60% of total growth
in the Marlborough District.

Of particular relevance to both housing and business development, Marlborough’s population is
ageing rapidly, with one third of residents projected to be 65 years of age or over in 2043, and the
proportion of residents in the working age group projected to decline. Marlborough also has the
highest forecast growth in labour demand in the country for 2017 to 2020.2 This means that in order
to fulfil Marlborough’s economic potential, migrants will be needed to fill labour shortages and young
people will need to be encouraged to stay and work in the region.

These things combined will have an impact on the type of housing required into the future and the
demand for business land.

Residential Trends
The Assessment provides detailed information on the residential market trends over the past 10
years. The last three years have seen significant increases in house sale prices and rents both
nationally and in Marlborough. Increases appear to have slowed in Blenheim in the last half of 2018,
about two years behind similar trends in Auckland, and there is uncertainty about what the local
market will do into the short term.

The rate of uptake of new residential developments in Blenheim has been faster than predicted i.e. at
the Boulevard Park on Taylor (BPOT) and Omaka Landing Subdivisions, with these subdivisions due
to be completed within 2 years time. Building consents have been issued at significantly higher rates
over the last 3 years than in previous years.

The current demand appears to be highest for 3+ bedroom standalone homes in the urban area.
Sales of smaller homes such as apartments have not been as popular, but are anticipated to be
in higher demand in the medium to long term given population and demographic projections. The
majority of sales over the past five years have been in the $250k to $399k and $400k to $550k price
brackets.

The rate of home ownership across all age groups is declining, and more people are renting -
including those over 65 years of age. Rental properties in Blenheim are in high demand.

There is a shortage of social and affordable housing relative to demand. Housing New Zealand have
35 homes in the pipeline for Marlborough and are looking for partners to deliver Housing First homes
locally.

2   Ministry of Business, Innovation and Employment (2017). Short Term Employment Forecasts 2017 – 2020

2                               Housing and Business Development Capacity Assessment for Blenheim 2018
Residential Demand Assessment
In addition to Stats NZ population projections, Council has developed a future demand model
based upon average numbers of building consents for new dwellings. There is a marked difference
between the Stats NZ population growth projections (which are generally lower and indicate that the
population will peak, then decline after 2033, except for the high growth scenario) and the building
consents past averages.

For the purposes of this report, the building consent averages have been selected as these more
closely reflect the current picture of demand. However, it does reflect a high demand scenario and
does not take into account the expected peaking of population in the longer term. For this reason a
‘mixed scenario’ has been considered which provides for a higher rate of development in the short
and medium term, and a lower rate of development in the period between 2028 and 2048.

A demand assessment showing different demand scenarios based on the average number of
building consents issued over the past 10 years for new dwellings is presented in the table below
‘Residential Demand Assessment’. Consents have averaged 160 per annum over the past three
years, 130 per annum over five years, and 110 per annum over the past 10 years. It should be noted
that the mixed scenario in this model is close to the Stats NZ ‘high’ projection’ and consequently over
the long term the actual demand could be lower than the developed model3.

Residential Demand Assessment
                                                                                               Number of Dwellings Required

                                                                                 Short Term                  Medium Term                  Long Term
    Demand Scenario                                                              (0-3 Yrs)                   (0-10 yrs)                   (30 yrs)

    Short Term Average (3 yrs) - 160 dwellings
                                                                                480                          1600                        4800
    p.a.
    Medium Term Average (5 yrs) - 130
                                                                                390                          1300                        3900
    dwellings p.a.
    Long Term Average (10 yrs) - 110 dwellings
                                                                                330                          1100                        3300
    p.a.
    Mixed Scenario*                                                             480                          1290                        3090
    Population Projections Medium Growth
                                                                                n/a                          364                         368
    Scenario
    Population Projections High Growth
                                                                                n/a                          1013                        2476
    Scenario
* Yrs 0-3 @ 160p.a.,Yrs 4-5 @ 130p.a., yrs 6-10 @ 110 p.a., and Yrs 11-30 @ 90 p.a.

Demand based on the mixed scenario shows that an average of just over 100 new dwellings would
be required per annum in Blenheim, (allowing for a higher demand of 160 per year in the first three
years). This scenario equates to a required capacity of 480 new dwellings in the short term (2018 -
2021), 1,290 in the medium term, and 3,090 for the next 30 years to 2048.

3     It is generally accepted practice to use the Stats NZ medium growth population projections for planning purposes, however population has trended more towards the high
      growth projections over recent years. Latest census data from Stats NZ will be available later this calendar year.

                                        Housing and Business Development Capacity Assessment for Blenheim 2018                                                              3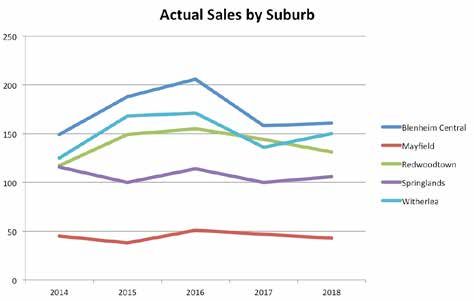
Residential Supply
An assessment of residential capacity for new development estimates that there is a total supply of
2,655 sections for new dwellings in the Blenheim Urban Area in the long term, building at an average
of 10 houses per hectare. Approximately 650 of those are available in the short term (0-3 years), and
the majority will be available for development within the medium term (10 years). Based on the mixed
demand scenario of 100 new sections per annum, this would provide approximately 26 years worth
of supply. Based on the long term average of 110 per year, 24 years of supply. The recent Omaka
Landing development was built at a rate of approximately 12.5 houses per hectare. Most of the land
was zoned Urban Residential 1 which enabled the creation of smaller lots as a controlled activity.
If this trend continues then the current supply of land could yield more houses and consequently
provide for more than 26 years of supply.

If demand continues at the same rate as it has done over the past 3 - 5 years, a possible constraint
with residential supply in the short term (0-3 years) has been identified due largely to the provision of
infrastructure for sewer and stormwater impacting on land availability for development in greenfield
areas. Council has been in discussions with a developer in the Old Renwick Road area and
temporary infrastructure can be provided to enable development to continue over this period. The
requirements of the NPS UDC are met with a 26% buffer of supply relative to demand in Blenheim,
however the heavy reliance on infill subdivision to supply short term demand could potentially result
in a shortfall in real terms as the uptake of infil is traditionally slower than that of greenfield land.

If a request to rezone around 30 hectares of land to Urban Residential 2 zone in the west Batty’s
Road area (Area 8 identified in the Growth Strategy) is approved through the Proposed Marlborough
Environment Plan (PMEP) hearings, then this should address any potential shortage of supply in
the short term. This is subject to its own decision making process which is not influenced by this
Assessment.

Feedback from stakeholders identified that the key perceived constraints to residential development
are the availability of land due to the provision of infrastructure, and landowners who may have no
intention of opening up their land for development.

There is no constraint to supply in the medium term as major infrastructure provision to enable
development of greenfield land to progress will be completed.

The Assessment identifies a potential shortfall of supply in the Long term based on recent
development rates. However, the shortfall is less marked when provision of increased intensification
through apartments, units and townhouses for example is taken into account, for which there is
anticipated to be increased demand for in the medium to long term. As indicated previously, the
‘medium’ Stats NZ population projections indicate that Marlborough’s population will peak and then
decline after 2033. This is something Council will need to investigate further.

It is important that Council continue to review the level of capacity for residential development and
plan accordingly in its next generation resource management plans. If future assessments continue
to show that a long term shortfall is likely, a review of the Growing Marlborough Strategy for the
Blenheim area should be undertaken.

4                     Housing and Business Development Capacity Assessment for Blenheim 2018

There is a possibility that if future development continues to provide large homes on average sized
sections predominantly, there may eventually be a mismatch between the range of residential
dwelling supply and demand in terms of typology and affordability.

There are opportunities for Council to work with Iwi, Community Housing Providers, Nelson
Marlborough District Health Board, and other partners - for example private developers - to facilitate
additional and more diverse housing options in Marlborough over the medium to long term, including
encouraging residential intensification in some areas such as the inner city and areas close to
amenities.

Business Land Demand and Supply
Business land assessment is difficult due to the limited amount of data available on demand and supply.

Analysis of industrial land values relative to neighbouring land types and feedback from stakeholders
suggests that there is a current shortage of land suitable for light industrial activity in particular.

There is approximately 18 hectares of additional Industrial 1 zoned land provided for in the Marlborough
Environment Plan in Corlett Road in Omaka (subject to confirmation), and 7 hectares north of the
Westwood development (accessed from Rene Street). Anecdotal advice is that this should be sufficient
for the short to medium term provided that the land comes to market and is able to be used.

There is a substantial amount of unutilised land in the Riverlands and Cloudy Bay Business Park area
to the south west zoned for Industrial 2 (heavy/wet industrial) activity, however there is no accurate data
available to assess demand for this land in future.

Given the perceived high level of demand for industrial growth, Council should continue to monitor
demand for business land, particularly for light industrial activity. If the proposed rezoning of the Corlett
Road land in Omaka is not confirmed, Council will need to identify and assess additional land that could
be rezoned to fill the shortfall.

Future Reporting and Data Collection
MBIE are currently reviewing which Councils will need to continue to meet the reporting requirements of
the NPS UDC. It is possible that Marlborough will not meet the thresholds to continue to be a medium
growth urban area - in terms of the level of Urban Growth it is anticipated to experience and/or minimum
size of urban area. However, there is significant benefit in continuing to monitor residential and business
trends.

It is essential that Council review its capacity for growth in relation to demand on a regular basis and
feed this into strategic planning processes so that development can occur without constraint at the level
at which it is required to meet the needs of the community. The three-yearly assessments provide a
good opportunity to do that. If the NPS UDC does not continue to be a requirement, it is recommended
that Council devise a similar process and/or regularly review the Growth Strategy work for both
residential and business needs.

In either case, improvements could be made to the type and quality of data available to inform planning.

                        Housing and Business Development Capacity Assessment for Blenheim 2018              5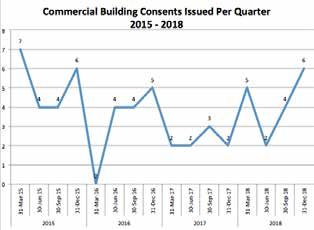
Recommendations
The Housing and Business Development Capacity Assessment makes the following
recommendations:
          a. It is recommended that should this reporting continue to be a requirement, Council
              considers undertaking the next assessment in 2020 rather than 2021, so that
              the outcomes and recommendations can feed into the 2021 Long Term Plan
              development and associated strategies and budget processes. Thereafter the
              assessments would continue on a 3-yearly basis.

           b.   It is recommended that when the Proposed Marlborough Environment Plan becomes
                 operative in Mid 2019, Council promote the changes and opportunities it presents for
                 housing and business development through relevant media channels.

           c.   It is recommended that Council regularly monitor intensification of residential
                 development in the Urban Residential 1 and Business 1 zones as provided for in the
                 MEP to inform the next Assessment.

           d. It is recommended that Council continue to monitor the rate of development per
               hectare in new developments.

           e. It is recommended that Council reviews the Development Contributions Policy in
               consultation with property developers as part of the 2021 Long Term Plan process.

           f.   It is recommended that for the next Assessment Council investigate options for
                 commissioning statistical modelling on future supply and demand across different
                 price points, against demographics and population projections, to better understand
                 the range of housing stock in relation to the needs of the Blenheim community.

           g. It is recommended that Council investigates options for assisting the development of
               affordable and social housing for example through providing a ‘guided’ consenting
               process. ‘Affordable’ and ‘social housing’ would need to be clearly defined to ensure
               consistency of application.

           h. It is recommended that Council investigate options for recording
               building consent data to enable more efficient monitoring of

                           i. the range of housing types being developed (standalone,
                           townhouse, unit, apartment for example),
                           ii. the rate of uptake of the greenfield sites in the
                           North and Northwest growth areas, and
                           iii. the rate of infill subdivision in Urban Residential
                           1 and Business 1 zones
           i.   It is recommended that Council Investigate options for recording Resource Consent
                 data to make it easier to track information contained within those consents about the
                 type of resource consent (residential or commercial/industrial) and the number of
                 residential lots created.

6                    Housing and Business Development Capacity Assessment for Blenheim 2018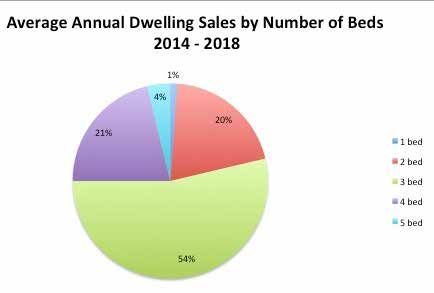
j.   It is recommended that if subsequent assessments continue to identify a potential
      long term shortage of capacity for residential development, Council review the
      Growing Marlborough Strategy in order to give effect to Policy PC3 of the NPS UDC.

k.   It is recommended that Council investigate how other Council’s respond to evident or
     potential mismatches in residential supply and demand with respect to typology and
     price point.

l.    ouncil continue to monitor provision of land suitable for light industrial activity to
     C
     ensure the level of capacity is sufficient to meet demand. If the rezoning of land to
     Industrial 1 at Omaka is not approved, additional capacity will need to be found.

m. It is recommended that Council Investigates options for commissioning research into
    Blenheim’s business sector including growth projections and associated demand for
    employment land, in partnership or consultation with other industry and organisations.

            Housing and Business Development Capacity Assessment for Blenheim 2018              7
Background
The purpose of this report is to meet Marlborough District Council’s National Policy Statement
on Urban Development Capacity (NPS-UDC) requirements to carry out a Housing and Business
Development Capacity Assessment (The Assessment).
The NPS-UDC came into effect on 1 December 2016. It provides national direction to local
government on making provision for urban development. This involves a change in the way local
authorities provide for and respond to growth, and the evidence and monitoring they are required to
use to support planning decisions.
Blenheim is newly defined as a ‘medium growth’ local authority based on Statistics NZ 2016 urban
area definitions and current population growth projections.4 The National Policy Statement on Urban
Development Capacity (NPS UDC) requires local authorities classified as having high and medium
urban growth to:
• undertake quarterly monitoring of housing and commercial development market
indicators, and use indicators of price efficiency (which Marlborough District Council
has been producing since December 2017); and
• prepare housing and business development capacity assessments on at least a three-
yearly basis which forecast demand and “feasible” development capacity, and the likely
take-up of capacity (from 31 Dec 2018).
The overall objective is to have a robustly developed, comprehensive and frequently updated
evidence base to inform planning decisions in the Blenheim urban area. In short, the Assessment
estimates the demand for residential dwellings and business land and the supply of development
capacity to meet that demand in order to determine whether there is sufficient capacity to meet need
in the short, medium and long term. See Appendix One for specific NPS UDC policies
4 This is a “transitional” definition, and will be reviewed and amended by 31 December 2018. Based on updated population growth projections and Stats NZ’s new urban
area boundaries, it is possible that Blenheim may no longer fall into the Medium Growth category.
8 Housing and Business Development Capacity Assessment for Blenheim 2018Geographical Area of Investigation
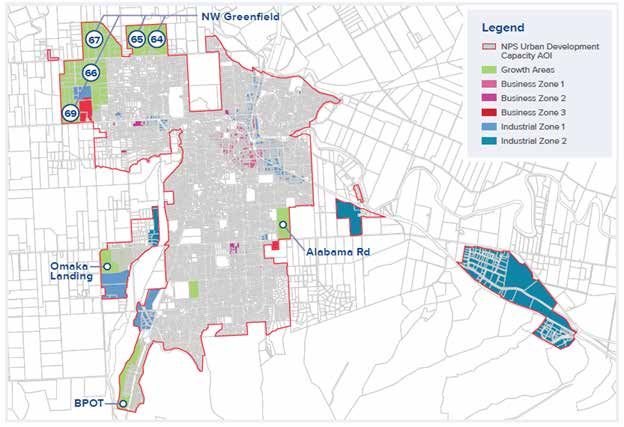
The Council has defined the geographical area of investigation as the Blenheim Urban Area set out
in Map 1 below. This includes the existing urban area of Blenheim plus greenfield areas zoned for
residential growth in the North and North West, and the industrial areas to the East and South West
of the town.
Council defined this area in consultation with MBIE to ensure that the monitoring and assessment
is fit for purpose (ie. that it relates specifically to the area of Blenheim experiencing urban growth).
The study area is smaller than the 2017 Blenheim Urban Area defined by Stats NZ which included
large areas of rural zoned land and other settlements linked but not contiguous to Blenheim. It is
also broader than the current Stats NZ Urban Area boundary which doesn’t include large portions
of the greenfield land identified for residential growth. While the defined area is the most relevant to
planning for urban growth and development for Blenheim, there are implications with respect to data
availability due to the differences in Stats NZ boundaries.
Legend
NPS Urban Development Capacity AOI
Growth Areas
Land Parcel
Business 1 Zone
Business 2 Zone
Business 3 Zone
Industrial 1 Zone
Industrial 2 Zone
Map 1. Blenheim Urban Area - Geographical Area of Investigation for the Housing and Business Development
Capacity Assessment
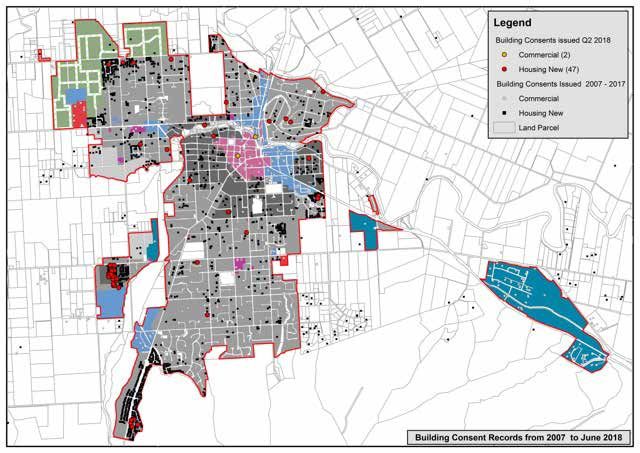
Housing and Business Development Capacity Assessment for Blenheim 2018 9A note on Data Availability A range of data sources have been used to inform this report. It is often difficult to obtain data that relates specifically to the area of investigation. Council’s data on building and resource consents relates to the Blenheim Urban Area specifically. MBIE indicators sourced from their NPS UDC Dashboard provide data for both the wider Marlborough District (Map 2) and smaller Blenheim Ward area (Map 3) based on 2013 ward boundaries and 2014 valuations. Unfortunately although the Blenheim Ward boundary is similar to the Blenheim urban area, it does not give an accurate picture of urban development activity as it excludes the new residential subdivision at Omaka Landing and greenfield land newly zoned for residential activity (but not yet developed) in the North West growth areas. This is significant as these and other new residential subdivisions provide for a significant amount of residential growth in Blenheim based on current population and housing demand projections5. The Marlborough District includes large areas of rural land with lower population density. Some data is only available at this level. Stats NZ data is available at the Marlborough Region level, and sometimes at statistical area units which are essentially based on suburbs within Blenheim. Where possible the area units closest to the Blenheim Urban Area have been used. Throughout the Assessment recommendations for potential new and/or improved data sources have been made where possible. Map 2. Marlborough District (MBIE data) Map 3. Blenheim Ward (MBIE data) 5 Residential Section Availability in Marlborough - a 20 Year View Ahead 25 September 2017 (Attached) 10 Housing and Business Development Capacity Assessment for Blenheim 2018
Relationship with other Council
  strategies and plans
Long Term Plan and Infrastructure Strategy
The Housing and Business Development Capacity Assessments are intended to inform Council
planning decisions and responses to urban growth. It should therefore be aligned with the Long Term
Plan and associated strategic planning including Infrastructure Strategy development where appro-
priate. Unfortunately the timing requirement under the NPS UDC is not ideal in that regard. A number
of Councils have recognised this and are planning to shift the next round of assessments forward by
one year to 2020.

           a. It is recommended that should this reporting continue to be a requirement,
               Council considers undertaking the next assessment in 2020 rather than 2021,
               so that the outcomes and recommendations can feed into the 2021 Long
               Term Plan development and associated strategies and budget processes.
               Thereafter the assessments would continue on a 3-yearly basis.

Growing Marlborough Strategy 2014 - 2031
This Assessment builds on extensive growth planning completed in 2014 by Council. “Growing
Marlborough - A Strategy for the Future” (the Growth Strategy) was a result of considerable planning
and consultation undertaken over a 5 year period for the Blenheim Town Centre Revitalisation
Strategy, and Marlborough Urban Growth and Development Strategies for Wairau-Awatere
Settlements, Blenheim, and Marlborough Sounds.

The Growth Strategy sets out a district wide vision for Marlborough to 2031 with key initiatives
focussed around ecological sustainability, residential growth, local employment growth, stronger town
centres, strong communities, public open space and future-proofed transport networks. It identified
that an additional 2,625 households would be needed between 2006 and 2031 to cater for projected
population growth in Blenheim, through a combination of subdivision and intensification of existing
residential sites, ‘brownfield’ development, and greenfield development.

      “Residential intensification is the most efficient and effective approach. However, this applies
      only if it is carried out well. Realistically there are limits to how much can be delivered. This
      means that new growth areas are then necessary. These should be located where they can be
      leveraged to deliver the most benefit to the existing community. Furthermore, they should be
      developed to the highest appropriate density from the outset rather than left to ad-hoc infill.”

                      Housing and Business Development Capacity Assessment for Blenheim 2018           11
The strategy aims to achieve affordable growth for Blenheim by
• Providing for necessary urban expansion where it makes logical sense, where it is
efficient and where it is most affordable from an infrastructure perspective
• Reconciling the locations where the market wants to develop with the locations where
existing services (community, open space and recreation, infrastructure) could be
utilised or built upon
• Minimising long term maintenance costs and debt burdens on infrastructure and
services for the community and individuals by maximising connections per kilometer of
service and minimising the overall length of service kilometres
• Promoting intensification where there are a range of amenities within easy walking
distance
This Assessment is not intended to replace the growth strategy, but offers an ideal opportunity
to assess the progress of the strategy in terms of provision for residential and business growth in
Blenheim.
The Growth Strategy ultimately resulted in approximately 140 hectares of greenfield land being
zoned for residential growth to the North West of Blenheim. Additional industrial zoned land was
also provided for in Riverlands and Omaka - some of which is still to be approved through the PMEP
hearings.
Proposed Marlborough Environment Plan (PMEP)
Providing for residential growth in Blenheim was determined to be a priority by the Council at the
time. This resulted in the Council adopting the land identified in the Growth Strategy for greenfields
residential growth in Blenheim and notifying plan changes to the Wairau-Awatere Resource
Management Plan. A suite of 8 plan changes (Plan Changes 74-72) were notified proposing the
rezoning of rural land to the north-west of Blenheim, although 2 were subsequently declined. In total,
140 hectares of greenfield land was rezoned for residential growth to the north-west of Blenheim. The
plan changes were made operative in 2014.
In 2016, the Council also completed a review of its operative resource management documents and
publicly notified the PMEP. The approved plan change areas were carried across into the PMEP.
One of the declined plan change areas was also included in the PMEP. Additional industrially
zoned land was proposed for Riverlands, Woodbourne, Springlands and Omaka. The PMEP also
included provisions to enable residential activity in Blenheim’s CBD and in other areas of industrially
zoned land. The above provisions of the PMEP are subject to submissions and the decisions of
the appointed hearings panel on the matters raised in submissions. The decision is expected to be
publicly notified mid 2019.
12 Housing and Business Development Capacity Assessment for Blenheim 2018Marlborough Demographics
Population Estimates November 2018
Marlborough’s usually resident population at the time of the 2013 census was 44,700 and is currently
estimated at 46,6006. Analysis using Stats NZ’s statistical area units shows that approximately
26,960 (60% of Marlborough’s total population) lived in the Blenheim Urban Area in 2013.7
Based on the latest estimates, population growth has trended between the medium and high
projections over the past five years with significant peaks of growth in 2015 and 2017. Net migration
accounts for the majority of population growth in Marlborough, with an estimated average natural
increase of only 100 people per year (births minus the number of deaths). Growth in the Blenheim
Urban Area accounts for approximately 60% of total growth in the Marlborough District.
6 Stats NZ Population Estimates updated November 2018
7 Area units used include the Blenheim Central, Springlands, Mayfield, Whitney, Redwoodtown and Witherlea areas.
Housing and Business Development Capacity Assessment for Blenheim 2018 13Marlborough District Population Growth 2013 - 2018
Natural Increase
Estimated Estimated
Year Net Migration (births minus
Population Growth8
deaths)
2013 44,700 - - -
2014 44,800 100 0 100
2015 45,300 500 400 100
2016 45,500 200 100 100
2017 46,200 700 600 100
2018 46,600 400 200 100
Population growth has been minimal in all age groups except for those aged 65 years and over.
According to estimates this age group has grown by 1,700 people over the past five years and now
accounts for 23% of Marlborough’s population.
Population projections will be updated when data from the 2018 Census becomes available.
Population Projections
Stats NZ population projections9 for the Marlborough District give three scenarios for growth over the
30 years from 2013 to 2043:
• High Growth +9,400 (21% total growth)
• Medium Growth +2,500 (5.6% total growth)
• Low Growth -4,300 (decline of 9.6%)
Population projections for the approximate Blenheim Urban Area using area units are as follows:
• High Growth +5,890
• Medium Growth +1,570
• Low Growth -2,220
8 From
Stats NZ Population Estimates 2013 - 2018: http://nzdotstat.stats.govt.nz/wbos/index.aspx The estimated resident population of each area is based on the 2013
Census usually resident population count updated for:
• net census undercount (as measured by the 2013 Post-enumeration Survey)
• residents temporarily overseas on census night
• reconciliation with demographic estimates for ages 0-9 years
• births, deaths, and net migration between census night and the date of the estimate.
The estimated resident population is not directly comparable with the census usually resident population count because of these adjustments.
Due to rounding, individual figures may not always sum to the stated total(s). For more detailed information see DataInfo+ Subnational Population Estimates.
9 Projections are based on 2013 census results and were updated in 2017
14 Housing and Business Development Capacity Assessment for Blenheim 2018The following graph shows the Marlborough District usually resident population from 2001-2013,
and population estimates from 2013 to 2018 against low, medium, and high population projections
out to 2043.10
10 Sourced from Stats NZ census data, population estimates and population projections.
Housing and Business Development Capacity Assessment for Blenheim 2018 15Marlborough Characteristics
Marlborough has some unique characteristics that set it apart from other regions in New Zealand,
all of which have an influence and impact on housing and business development demand.
• Marlborough has the highest proportion of its residents over 65 years of age (20.5%)11
and it’s population is ageing rapidly. By 2043 one third of Marlborough’s population
will be 65 or over.
• The median age in Marlborough is 46.1 - an increase of 2.5 years between 2013
and 2018.
• Marlborough faces an eventual decline in the working age population, and has a
very low unemployment rate. The annual average unemployment rate in Marlborough
Region was 3.6% in September 2018, up from 2.8% a year earlier, lower than the
national unemployment rate of 4.3% (Infometrics).
• The average household income in 2018 is $91,520 for Marlborough versus a national
average of $104,10412.
• The average current house value was $454,721 in Marlborough Region over the
year to September 2018 compared with $660,860 in New Zealand.13
• The average household size is 2.2 people in Blenheim Central (from 2013 Census
data) and 2.4 in Marlborough District, compared with a national average of 2.7.
• 77% of New Zealand’s wine grape production comes from Marlborough.14
• The current 24% (6,800Ha) expansion to 2019/2020 in Marlborough is more
than Hawkes Bay, Canterbury and Central Otago’s total planted areas
combined (6,758Ha5 ).15
11 Statistics new Zealand http://archive.stats.govt.nz/Census/2013-census/profile-and-summary-reports/quickstats-65-plus/geog-location.aspx
12 Stats NZ, household income by region tables (the Marlborough result is for (Tasman, Nelson, Marlborough and West Coast combined)
13 Infometrics Marlborough Region Quarterly Economic Monitor - September 2018 https://ecoprofile.infometrics.co.nz/Marlborough%2bRegion/QuarterlyEconomicMonitor Pdf
14 NZ Wine Growers 2018 Annual Report https://www.nzwine.com/en/news-media/statistics-reports/new-zealand-winegrowers-annual-report/
15 C
hamber of Commerce Solving Marlborough’s Demographic Challenges https://www.mcoc.org.nz/media/48785905/solving-marlboroughs-demographic challenges-
may-2018.pdf
16 Housing and Business Development Capacity Assessment for Blenheim 2018Demographic Trends
for Marlborough
Marlborough has the
highest proportion of
Population: residents over 65 years
Marlborough’s usually resident population at of age (20.5%)
the time of the 2013 census was 44,700,
and is estimated at 46,600 currently.
Marl
Median age
46.1
65+
By 2043 one third of Marlboroughs The Median age in Marlborough
residents will be 65 years or over is 46.1 an increase of 2.5 years
between 2013 and 2018
Marlborough District has
NZ a very low unemployment
4.7%
Marl
2.6% rate at : 2.6% in December
2017, versus the national
average of: 4.7%.
Marl NZ
$
91,520 $
104,104 The average household
income in Marlborough is
$ 91,520 versus a national
average of $104,104
Housing and Business Development Capacity Assessment for Blenheim 2018 172.2 2.4 2.7
Blen Marl NZ
The average household size is 2.2 people in Blenheim Central (from 2013
Census data) and 2.4 in Marlborough District, compared with a national
average of 2.7.
The average house
Marl NZ value in the region
is $449,431 versus
$ 449,431 VS $671,145 a national average
of $671,145.
23% NZ
77% of New Zealands
wine grape production
77% Marl comes from Marlborough
18 Housing and Business Development Capacity Assessment for Blenheim 2018Economy and Labour Demand
Marlborough’s economy is largely driven by manufacturing, horticulture and agriculture including wine
production, viticulture, marine farming, forestry and pastoral farming. Manufacturing and Agriculture
accounted for 34.4% of Marlborough’s GDP in 2017.
Infometrics report that Marlborough’s economy has grown by an estimated 3.9% over the year to
September 2018 compared with 3.0%pa growth in 2017. This is above the national average of 2.9%.
Indicators of employment, population growth, retail spending, and residential building consents in
Marlborough all remain strong.
Improving economic conditions are resulting in better labour market outcomes. The average number
of people receiving Jobseeker Support decreased 6.1% over the year to September 2018. Stats NZ
data showed employment within Marlborough businesses (ie excluding self-employment) increased
4.8% over the year to February 2018 – the fastest rate of growth since 2014.
Infometrics also reports that retail spending is increasing rapidly. Retail spending in Marlborough has
grown 7.4% to September 2018, following on from 4.8% growth the previous year. Visitor spending
increased 13% over the past year.16
16 https://ecoprofile.infometrics.co.nz/Marlborough+Region/QuarterlyEconomicMonitor
Housing and Business Development Capacity Assessment for Blenheim 2018 19Seasonal Work Force and Labour Supply
Marlborough’s economy relies heavily on a large temporary workforce employed in seasonal vineyard
and winery work, with over 8,325 temporary positions in 2015/16 in vineyards alone. Seasonal
workers can be employed by wineries and vineyard operators independently or via labour supply
contracting companies. Workers may be Recognised Seasonal Employees (RSE), casual workers
from the region, or casual workers here on working holiday visas from overseas.
The Government’s Recognised Seasonal Employer (RSE) policy allows the viticulture industry
to recruit overseas workers – mostly from the Pacific Islands – for seasonal work. There is an
administrative limit or cap on the number of RSE places that can be taken up in any one year. This
cap was set at 5,000 places nationwide when the scheme was established in 2007, but the success
of RSE has led to increased demand from employers and the cap has been increased regularly. In
2019 it will increase by 1,750 to 12,850 places. It is not yet known how many of those places will be
given to Marlborough. In 2017 the cap for Marlborough was set at 2,240 for the winter season and
1,410 in summer.
Iain Lees-Galloway, Immigration Minister, recently issued four challenges to RSE Employers at their
annual conference:
• “One: Make the industry more attractive to New Zealand workers,
by providing better wages and conditions;
• “Two: Build more accommodation for workers to alleviate
local accommodation pressures;
• “Three: Take greater responsibility for supply chains and labour
contractors to help stamp out migrant exploitation; and
• “Four: transform the horticulture and viticulture industries from low cost
industries to industries based on quality, productivity, and high value products.17
17 https://www.beehive.govt.nz/release/recognised-seasonal-employer-cap-increase
20 Housing and Business Development Capacity Assessment for Blenheim 2018The wine industry is estimating that total worker numbers will need to increase by 24% by 2019/20
with a 35% increase in demand for Recognised Seasonal Employees in order to service the
planned growth in vineyard plantings in the region. This level of increase has not yet been realised
as it requires a significant increase on the number of RSE’s approved by the Government but if
achieved, it would result in the need for an additional 600 RSE approved beds, 442 beds for casuals
and 189 houses for permanent workers.18 Ensuring there is a sufficient and appropriate supply of
accommodation for these employees is essential to increasing the cap for Marlborough.
The Ministry for Business, Innovation and Employment (MBIE) estimates that Marlborough has
the highest forecast growth in labour demand in the country for the period June 2017 to May 2020.
Their short term employment forecasts anticipate demand for an additional 3,500 employees for
Marlborough - the majority of which are for skilled, qualified, managerial, and professional positions19
The RSE demand increases and MBIE labour demand forecasts signal that for Marlborough to fulfil
its economic growth potential, a significant increase in its labour force across both elementary skilled,
skilled and highly skilled positions is required. However, coupled with Marlborough’s rapidly ageing
population, low unemployment, and potential decrease in working age population, the region will rely
heavily on attracting employees from other places. The anticipated demand for labour is not reflected
in Stats NZ population projections - so if this demand is realised, population increases will be higher
than currently predicted. Regional planning needs to take this into account. 2018 Census data and
associated updated population projections are not likely to be available until after mid 2019.
Part One - Housing
Housing Trends
Council has been monitoring market trends under the NPS UDC requirements since the quarter
September to December 2017. This report provides a summary of those indicators over the past
year to September 2018, and is also intended to cover Council’s requirement to report on the July to
September 2018 quarter. The majority of indicators are from the MBIE dashboard and provide results
for the Marlborough Region and Blenheim Ward.
18 From the Marlborough Viticulture Labour Market Survey 2016, Druce Consulting
19 Ministry of Business, Innovation and Employment (2017). Short Term Employment Forecasts 2017 – 2020
Housing and Business Development Capacity Assessment for Blenheim 2018 21Dwelling Sale Prices
The median house sale price in Marlborough District and Blenheim Ward has almost trebled since
2002. Significant increases between 2002 and 2008, possibly due to immigration and intensive
growth in the Marlborough wine industry, were followed by a slight fall after the Global Financial
Crisis (GFC).
Prices have steadily increased since 2012, especially between 2016 and 2017 when sale prices
rose more than 10% in Blenheim, and 8% in Marlborough District, but increases have slowed over
the past year.
In the year to September 2018 median house sale prices rose 3% in Blenheim to an average of
$397,875, and 4% in the Marlborough District to $418,819. The september quarter showed minimal
increases of 0.1% in Blenheim and 1% in Marlborough.
Feedback from stakeholders also confirmed that the market appears to be slowing with homes
staying on the market longer, and a slowing of interest in new home builds, however it is unknown
whether this will pick up again following Christmas or be a continuing trend. Anecdotally there is
considerable interest in Marlborough from potential migrants to the area both from within New
Zealand and offshore. It is thought that the decision on the combined colleges will provide more
certainty around schooling options in Blenheim, with those tempted by a move more likely to follow
through.
Median Dwelling Sale Prices (12 Month Rolling Average)
Reporting Area Quarter 3 2018 Quarter 3 2017 % change
Blenheim Ward $397,875 $386,175 +3%
Marlborough District $418,819 $402,813 +4%
22 Housing and Business Development Capacity Assessment for Blenheim 2018Dwelling Rents
Rents have risen over the past ten years, although not quite to the same extreme as sales prices.
Increases have slowed over the past year. Rents are slightly higher in the Blenheim urban area than
in rural marlborough, suggesting a higher demand for rental properties in town.
The mean annual rent paid in Blenheim in September 2018 was $330 per week, and $326 per week
in Marlborough. This is an increase of 2% for Blenheim over the year.
Feedback from property managers is that rental property is in short supply in Blenheim, and this may
be compounded by changes in government policy which may see some landlords getting out of the
rental market. This coupled with rates in home ownership decreasing across all age cohorts will put
more pressure on an already constrained rental market in Blenheim.
Dwelling Rents (Geometric Mean, 12 Month Rolling Average)
Reporting Area Quarter 3 2018 Quarter 3 2017 % change
Blenheim Ward 330 323 +2%
Marlborough District 326 306 +6.5%
Housing and Business Development Capacity Assessment for Blenheim 2018 23Ratio of Sale Prices to Rents
In Marlborough the price of a median house is nearly 25 times the mean annual rent paid, and in the
Blenheim Ward it is over 23. The ratio has decreased in the last two quarters, reflecting a higher
increase in rents relative to dwelling sale prices.
Affordability
Affordability has decreased over the past two years in Marlborough according to the Housing
Affordability Measure - an experimental indicator developed by MBIE. Marlborough closely mimics
the national trend, falling just below the national average of affordability for both first home buyers
and renters.20
20 The Housing Affordability Measure (HAM) measures trends in housing affordability for the first home buyer household. For potential home-owning households, HAM Buy
calculates what their residual income would be after housing costs if they were to buy a modest first home in the area in which they currently live. Affordability is affected by
dwelling prices, mortgage interest rates and the incomes of rental households. Average income is determined using the average New Zealand household,
both homeowners and renters, nation-wide, in June 2013. A higher number on the chart indicates more households are below the average and a lower level of affordability.
24 Housing and Business Development Capacity Assessment for Blenheim 2018The share of first home buying households in Marlborough with below average income after housing
costs increased from 77.818% in March 2016 to 80.784% in March 2017.
At a national level, the share of potential first home buyer households with below average incomes
after housing costs increased from 77% in March 2016 to 80% in March 2017.
The share of renting households in Marlborough with below average income after housing costs was
65.858% in March 2017, a slight decrease from 66.182% in March 2016.
Nationally, the share of renter households with below average incomes after housing costs remained
unchanged at 61% between March 2016 and March 2017.
March 2017 March 2016 % change
HAM Buy 80.784% 77.818% +2.96%
HAM Rent 65.858% 66.182% -0.32%
Housing and Business Development Capacity Assessment for Blenheim 2018 25Dwelling Stock
According to the MBIE dwelling stock indicator, Marlborough’s dwelling stock increased by around
173 homes in the year from September 2017 and September 2018. Blenheim stock increased by
92 homes.
Dwelling Stock (actual observations from Core Logic Data)
No. of new dwellings
Q3 2018 Q3 2017
from previous year
Blenheim Ward 10,785 10,693 92
Marlborough 19,754 19,581 173
26 Housing and Business Development Capacity Assessment for Blenheim 2018Consents vs Household Growth
This indicator approximates the demand for, and supply of, new dwellings. It measures changes in
demand and how responsive supply is. The data sets used are:
• The number of building consents for new dwellings, lagged by six months to account
for completion time.
• The average change in the number of households per annum (ie. household growth).
This is used as a proxy for demand, and is calculated by dividing the total annual
population by the average household size as at last census (which is 2.4 people in
Marlborough District), and measuring the change from the previous year. Population
projections are updated annually by Stats NZ. It is presented as a 12 month rolling
average.
The number of building consents issued for new dwellings in Marlborough at September 2018 (lagged
by 6 months to account for completion) is a rolling 12 month average of 325 per annum. At the same
time in 2017 it was 247 per annum. Plotted against the average annual change in the number of
households in Marlborough, building consents appear to be keeping up with growth. Household
change data hasn’t been updated since June 2017 however population estimates show growth of
around 400 people in 2018, divided by the average household size of 2.4. This is an approximate
growth of 166 households.
Average annual number of dwelling consents (12 month rolling average)
September 2018 September 2017 Annual change
Marlborough District 325 247 78
Housing and Business Development Capacity Assessment for Blenheim 2018 27Building Consents Council issued 123 building consents from January to September 2018 for new dwellings in the Blenheim Urban Area and 188 in 2017. The number of consents issued has risen steadily over the past few years after a decline between 2007 and 2011. The average number of consents issued over the past three years is 160 per annum. The increases in 2016, 2017 and 2018 reflect new subdivisions becoming available for building. 28 Housing and Business Development Capacity Assessment for Blenheim 2018
Resource Consents
There were 42 resource consents for granted for residential subdivisions between January
and November 2018. These were for the creation of 225 lots. This included 10 consents
from Housing New Zealand incorporated for 24 new allotments.

Assessing Housing Demand
For this Assessment the decision was made to use past building consent rates as the indicator
for residential demand rather than Stats NZ’s population projections. This is preferable for a
number of reasons:
            • Official population counts are only done every five years as part of the Census.
              Current population projections are based on 2013 census data and won’t be
              updated with 2018 census data until at least mid 2019. It is usually recommended
              that Councils use the medium growth scenarios for planning, however recent
              trends show that growth is tracking more along the high growth scenario.
            • Population statistics do not reflect employment growth projections or seasonal
              worker numbers.
            • Building consent data is able to be measured frequently and refers to actual
              development undertaken in the region.

A demand assessment showing different demand scenarios based on the average number
of building consents issued over the past 10 years has been developed. See the table below
‘Residential Demand Assessment’.

Whilst it is the preferred model for this assessment, it is important to acknowledge that
Stats NZ project that the longer term trend is for population to peak around 2033 and then
decline. Natural increases (number of births minus the number of deaths) will not be sufficient
to maintain Blenheim’s population in the long term. This is a trend expected to be seen nationwide.
For this reason, a ‘Mixed Scenario’ has been developed which assesses long term demand
(2028 to 2048) at 90 new dwellings per annum.

Demand based on the mixed scenario shows that an average of just over 100 new dwellings
would be required per annum in Blenheim, (allowing for a higher demand of 160 per year in the
first three years). This scenario equates to a required capacity of 480 new dwellings in the short
term (2018 - 2021), 1,290 in the medium term, and 3,090 for the next 30 years to 2048.

The NPS UDC requires a 20% buffer in capacity relative to demand in the short term,
and 15% in the medium and long term.

Feedback has suggested that demand is anticipated to level off slightly in the short term rather
than follow the same high rate as the past three years, however it would be prudent for Council
to plan for continued high demand at least in the short term (2018 - 2021).

                       Housing and Business Development Capacity Assessment for Blenheim 2018         29
Residential Demand Assessment
Consents have averaged 160 per annum over the past three years, 130 per annum over five years,
and 110 per annum over the last 10 years. It should be noted that the mixed scenario in this model
is close to the Stats NZ ‘high’ projection’ and consequently over the long term the actual demand
could be lower than the developed model due to the likely decline in population growth in the
regions anticipated after 2033. The Mixed Scenario includes a rate of 90 dwellings per annum
from 2028 to 2048 to reflect this. Demand scenarios based on Stats NZ’s projections are
provided below for comparison.
Number of Dwellings Required
Short Term Medium Term Long Term
Demand Scenario (0-3 Yrs) (0-10 yrs) (30 yrs)
Short Term Average (3 yrs) - 160 dwellings p.a. 480 1600 4800
Medium Term Average (5 yrs) - 130 dwellings p.a. 390 1300 3900
Long Term Average (10 yrs) - 110 dwellings p.a. 330 1100 3300
Mixed Scenario* 480 1290 3090
Population Projections Medium Growth Scenario n/a 364 368
Population Projections High Growth Scenario n/a 1013 2476
* Yrs 0-3 @ 160p.a.,Yrs 4-5 @ 130p.a., yrs 6-10 @ 110 p.a., and Yrs 11-30 @ 90 p.a.
Demand Drivers
There are a number of key drivers impacting on both the demand and supply of housing in Blenheim.
These characteristics in particular currently have an influence on both Blenheim’s ability to meet its
economic potential and the housing market and will continue to influence demand over the long term:
• Significant and rapidly ageing population
• Projected labour demand (and current labour shortage)
• Importance of seasonal workers
• Tourism
30 Housing and Business Development Capacity Assessment for Blenheim 2018Typology
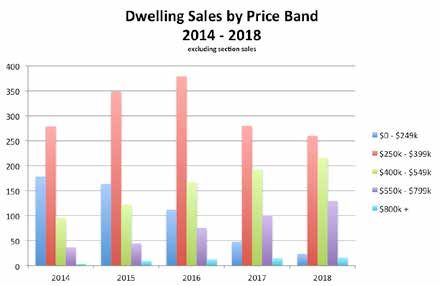
Traditionally there has been high demand in Blenheim for single level standalone homes with 3+ beds
on an average sized section. This appears to still be the case. Homes with 3+ beds have made up
54% of annual dwelling sales on average over the past five years21. There has been low demand
for apartments, townhouses and units - both in terms of sales of existing dwelling stock and when
building new with residences (standalone homes) making up 72% of sales - an average of 546
residences sold per annum over the past 5 years.22
21 Data sourced from the Real Estate Institute of New Zealand, for the suburbs Blenheim Central, Mayfield, Springlands, Witherlea and Redwoodtown,
for the five years 2014 - 2018. Data for 2018 is to October only.
22 REINZ
Housing and Business Development Capacity Assessment for Blenheim 2018 31Future Demand for Smaller Homes and Intensification
Although demand for smaller homes, and more intensive living such as units and apartments has
traditionally been low, it is expected that demand for these types of dwellings will increase over the
medium to long term.
A recent report prepared for the Marlborough Sustainable Housing Trust23 (the Mitchell report) notes
that the relative proportion of people aged 65 years and over in Blenheim is expected to increase
from 21.6% in 2013 to 30.9% by 2033. This is reflected in expected changes in household types,
with the majority of the growth expected in households with couples without children and one person
households. The report states that the projected growth in smaller households may result in a
mismatch between the housing stock and changes in the composition of demand.
Feedback from stakeholders is that there is a shortage of 1 and 2 bedroom homes in Blenheim.
Using the sales data from REINZ as a proxy for supply, this certainly seems to be the case. New
developments can have covenants that don’t allow these smaller homes to be built, meaning supply
will be limited to smaller developments on infill for example, and intensification.
There has been recent interest from Retirement Home providers who are actively looking to build new
retirement villages in Blenheim. This would increase density and provision of housing for the older
population who are able to afford it, and extend the lifespan of the supply of zoned land.
The recent Omaka Landing development included some smaller sized sections (400m2 and under)
which sold well indicating demand for more intensive development - albeit still with standalone
homes. This could be an ongoing demand trend.
Whilst there is understood to be a likely demand for smaller homes in the future, these aren’t being
built in large numbers now and builders and developers don’t consider there to be a significant market
for smaller homes yet. Feedback from other stakeholders suggests, however, that there is current
demand for smaller homes and a shortage of supply.
Infometrics report an increasing trend nationwide towards medium density housing such as
apartments and townhouses. Marlborough appears to be resisting that trend to date, but it is likely to
follow suit eventually and this should be taken into account in demand modelling. Infometrics states
that “Between 1996 and 2009, standalone houses consistently made up between 70% and 80% of
new dwelling consents issued. But since the start of 2017, that proportion has dropped from above
70% to 64%... Across each of the five largest urban centres, townhouses (which also includes flats,
units, and other dwellings) have been expanding their market share over the last 2-5 years. High land
prices and changing lifestyles have persuaded more people to consider living in denser residential
developments. This appetite for intensification is reiterated by the increasing share of apartments in
new residential construction in Auckland, Wellington, and Christchurch.”24
23 Mitchell (Livingston and Associates Ltd) 2017, Marlborough Residential Housing Market Residential Needs Analysis, report commissioned by the Marlborough Sustainable
Housing Trust.
24 Infometrics Article “New attached dwellings more popular than ever” Published 10 January 2019 https://portal.infometrics.co.nz/Articles/Article/9010
32 Housing and Business Development Capacity Assessment for Blenheim 2018You can also read