Housing Assessment Resource Tools - Prototype: City of Kelowna and Findings of a National Survey
←
→
Page content transcription
If your browser does not render page correctly, please read the page content below

August, 2021

Housing
Assessment
Resource Tools

Prototype: City of Kelowna
and Findings of a National Survey

                                      Authors:

                             Carolyn Whitzman
                                Penny Gurstein
                                   Craig Jones
                               Alexandra Flynn
                              Michael Sawada
                                   Rory Stever
                                Mikayla Tinsley
Credits

Authors:

Carolyn Whitzman

Penny Gurstein

Craig Jones

Alexandra Flynn – Readiness Survey

Michael Sawada – Land Assessment

Rory Stevers – Need Assessment

Mikayla Tinsley – Readiness Survey

The report contains hyperlinks to all references and is intended to be read online.

Cover pictures in this report were obtained via Unsplash and are copyright free, by photographers Jeffrey
Eisen and Koby Milton.

Suggested citation: C. Whitzman, P. Gurstein, C. E. Jones, A. Flynn, M. Sawada, R. Stevers, M. Tinsley,
Housing Assessment Resource Tools for Canada: Prototype - City of Kelowna and Findings of a National
Survey (Vancouver: University of British Columbia Housing Research Collaborative, 2021).

SUMMARY
The right to housing is legislated by the Canadian National Housing Strategy Act as of 2019. This means
gradual realization of functional zero homelessness and an affordable, adequate, and suitable home
for every household.

Without simple, robust, equity-focused, comparable and replicable housing need and land assessments
at all levels of government, it is impossible to set meaningful housing targets, or measure progress
towards this right. The Housing Assessment Resource Tools (HART) project aims to support the right to
housing for all Canadians.

In this report, we present initial findings of phase 1 of the project, funded by the CMHC Housing Supply
Challenge. In the first chapter, we outline the rationale for our housing need and land assessment tools
and provide need assessment methods that can identify the size and price points households need to
live in adequate and affordable housing; and land assessment methods that focus on government and
other non-profit land for social housing to meet very low- and low-income household need. In the second
chapter, we prototype these tools in the City of Kelowna, BC. Finally, we report on a national survey of
governments and housing providers on how housing need and land assessments are currently used,
and their opinions on how they could be improved.

A unitary definition of “affordable housing” as costing less than 30% of gross household income is too
broad to generate effective targets to help households at risk of homelessness. Based on methods
used in the US, Vancouver, and Melbourne Australia, we define five household income categories
underlying any housing need assessment:

    1.   Very low income: less than 20-30% of Area Median Income (AMI) or shelter allowance for a
         single person household on benefits, whichever is lower. In many Canadian communities, this
         equates to a housing cost of $375 per month. Approximately 6% of all Canadian households
         in this category are most at risk for homelessness due to inadequate economic and social
         support.
    2.   Low income: 20-49% AMI or one full-time minimum wage, whichever is lower. Considerable
         recent research on ‘rental wage’ shows that the private market is incapable of producing
         sufficient volume of homes in a range of sizes at a housing cost of $750 per month of less.
         This category includes about 16% of Canadian households.
    3.   Moderate income: 50-79% AMI, equivalent to starting salary for a professional job such as
         nurse or teacher. In most Canadian communities, market homeownership, even for a
         condominium apartment is not feasible for this group, approximately 20% of Canadian
         households.
    4.   Average Income: 80-119% of AMI, representing the ‘middle class’ and about 20% of total
         Canadian households. Although few of these households are in housing stress, average
         income households are currently locked out of the first-time homebuyer market in most
         Canadian cities.
    5.   Higher Income: 120% or more of median income, approximately 40% of Canadian
         households. The group with most housing wealth.

                                                                                                      1
We define housing need using census data for those living in unaffordable, inadequate (in need of
major repair) and unsuitable (an appropriate size for the household) homes. It is rare for housing need
assessments to include need by size of household, to include trends on loss of affordable housing, or
to include population projections based on household income categories. We derive this simple
formula:

        [deficit = housing need by income category, divided by size of household] +

        [projected net loss of affordable housing over next 10 years, using 10-year trends and
        assuming Business as Usual (BAU)] +

        [population increase and change related need over next 10 years, using 10-year trends and
        assuming BAU] =

        housing need over the coming decade

The Canadian government has also been committed to a gender and intersectional analysis (GBA+) of
all policies and programs since 1995. Despite this commitment, housing need assessments have
widely varying methods and willingness to analyse housing need by priority populations, which include
single mothers, seniors, youth exiting foster care, people with disabilities, Indigenous and racialized
households.

Rather than using social housing waiting lists or ‘point in time’ counts of homelessness, we base our
housing need data on the Canadian census. We would recommend this method to help derive housing
targets at local, provincial/ territorial, and national levels, which can be adjusted every five years.

In order to meet the need of very low-, low- and moderate-income households (about 40% of all
households), most global housing research recommends scaling up social housing on existing or
acquired government or other non-profit land. In this report, we introduce a Land Assessment Tool that
is simple, comparable, replicable and equity focused. The Land Assessment Tool:

        •   develops a ‘score’ for access to basic services like childcare and public schools;
            groceries; parks; public transit; and medical and social services.

        •   examines the capacity of well-located land, especially government and non-profit land, to
            meet housing need. It includes ‘lazy land’, air rights above single storey uses such as
            parking lots, libraries and health centres.
We have tested both tools in the City of Kelowna, a mid-sized municipality of 140,000 people, which
has already won acclaim from the CMHC and across Canada for its innovative approach to housing
need assessment. We find that despite Kelowna showing remarkable success in combatting loss of
affordable rental housing from 2006-16, there are still high levels of housing need in very low income
and low-income households. Furthermore, Kelowna has particularly high growth rates for seniors
(especially those over 85 years of age) and Indigenous households. The need assessment points to the
need for more ambitious social housing targets, with a priority given to available government land. We
also recommend private market targets that include the need for larger (2-4 bedroom) moderately
priced rental units.

Finally, we report on a Readiness Survey of politicians, housing officers/ planners, and housing
providers across Canada, that measures their use, understanding and methods related to need and
land assessment. We find considerable interest in better housing need and land assessment tools, in
order to generate better policy outcomes.

                                                                                                     2
List of Acronyms
BC: British Columbia

UBC: University of British Columbia

AMI: Area Median Income – the median household income for a Census Area (municipality or region)

HART: Housing Assessment Resource Tool project

BAU: Business as Usual – a continuation of current policy outcomes.

CMA: Census Metropolitan Area, usually an urban region

CA: Census Agglomeration, often equivalent to a mid-sized municipality

CSD: Census Statistical District

                                                                                                   3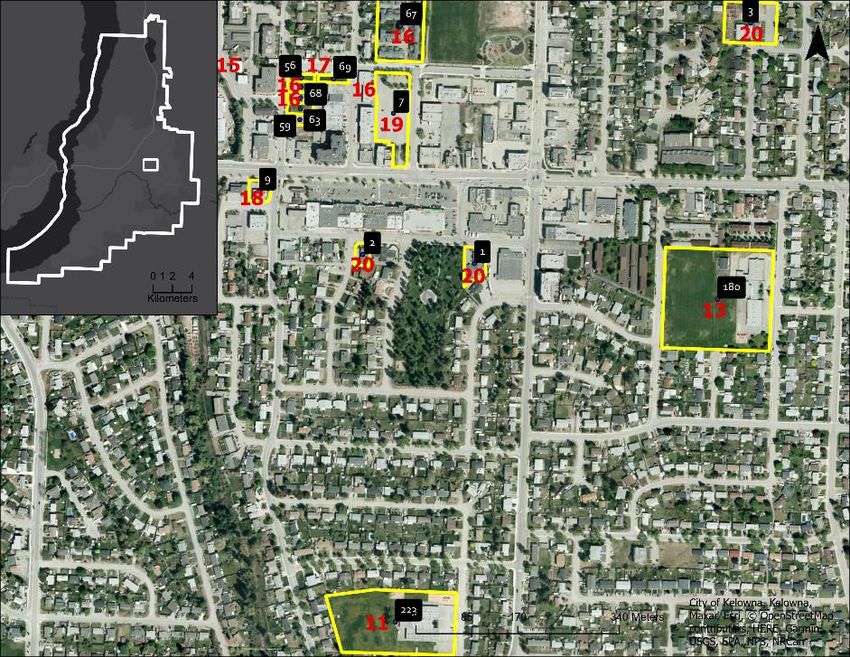
CONTENTS
The role of need and land assessment in ‘right supply’ of housing ..................................................... 7
   Our Affordable Housing Challenge Response: Housing Assessment Resource Tools (HART) ........... 10
   What is a Good Need Assessment? ....................................................................................................... 11
   Our Methodology: Income Categories and Housing Need .................................................................... 13
   Our Methods: Household Size ................................................................................................................ 17
   Our Methods: Gender and Intersectional Analysis (GBA+)................................................................... 18
   Our Methods: Net Loss of Affordable Housing and Trends Over Time ................................................ 20
   What Is a Good Land Assessment? ....................................................................................................... 21
Proof of Concept: Housing Need and Land Assessment in Kelowna, BC............................................ 25
   Introduction to City of Kelowna .............................................................................................................. 25
   Sources of data ....................................................................................................................................... 28
   Income Categories used and Target Housing Costs ............................................................................. 28
   Core Housing Need by Income Category ............................................................................................... 30
   Core Housing Need Deficit by Income Category and Household Size ................................................. 30
   Core Housing Need by Priority Population............................................................................................. 31
   Trends in Loss of Affordable Housing .................................................................................................... 32
   Projected Need Over the Next 10 years ................................................................................................ 33
   Total Projected Housing Need Over the Period 2016-2026 ................................................................ 36
   Land Assessment- Methods and Sources of Data ................................................................................ 37
   Findings: Well-Located Public and Non-profit Land in Kelowna........................................................... 38
   Estimating Yield of Non-Profit Land ....................................................................................................... 41
National Survey on Need and Land Assessment Readiness .............................................................. 43
   Methods................................................................................................................................................... 43
   Respondents ........................................................................................................................................... 43
   Experience in Assessment...................................................................................................................... 44
   Need Assessment Methods ................................................................................................................... 45
   Need Assessment Capacity .................................................................................................................... 46
   Need Assessment Impact....................................................................................................................... 48
   Land Assessment Methods .................................................................................................................... 51
   Land Assessment Capacity .................................................................................................................... 53
   Land Assessment Impact ....................................................................................................................... 54
   Discussion and Conclusion .................................................................................................................... 56
Conclusion....................................................................................................................................... 58

                                                                                                                                                             4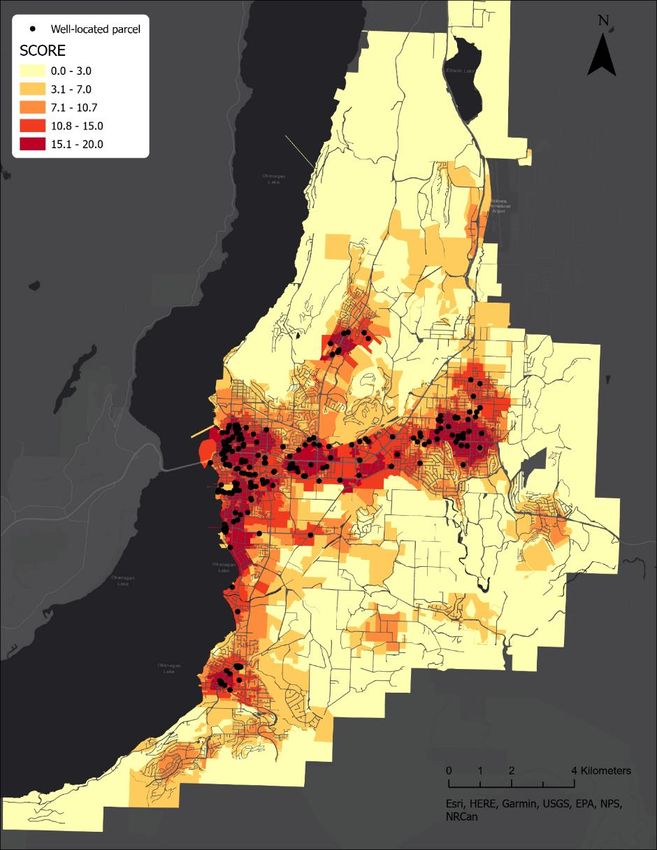
LIST OF FIGURES
Figure 1. Cumulative portion of market purpose-built rental universe that is affordable to each quintile
of the renter household income distribution, select CMAs, 2020 (source: CMHC, 2021)..................... 14
Figure 2. Income category-based housing targets (source: City of Vancouver, 2017) ........................... 15
Figure 3. Reducing Housing Costs (source: McKinsey, 2014) ................................................................. 22
Figure 4. The Housing Wheelhouse (City of Kelowna, 2017)................................................................... 26
Figure 5. The Housing Wheelhouse (City of Kelowna, 2017)................................................................... 26
Figure 6. Median House Price Divided by Median Household Income, four largest BC cities (source: BC-
Canada Expert Panel, 2021) ...................................................................................................................... 27
Figure 7. Household Income Categories by Percentage and Household Total ....................................... 29
Figure 8. Proportion of households in housing need for each income category .................................... 30
Figure 9. Core Housing Need by Household Size X Income Category ..................................................... 31
Figure 10. Housing Need by Priority Population ....................................................................................... 32
Figure 11. Net change in Affordable Housing in Greater Kelowna, 2006-16 ......................................... 33
Figure 12. Household Growth Projection 2016-26................................................................................... 34
Figure 13. Population change by 5 year increments ................................................................................ 35
Figure 14. Population projections, Indigenous people ............................................................................. 35
Figure 15. Total Housing Need by Income Category and Household Size, 2016-26 ............................. 36
Figure 16. Absolute frequency of parcel ownership of the 230 well-located parcels in Kelowna. ........ 38
Figure 17. Locations of well-located parcels in Kelowna and their scores. ............................................ 39
Figure 18. Selected street-view images of parcels within the top four locations ................................... 40
Figure 19.: Examples of high-ranked sites. The white numbers in black callouts are the rank
corresponding to Table 8............................................................................................................................ 41
Figures 20 and 21. Respondents by Province and by Sector .................................................................. 44
Figures 22-25. Experience in Housing Need and Land Assessment ....................................................... 45
Figures 26-27. Inclusion of Income Categories, Loss of Affordable Housing, and Priority Populations 46
Figures 28-30. Barriers and Desired Assistance in Relation to Need Assessment ............................... 48
Figures 31-32. Advantages and Drawbacks, Need Assessment ............................................................. 49
Figures 33-37. Impacts of Need Assessment ........................................................................................... 51
Figure 38-39. Land Assessment Focus ..................................................................................................... 52
Figure 40. Locational Factors, Land Assessment ..................................................................................... 52
Figures 41-43. Primary Barriers and Assistance Required, Land Assessment....................................... 54
Figures 34-35. Advantages and Drawbacks, Land Assessment .............................................................. 55
Figures 46-47. Policy Influence of Land Assessment ............................................................................... 56

                                                                                                                                                    5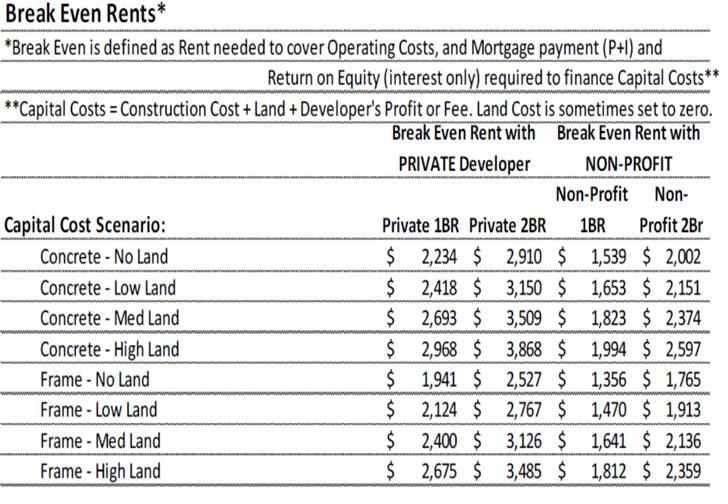
LIST OF TABLES
Table 1. Size of Household and Size of Home, 2016 census (source: Statistics Canada, 2017) ......... 17
Table 2. Break Even Rents in Capital, Land and Developer Scenarios (source: Coriolis, 2019) ........... 23
Table 3. Total new housing requirements 2021-2026, four largest BC cities (source: BC-Canada Expert
Panel, 2021) ............................................................................................................................................... 28
Table 4. Net Change in Housing Supply, four largest CMAs, BC (source: BC-Canada Expert Panel, 2021)
..................................................................................................................................................................... 28
Table 5. Income Categories and Target Rents ......................................................................................... 29
Table 6. Total Housing Need by Income Category and Household Size, 2016-26 ................................. 36
Table 7. Amenity/Service Scoring Tool for Kelowna ................................................................................. 37
Table 8. 20 Locationally top-ranked sites for social housing, Kelowna .................................................. 41
Table 9. Simplified method for calculating yield (source: Palm, Raynor and Whitzman, 2018)............ 42

                                                                                                                                                                     6
THE ROLE OF NEED AND LAND ASSESSMENT IN
‘RIGHT SUPPLY’ OF HOUSING
This report presents the initial findings of a multi-year national project, funded by Impact Canada and
the CMHC’s Housing Supply Challenge, to improve planning for affordable housing. As a result of the
first stage of our work, we report on:

    1. Better need assessment methods that can identify the size and price points a range of
       households need to live in adequate and affordable housing
    2. Better land assessment methods that focus on government and other non-profit land for social
       housing
    3. Prototype need and land assessment tools tested, through a proof of concept in the City of
       Kelowna.
    4. A national ‘readiness’ survey of politicians, planners and housing providers to discover their
       use of, and opinions on, housing need and land assessment.

Without easy-to-use, robust, equity-focused, comparable and replicable housing need and land
assessments at all levels of government, it is impossible to measure progress towards eliminating
homelessness and gradually enabling the right to adequate housing for all. Take the example of Finland.
Finland has been hailed for being one of the few countries that is gradually eliminating homelessness.
Finland uses an inclusive definition of homelessness which includes overcrowding and staying with
family and friends as well as rough sleeping and use of emergency shelters. It estimates that 78% of
homelessness is hidden by traditional ‘point in time’ homelessness counts, which focus on those
sleeping outdoors or in emergency shelters, or otherwise accessing homelessness services. ‘Point in
time’ counts tend to grossly underestimate people (often women) doubling up in overcrowded homes
with family or friends, or living in violently unsafe situations. In 1987, when national data began to be
collected, there were 1,370 homeless families and 17,110 single homeless persons in Finland. In 2019
there were 264 homeless families and 4,600 individuals in this country of 5.5 million people, mostly
‘doubling up’ in overcrowded households, with no rough sleeping and fewer than 55 people in
emergency shelters. Finland is thus close to ‘functional zero’ homelessness, although there is still more
work to be done to provide an adequate, affordable home for all Finns.

                                                                                                       7
Finland’s success in working towards the elimination of homelessness is due to senior government
leadership and clear shared definitions underlying good multisectoral planning. All levels of government
use a consistent definition of inadequate housing conditions and conduct regular need assessments.
These need assessments underly target-based agreements between national and municipal
governments and housing providers.

Finland also relies heavily on using government land for social housing, and regularly acquires land and
buildings to expand its supply of social housing. Non-profit housing providers in that country supply
about 9,000 dwellings a year through a combination of acquisition and new build. The equivalent target
in Canada would be 63,000 new non-profit homes a year, or 819,000 new social homes in the 2017-
2030 period of Canada’s National Housing Strategy, as compared to the current 150,000 target.

COVID-19 has increased evictions and risk of homelessness for low-income groups, especially from
marginalized communities, requiring a rethink of these national targets. A recent (June 2021) report
from a Canada-BC Expert Panel on Housing Supply and Affordability recommends a stronger role for
housing need assessments, which should be developed every five years using census data and inform
targets and plans to achieve those targets. A consensus is emerging: in order to gradually realize
adequate housing for all, that complementary national, provincial/ territorial and municipal/regional
targets must be based in a robust and replicable need assessment process, using similar definitions
and methods.

Finland has had a coordinated multisectoral effort to realize the right to housing since the 1980s, based
on evidence of what works. Many countries, including Canada, have moved in the opposite direction.
The Canadian government used to support land and home banking, acquiring property and existing
housing to preserve and expand low-cost options. It used to work with provincial/territorial governments
on direct provision of public housing for low-income households. It has shifted to requiring municipal
and regional governments with the fewest powers and resources to steer a complex network of mostly
private housing developers, with some residual non-profit and state providers who cannot fully meet
the need of low-income households. Evidence, particularly growing homelessness, suggests that the
weak governmental steering system used from the early 1990s onwards does not have the capacity to
adequately manage the provision of this essential right and need. Need assessment leading to
spatialized targets related to ability to pay, along with a land policy that enables low-cost housing, are
essential to enabling positive housing outcomes and ending homelessness.

Unlike Finland, there is currently no standardized method among Canada’s three levels of government
to measure housing need. There is an essential starting point for such a method: a national definition
of “Core Housing Need” if a home does not meet one or more of the adequacy, suitability or affordability
standards. Affordable housing costs less than 30% of before tax household income, whether paid in
rent or mortgage. Adequate housing does not require any major repairs, according to residents. Suitable
housing has enough bedrooms for the size (number of people) and makeup (gender, single/couple,
etc.) of the need of the households, according to National Occupancy Standard (NOS) requirements. No
level of government, including the federal government, has an accounting of the current deficit of
adequate homes by price points (what households can afford) or sizes of household. Meanwhile, the
deficit grows ever larger.

No government-led housing need assessment has tracked loss of affordable housing at various price
points, such as $375 a month (the maximum shelter amount provided by social assistance to
individuals in many provinces and territories), or $750 a month (which would be affordable to a
household with one full time minimum wage job). It has been estimated that between 2011 and 2016,
15 affordable homes at $750 or less were lost for every one new social home constructed in Canada.

                                                                                                        8
Furthermore, most housing strategies aim to address a deficit that may well increase over the five- or
ten-year lifespan of a plan. The need of growing and changing populations must be included in need
assessment.
The problem is sometimes simplified as one of overall supply, with simplistic solutions like eradicating
regulatory controls on home construction, especially in the outskirts of already sprawling cities. But
there is no overall housing shortage, as was the case during World War Two. In aggregate, Canadian
households are over-housed: we have more bedrooms than individuals (see Table 1). Instead, there is
a ‘right supply’ issue: there are critical shortages in low-cost adequately-sized homes, particularly in
larger cities. The CMHC has found that only 0.2% of apartments in Canada’s largest cities are affordable
to those households in the lowest income quintile. The Canadian Centre for Policy Alternatives has
found that there are only 24 of 795 neighbourhoods (3%) in Canada where a full-time minimum wage
worker can afford to rent an average two-bedroom apartment. There are only 70 neighbourhoods (9%)
across Canada where minimum wage earners can afford a one-bedroom home. One in four Canadians
earn within $3 of their province’s minimum wage.
Disaggregated data on marginalized groups is also weak and inconsistent. Since March 2020,
according to the CMHC, “the COVID-19 crisis has amplified existing housing affordability and
homelessness issues for people and populations who are vulnerable.” Almost half of tenant households
in Canada do not have enough savings to pay the next month’s rent if they lose work – and many have
been losing work over the past year, particularly in the tourism and hospitality sector. Eighty percent of
those who lost their service jobs were women. By the end of 2020, across Canada’s large cities, 6.1%
of tenants were in arrears, with 116,929 households collectively owing approximately $55 million in
rent. The state of housing for seniors has been revealed as grossly inadequate, with COVID-19 deaths
concentrated in privately-owned long-term care homes (LTCs). During the first wave in Ontario, 73% of
deaths were in for-profit homes, despite for-profits only operating 54% of beds. Despite municipal
homeless shelters promising better distancing, overcrowded congregate living spaces have become
another fulcrum of COVID-19 cases, prompting a growth in encampments.
Local, provincial/territorial and national targets based in consistent, comparable and replicable need
assessments can inform coordinated and effective housing strategies. One example is the federal
Rapid Housing Initiative. Introduced as a one-time stimulus program in September 2020, it was initially
a $1 billion program to help address urgent housing need of vulnerable Canadians, especially in the
context of COVID-19. It has a target to construct 3,000 affordable homes over 18 months. There are
two streams: construction of rapid modular housing, usually with support services; and acquisition of
land and buildings for affordable housing. Most of the agreements were between the federal
government and municipalities, with Indigenous governments also eligible for funding. Social supports
associated with housing came from provincial/ territorial governments. This program, which has been
continued and expanded by $1.5 billion in the 2021 budget, is a good example of inter-government
coordination. The federal government also required data from municipalities on need of priority
populations, including women heads of households, Indigenous households, seniors, and people
experiencing homelessness, as well as identification of suitable, preferably government-owned land for
rapid construction of housing. The Rapid Housing Initiative appears to be the most efficient and
effective housing program introduced since the federal government’s re-entry into the housing policy
space in 2017. It should continue to be expanded to encompass acquisition of existing privately owned
affordable housing.
This brings us to the next challenge. Numerous global reports have concluded that use of well-located
government land for social housing, along with government acquisition of land and buildings for social
housing, are the most effective mechanisms for meeting affordable housing targets. Land costs
9comprise between one quarter to one third of housing costs in most major cities and “public land
ownership… holds the key to affordability in cities where middle- and lower-income families are unable
to compete with corporate investors”. The use of non-profit developers also brings a cost savings of
between 20-30%. The CMHC has a set of ‘social inclusion’ criteria for well-located land, but few
Canadian municipalities have mapped the potential of government and non-profit land that could be
used for social housing. An easy-to-use, replicable, and comparable Land Assessment Tool would help
immeasurably in addressing housing need across Canada, especially if the Rapid Housing Initiative is
to be expanded and include acquisitions of properties
Our Affordable Housing Challenge Response: Housing Assessment Resource
Tools (HART)
To address these national need, and supported by the federal Housing Supply Challenge, the Housing
Research Collaborative at the University of British Columbia (UBC) has created a need assessment tool
based on international best practice, and a land assessment tool to model scenarios to meet need. We
have tested these tools in the City of Kelowna, BC. We also developed a national survey of politicians,
housing planners and providers to test readiness for national need and land assessment tools. This
report summarizes this research.
The Housing Supply Challenge is part of a broader federal initiative called Impact Canada, which seeks
innovative solutions to social, economic and environmental challenges. The Housing Supply Challenge,
supported by the CMHC, focuses on the barriers that limit the creation of new housing. There will be a
total of six themed rounds of the challenge, but the first round has been on Data-Driven Solutions.
The research team engaged in this effort has included a range of expertise: urban planning, geomatics,
law, computer science and data management. The 10-member Advisory Committee has represented
governments and housing providers and financers who have taken innovative approaches to need and
land assessment, including:
• The City of Kelowna, where we have tested our need and land assessment tools, known for
their ground-breaking approach to housing need
• The City of Vancouver, who have taken an income-category based approach to housing
targets, and though their land company Vancouver Affordable Housing Agency, have enabled
thousands of rapidly-constructed social units on government land in recent years, including
modular supportive housing for very low income households
• The City of Toronto, which has adopted the Vancouver approach to rapid construction of
modular supportive housing on government land
• BC Government’s Ministry of Municipal Affairs, which has pioneered a standardized need
assessment tool and resources for local governments
• BC Non-Profit Housing Association, which developed the Canadian Rental Housing Index
• VanCity Credit Union, who have funded research and financed affordable housing.
• The Women’s Housing and Homelessness Network, which has engaged in gender and
intersectional analysis of housing need.
• The Aboriginal Housing Management Association, which has engaged in analysis of how well
urban Indigenous populations are considered in housing need assessment.
• The BC Community Land Trust, which has scaled up development and perpetual retention of
non-profit land for social housing
• The Federation of Canadian Municipalities, which has championed land and home acquisition
as part of COVID-19 recovery
10In this report, we describe a Housing Need Assessment Tool that calculates housing need using the
following simple formula:
[deficit = housing need by income category, divided by size of household] +
[projected net loss of affordable housing over next 10 years, using 10-year trends and
assuming Business as Usual (BAU)] +
[population increase and change related need over next 10 years, using 10-year trends and
assuming BAU] =
housing need over the coming decade
We further attempt to disaggregate housing need using 13 priority populations: (1) survivors, especially
women and children, fleeing domestic violence; (2) single mothers; (3) seniors over 65; (4) young adults
aged 18-25; (5) Indigenous peoples; (6) racialized groups; (7) newcomers, including refugees; (8)
LGBTQ2S+; (9) people with physical disabilities; (10) people with intellectual disabilities; (11) people
with psychosocial disabilities (mental health and addiction issues); (12) veterans; (13) homeless
people. Unfortunately, our reliance on census data means that the needs of LGBTQI2S+, women and
children fleeing domestic violence, veterans and homeless people is currently lacking.
In this report, we also introduce a Land Assessment Tool that is equally easy to use, comparable,
replicable and equity focused. This responds to the fact that numerous global reports have concluded
that use of existing well-located government land for affordable housing, along with government
acquisition of land and buildings for affordable housing, is the most effective mechanism for meeting
affordable housing targets. The Land Assessment Tool:
• develops a ‘score’ for access to basic services like childcare and public schools;
groceries; parks; public transit; and medical and social services.
• examines the capacity of well-located land, especially government and non-profit land, to
meet housing need. It includes ‘lazy land’, air rights above single storey uses such as
parking lots, libraries and health centres.
We have tested both tools in the City of Kelowna, a mid-sized municipality of 140,000 people, which
has already won acclaim from the CMHC and across Canada for its innovative approach to housing
need assessment.
Finally, we report on a Readiness Survey of politicians, housing officers/ planners, and housing
providers across Canada, that measures their use, understanding and methods related to need and
land assessment.
What is a Good Need Assessment?
A Housing Need Assessment is
a planning tool which assists the process of identifying the specific housing need of a city. This
multi-step process is a way for planners to understand which policies, strategies, and
frameworks are the most useful.
In order to steer an essential right and need such as housing, all levels of government need evidence-
based targets related to ability to pay housing costs, with regular monitoring in relation to achievements
11towards these targets. However, “many housing need assessments methodologies exist” across
Canada, but few are “innovative”.
Internationally and nationally, housing need assessments have used a combination of:
• Deficit of affordable housing, often broken down by income categories, household size, and
vulnerable sub-populations
• Trends in loss of affordable housing
• Projections of population growth and change over a planning period, say 10 years.
In 1944, the Canadian Advisory Committee on Reconstruction responded to an absolute housing
shortage affecting all Canadians during World War Two. Its ‘Curtis Commission’ report on housing used
three income categories (High, Medium and Low, corresponding to household income thirds) to
recommend that 33% of all new housing be developed as public housing by the federal government. In
1972, a report commissioned by the CMHC used the method developed by the Curtis Commission to
recommend that 45% of all new housing be developed as non-profit housing.
In 1966, the Singapore government estimated the need for 146,000 new public homes over 10 years
for a total population of 1.8 million (about 35% of households) to address existing deficit, projected loss
of dilapidated housing for redevelopment, and population growth. It met this target through aggressive
land acquisition and public housing construction.
Canada’s National Housing Strategy, published in January 2018, represents a re-entry into national
leadership on affordable housing after three decades of neglect. The headline housing need figures,
using 2016 census data, are 1.7 million Canadian households who are in core housing need, a little
less than 13% of all households. The report also provides a figure of 25,000 Canadians who are
chronically homeless (defined as homeless for more than five months), with a further 210,000
Canadians experiencing episodic homelessness.
The federal government’s 13-year targets (2017-2030) are to reduce the number of households in core
housing need by 525,000, through a combination of 150,000 new deeply affordable homes, some
renewal and repairs of existing homes, and housing subsidy. That target would meet the need of only
30% of households in existing deficit as of 2016. It does not take into account any net loss of affordable
housing or increased housing need because of population growth over the 13-year period of the plan.
The federal government also aims to reduce by 50% those who are in chronic homelessness. There is
no account taken of upward trends in chronic homelessness as affordable housing is lost, nor of
population projections. The only population sub-target in the National Housing Strategy is 25% of
housing for women and girls. There is no statistical justification provided for that sub-target.
But there are signs that a more rigorous approach to housing targets may be on its way. The National
Housing Strategy Act (2019) commits the federal government, and by extension, all other governments
in Canada, to a rights-based approach. The act includes a policy focus on “those in greatest need” and
a commitment to the “progressive realization of the right to adequate housing”, which means ensuring
that no households should be in core housing need. In the September 2020 Throne Speech, and in
response to growing concerns about increasing homelessness, the Canadian government committed
itself to ending chronic homelessness by 2030. Canada’s housing agency, the Canada Mortgage and
Housing Corporation (CMHC) has an “aspirational goal… to eliminate housing need, to ensure that by
2030, everyone in Canada has a home that they can afford and that meets their need.”
In order to accomplish aspirational goals such as “eliminating housing need” or “eradicating
homelessness”, a clear and consistent definition of affordable housing must be used at all levels of
12government, one that focuses on adequately sized housing that costs no more than 30% of a
household’s income. The evidence is clear that renters are twice as likely to be in housing need and
have half the income of homeowners, and that over 50% of those in the lowest income quintile (0-40%
Area Median Income) are in housing need.
The advantages of our Housing Need Assessment Tool include the following attributes:
1. Comparable: municipalities, regions, provinces/ territories, First Nations should all be able to
use a similar approach to assessing need that uses income categories as a basis for housing
cost targets; and where results can be compared between areas and across scales.
2. Easy to use: smaller municipalities and regions should be able to easily calculate need using
publicly available data. They should not need to pay consultants to undertake extensive local
surveys in order to find basic quantitative data.
3. Robust and Replicable: The need assessment should rely upon, where possible, nationally
data collected at regular intervals such as census and Canadian Housing Survey, where such
data is available at the Census Subdivision/ Census Metropolitan Area scale. It should
include net loss of affordable housing in its calculations as well as projecting future housing
demand over the life of a 5- or 10-year housing strategy.
4. Equity focused: Need assessment should consider differing sizes of households as well as
specific need associated with gender, age, experience of violence, Indigeneity, racialization,
differing abilities, and sexuality/gender identity.
Our Methodology: Income Categories and Housing Need
Affordable housing in Canada is defined as a home “that can be owned or rented by a household with
shelter costs (rent or mortgage, utilities, etc.) that are less than 30% of its gross income”. However, a
patchwork of legacy programs and policies at all three levels of government have used definitions of
‘affordable housing’ that have nothing to do with low-income households’ ability to pay shelter cost. For
instance, the Rental Construction Financing Initiative, first announced in 2017 as part of the National
Housing Strategy, has received $25.75 billion in low-cost construction loans, roughly ten times the
amount the Canadian government has provided for the Rapid Housing Initiative. This program defines
affordability as: “At least 20% of units must have rents below 30% of the median total income of all
families for the area, and the total residential rental income must be at least 10% below its gross
achievable residential income.” This results in an “affordable rent benchmark” that is more than
$2,000/month in most Canadian cities, much more than any low-income household can afford, and
30-40% higher in many cases than median market rents.
Most municipal housing need reports use waiting lists for social housing, which in turn is defined as
non-profit housing owned by community housing providers and housing co-operatives, or housing
owned by provincial, territorial or municipal governments. The problem is waiting lists in most
communities now include thousands of households waiting up to 17 years for subsidized housing. In
Ontario, households can be removed from the waiting list if they refuse one offer even if the unit is in
poor repair or is an inaccessible location in relation to necessary services. They can also be removed
from the list if they are in arrears to a social housing provider. Those who take advantage of a housing
subsidy in a private unit will also be dropped from social housing waiting lists, even if the unit is in poor
repair or is inadequate in size. For these reasons, social housing waiting lists may grossly underestimate
true household need. The disadvantage of using census data for “core housing need” is that it is only
available once every five years. The advantage is that it is the most accurate method of measuring the
13number of households who are in unaffordable, unhabitable or unsuitable housing, divorced from the
politics of trying to reduce social housing waiting lists.
Most municipal housing reports also use ‘point in time’ homelessness count those sleeping without
shelter, in emergency shelters, or using homeless drop-in services. This method drastically undercounts
women, girls and gender diverse people who are more likely to ‘double up’ with other households, stay
in unsafe and exploitative relationships, and exchange sex for shelter rather than risk the violence and
potential loss of child custody associated with the emergency shelter system. The separation of
‘homeless services’ from ‘housing’ in municipal strategies does not reflect the fact that the increase in
homelessness since the 1990s is directly linked to federal defunding of social and affordable housing
policies and the consequent loss of very low-cost homes.
The CMHC, the Canadian Rental Housing Index, and many municipalities now use income categories to
define housing need. However, their methods vary. The CMHC uses income quintiles (Figure 1), the
Canadian Housing Rental Index uses income quartiles, and many municipalities use increments of
$10,000 or income deciles. Whatever the method used, it is clear that the most acute issue is not
housing supply per se, it is housing supply at particular price points. In particular, it is the lowest income
category who are overwhelmingly the most likely to be in housing stress, followed by those in the second
income category. In some markets, like Toronto and Vancouver, the third income category faces some
housing stress as well.
Figure 1. Cumulative portion of market purpose-built rental universe that is affordable to each quintile of the renter
household income distribution, select CMAs, 2020 (source: CMHC, 2021)
14This is the reason that cities like Vancouver provide specific income and price point targets (Figure 2).
Those very low-income households earning less than $15,000 can only afford $375/month in housing
charge (rent or mortgage payment), no matter what the size of household. As is the case in the US, Area
Median Income (AMI) varies from locality to locality. While the Canadian median household income was
roughly $57,000 in 2016, AMI in Montreal was only $61,747, while AMI in Ottawa was $85,961.
Figure 2. Income category-based housing targets (source: City of Vancouver, 2017)
Using income quartiles or quintiles result in categories that have too much variability in income,
especially at the low end. There is too big a difference in ability to afford housing cost between a very
low-income household with $15,000 a year and a moderate income one with $39,000 a year, even if
they are in the same income quartile in a city like Toronto, where the median household income is
$78,378. On the other hand, income deciles and increments of $10,000 result in too many categories
for clear and meaningful targets. We suggest five main income categories, based on Vancouver and US
income categorization:
1. Very low income: This income category usually consists of households reliant on government
benefits: seniors’ pensions, disability or unemployment insurance. In most localities and
household configurations, this would be an annual income of less than $15,000, or about 20-
30% of AMI. Some households, particularly seniors, may be ‘house-poor’, with having paid off
a mortgage but with very low pension incomes creating housing stress in relation to property
taxes and heating costs. With a grossly inadequate shelter allowance of ~$375 for a single
person on benefits in most provinces and territories, the choice for most very low-income
households is social housing, highly subsidized private rental, or homelessness. The market is
incapable of supplying maximum rents of $375 or house prices of $45,000 in most Canadian
communities and the amount of subsidized rent-geared-to-income homes (both social and
private market with rent subsidy) does not come close to meeting need. Across Canada, the
proportion of households earning less than $15,000 in the 2016 census was 5.7%, or
803,680 households.
2. Low income: This income category consists of households reliant on a single full-time
minimum wage earner, or two part-time minimum wage earners, equating to 20-49% AMI in
most communities. Minimum wage ranges from $11-14 an hour across Canada, so the
income range would be $15-30,000/ year in most areas (assuming a 40-hour work week and
no vacation in casualized employment). Considerable recent research on ‘rental wage’ shows
that the private market is incapable of producing sufficient volume of homes – let alone in a
range of sizes – to meet the need of low-income households with a maximum rent of $375-
15750 per month. Across Canada, the proportion of households earning between $15,000 and
$30,000 a year in the 2016 census was 16.2% or 2,310,930 households. The vast majority
of those 1.7 million households in housing need in 2016 are low and very low-income
households, who together comprise about 22% of the population. In France, municipalities
have national targets of 20% social housing (with a higher proportion of new social housing to
address existing deficits), and the proportion is 25% in Paris.
3. Moderate income: These households are often employed in so-called ‘key worker’ jobs,
equating to 50-79% of AMI. Starting salary for a nurse is about $41,000 in Canada; starting
salary for a teacher is $30,000 and average salary is $40,000 per year. Assuming an income
range of $30-55,000/ year in most areas, this equates to a house price of $105-165,000 or
a maximum monthly rent of between $750 and $1,375. Private market construction without
large-scale government subsidy might not result in affordable rents in this range, especially
for larger households and in high-rent cities. In most large communities, market
homeownership, even for a condominium apartment, would not be economically feasible
either. With some of the highest homeownership costs in the world, Canadian moderate-
income households are increasingly reliant on rental housing. Moderate-income households
can afford private rental in most urban areas if and only if there is strong regulation against
rent increases, including vacancy control (not reverting to market rent with a new tenant). An
example of strong rent regulation is Germany, where rents are set by size of apartment, and
rent control applies even with change of tenants or renovation. Moderate-income households
can also help cross-subsidize very low- and low-income households in mixed-income social
housing. Across Canada, the proportion of moderate-income households in 2016 was 19.8%
or 2,782,270 households.
Given that very low-, low- and moderate-income households together constitute 41.7% of
households, that market rents and homeownership in most large Canadian cities are currently
unaffordable to all of these income categories, and that sustainable social housing needs a
range of rents in order to be viable, these figures suggest that in Canada, at least a third of
homes should be some form of non-profit housing (including non-profit co-operatives) in order
to realize the right to adequate housing.
4. Average Income: These households earn between 80-119% of median income and represent
the ‘middle class’. Across Canada, the median before-tax household income was $70,338, so
this would equate to an income range of $55-85,000 in most Canadian cities. In the past, this
income category has not been included in affordable housing need assessment. But it is now
likely that middle-class young people without inherited wealth cannot enter the
homeownership market in most large Canadian cities. The median multiple used by most
international surveys assumes three times household income, or a house price ranging
between $165,000-255,000 being affordable for average income households, a price that is
less than a fifth of the median house price in Vancouver, a quarter of prices in Toronto, a third
of the price in Ottawa and half the median price in the greater Montreal region.
Monthly rents between $1,375 and $2,110 may not be widely available in a growing number
of Canadian cities such as Vancouver, Victoria and Toronto. There are measures that could
bring down homeownership prices, and reduce unequal tax burdens placed on renters:
restricting investment ownership of residential property, greatly reducing capital gains tax
exemptions for house sales, progressive property taxes (higher rates for higher-value houses),
an end to taxing apartment buildings at higher commercial rates (which simply passes on tax
burden to tenants), property tax surcharges for second properties or vacant properties. There
is concern that these measures would have negative impacts on older households whose
homes are their major source of equity and retirement savings.
Across Canada, the proportion of average income households in 2016 was 20.6% or
2,901,791 households. In the absence of measures to rapidly decrease home prices in
16Canada, there is a strong argument that about one third of homes should be rent-regulated
private rental, to meet the need of some moderate and most average income Canadian
households.
5. Higher Income: Households earning 120% or more of median income would be considered
higher income for the purposes of housing policy. It is assumed that they would not be in core
housing need for either rental or ownership. Across Canada, the proportion of higher income
households in the 2016 census was 40.7% or 5,725,957 households. There is thus a strong
argument, especially given existing deficits of low-cost affordable housing, that housing
targets should, as is the case in some German cities, aim for a ‘rule of thirds’: one-third social
housing, one-third rent-regulated private rental, and one-third market rental or ownership. It is
also possible that wealth taxes such property taxes should have a progressive element I.e. tax
higher-income households at a higher rate.
Our Methods: Household Size
It is a sign of inadequate gender and intersectional analysis that there is still so much emphasis on
studio and one-bedroom apartments for very low-income households. There is evidence that single men
are more likely to be chronically homeless in terms of traditional metrics like point in time counts.
However, as discussed above, much of women’s homelessness and housing stress is invisible,
including overcrowding, living in unsafe accommodation, and staying in violent relationships in order to
avoid homelessness. Some single mothers, especially Indigenous single mothers, are excluded from
smaller low-cost homes because of concerns about overcrowding. They then risk losing custody of
children due to inadequate housing conditions. Once they have lost custody, they find it very difficult to
access larger low-cost units, a precondition for regaining custody.
It is thus vital that housing need assessment include the size as well as the income of households in
need. Canada does not have an overall problem with housing supply. Many households are over-housed
(Table 1) and 1.2 million households – almost one in 10 – own multiple properties. Both over-housed
households and multiple property owners tend to be over 50 years of age, often empty-nesters with
property-based wealth.
Size of household Proportion Size of home Proportion
1 person 28.2% 0-1 bedroom 14.3%
2 person 34.4% 2 bedroom 25.2%
3 person 15.2% 3 bedroom 34.4%
4 person 13.8% 4 bedroom+ 26.1%
5 person + 8.4%
Table 1. Size of Household and Size of Home, 2016 census (source: Statistics Canada, 2017)
Especially as Canadians are priced out of the homeownership market, it becomes important to set
targets for size as well as price of homes, especially rental apartments. The City of Montreal now
requires all new multi-family developers to provide at least 20% of all homes as 3+ bedroom, including
in the 20% of units that need to be set aside for social housing. This is actually slightly less than the
22.2% of 4 person plus households in Canada. The setting of price and size targets at all levels of
government need to be informed by a rigorous need assessment that takes into account that whether
a low-income household has a single person or two adults and three children, it is their ability to pay
that informs their housing options.
17Our Methods: Gender and Intersectional Analysis (GBA+)
Data that is disaggregated by gender, race, disability, age and other grounds can reveal patterns of
structural inequality. Disaggregated data is an essential first step in redressing injustice and realizing
the right to housing for all. The Canadian government and several provinces and territories have
adopted Gender-Based Analysis Plus (GBA+), which is “an analytical tool applied across government to
assess differential impacts of policies, programs and initiatives on diverse groups of women, men and
gender-diverse people with considerations of intersectional socio-demographic factors such as race,
ethnicity, income, age and disability”. The CMHC is requiring evidence of intersectional analysis in
housing programs such as the Rapid Housing Initiative.
There are 12 groups that the CMHC defines as priority populations for affordable homes: groups for
whom the general population proportion of 13% of households living in housing need is greatly
exceeded. There is also a 13th group, women-headed households and specifically single mothers,
implied in the National Housing Strategy targets of 25% of funding going to housing for women-led
households. It is important to recognize that most people do not fall into uni-dimensional categories,
and that intersectional identities of multiple individuals within households influence housing need (e.g.
an Indigenous single mother living with a parent who has multiple disabilities).
1. Women and children fleeing domestic violence: COVID-19 has exacerbated already high levels
of violence in Canada, with about 50% of women reporting at least one experience of physical
or sexual violence since the age of 16. The majority of women who face violence in their
homes do not access shelters or emergency services such as police, which makes it very
difficult to calculate housing need in this population group. Only 14% of women exiting
violence against women shelters are able to access adequate housing. Women and children
fleeing violence may require physical and mental health support services as well as
affordable and well-located housing.
2. Female heads of households in general, and single mothers in particular: In 2016, 40% of
Canadian households were led by women. Female-led households were almost twice as likely
to be in housing need than male-led households: 27% of women-led sole parent families are in
housing need, as compared to 16% of male-led sole parent families. COVID-19 has hit women
with young children disproportionately; women with children under 6 have represented two
thirds of those exiting the labour force during the pandemic. In this need assessment we focus
on the housing need of single mothers, especially because of the deficit of larger low-rent
homes. Well-located homes near childcare, schools, and parks/ playgrounds are particularly
important for this group.
3. Seniors : People over 65 are the most rapidly growing age group in Canada; with a 68%
expected growth rate over the next 20 years. A little less than 15% of the population is over 65,
but by 2041, the proportion may well be close to one in four. One quarter of seniors living alone
are in housing need. COVID-19 has exposed inadequate housing conditions in many seniors’
homes, especially privately-run long term care homes. Well-located accessible homes, often
with on-site or nearby health services, are particularly important for this group as they age in
place and as many move from independent to assisted living.
4. Young adults : Young adults aged 18-25 are about 1.7% of the Canadian population. Almost
one quarter of young adults aged 18-25 who do not live with parents are in housing need.
Almost three quarters of young women experiencing homelessness and 80% of gender-diverse
young people experienced abuse as a child. Access to public transit, education and
18You can also read