Housing Data to Assist in Housing Policy Development
←
→
Page content transcription
If your browser does not render page correctly, please read the page content below
PARTNERSHIPS PATHWAYS POLICY PLACE

Housing Data to Assist in Housing Policy
            Development
                              9th March 2020
                      Professor George Earl (PhD)
       National Affordable Housing Consortium: Head of Research
     Sustainable Living Infrastructure Consortium: Head of Research
                 Honorary Professor: Griffith University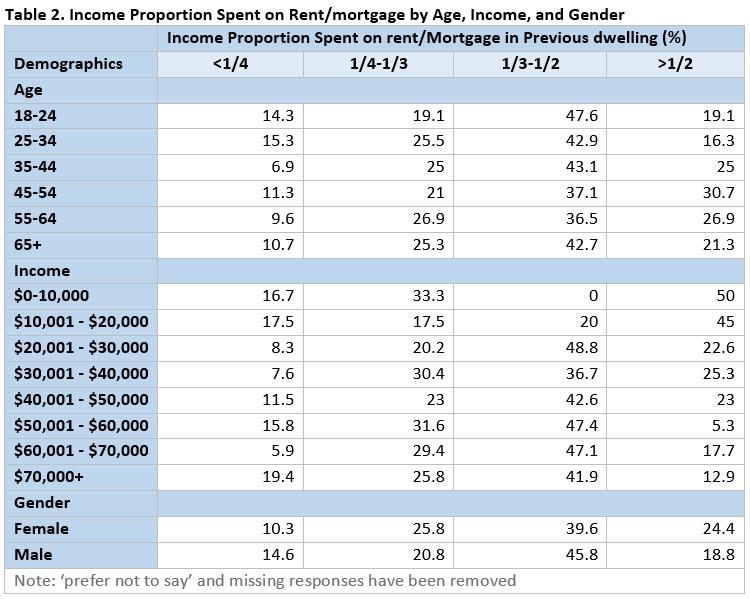
PARTNERSHIPS PATHWAYS POLICY PLACE

                    Housing Data to Assist in Housing Policy Development

                                Background
• Cost Benefit Analysis of New Housing Supply
• NRAS
   • Supply
   • Occupation
   • Investment
   • Tenant Aspirations
• Social Housing Supply and Occupation by State Electorate
• Housing Careers and Affordability
• Risk Return of Affordable Housing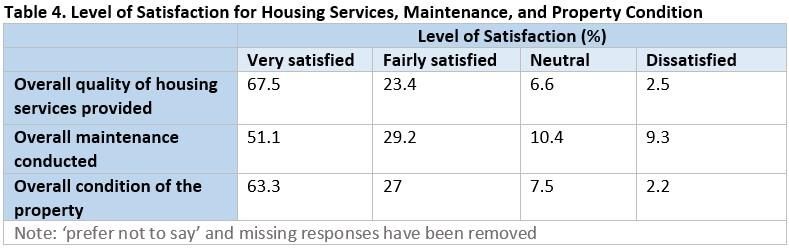
PARTNERSHIPS PATHWAYS POLICY PLACE

       Background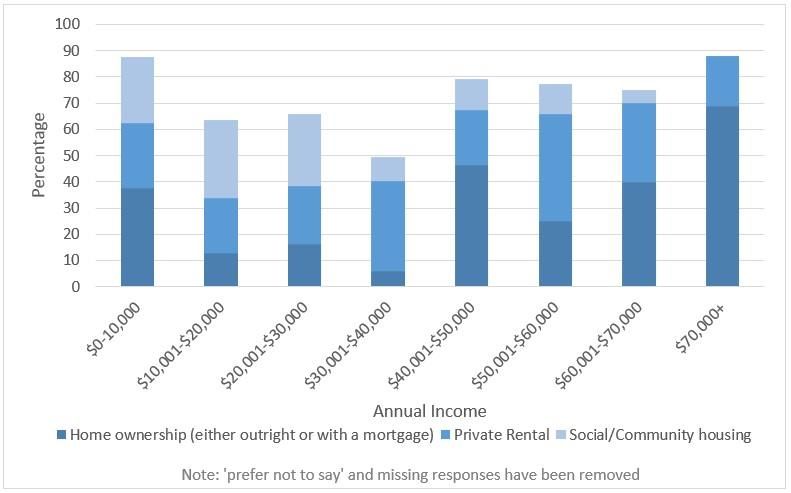
PARTNERSHIPS PATHWAYS POLICY PLACE
                                             Housing Data to Assist in Housing Policy Development

The following presentation provides a high level overview of social and affordable housing data that may assist in the development of
Queensland State housing policy, covering the follow:
1.   The estimated cost benefit analysis to various levels of government in the facilitation of new housing supply using the research by
     National Affordable Housing Consortium (NAHC) and Bond University
2.   National Rental Affordability Scheme (NRAS) overview of supply, occupation, investment and future NRAS tenant aspirations using five
     (5) studies undertaken by NAHC, Sustainable Living Infrastructure Consortium (SLIC), Bond University, Queensland University of
     technology (QUT), University of Queensland (UQ) and NAHP
3.   Queensland social housing supply and occupation
4.   Housing affordability by location, tenure & household cohort characteristics
5.   Affordable housing risk return trade off by Griffith University (GU) PhD candidate, sponsored by GU and NAHC

Soft copies of all background reports and papers are available on request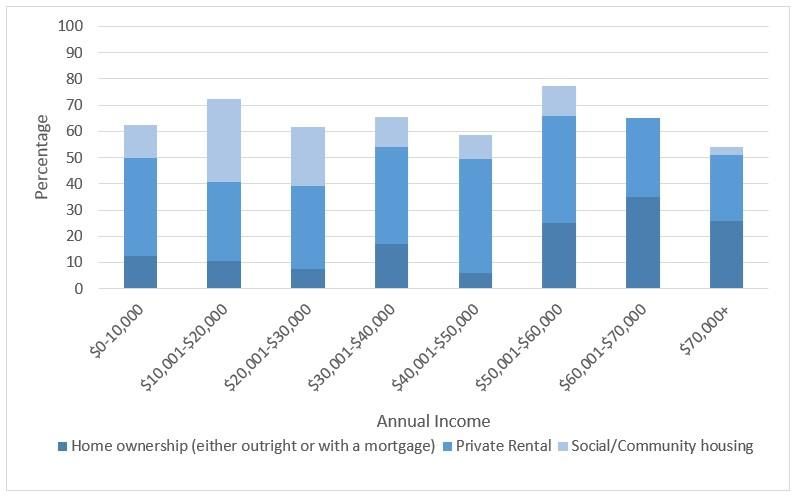
PARTNERSHIPS PATHWAYS POLICY PLACE

                Housing Data to Assist in Housing Policy Development

Cost Benefit Analysis of
 New Housing Supply
                  For full details of following information please refer to
                                      www.SLIC.edu.au
                               Past SLIC Research Projects
 National Rental Affordability Scheme (NRAS) Economic and Taxation Impact Study
  Dated December 2013 Prepared by Professor George Earl and Bond University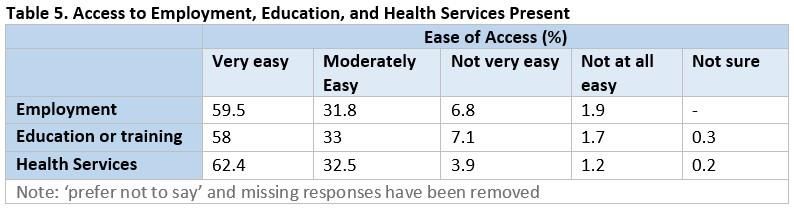
PARTNERSHIPS PATHWAYS POLICY PLACE

                   Cost Benefit Analysis of New Housing Supply
                                 Key Assumptions
• A total of 50,000 NRAS incentives were intended to be provided by June 2016;
• 36,736 NRAS dwellings were delivered or approximately 74% of the originally intended program
• The assumption in the study was all NRAS dwellings, upon the completion of their construction, were to be sold to investors &
  fully leased for ten years at below-market rates;
• After ten years of leasing at below market rates, each NRAS dwelling was to be sold by its investor to another investor;
• The taxation and regulatory systems associated with property and income at the federal, state and local government levels
  (December 2013) would remain unchanged until 2026;
• All full-time equivalent, direct and indirect jobs created by NRAS-driven activities would continue for one year;
• The current mix of different NRAS dwelling types in each state would continue until the conclusion of the NRAS initiative.
  Furthermore, the then current proportion of NRAS incentives in across all states will remain unchanged.
• The December 2013 study outcomes were based on the intended delivery of 50,000 NRAS incentives, but only 36,736 or
  approximately 74% were delivered, therefore the following sides have adjusted the December 2013 study report finding to
  reflect this observation.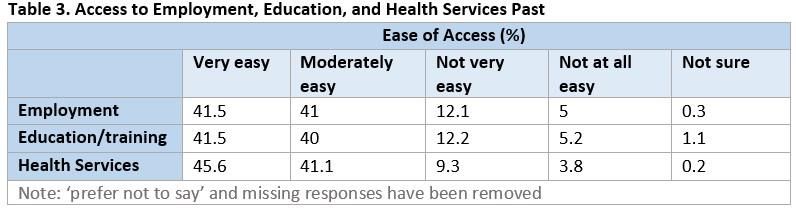
PARTNERSHIPS PATHWAYS POLICY PLACE

                     Cost Benefit Analysis of New Housing Supply
                                   Key Assumptions
• NRAS entitlements were to be held by individual investors (i.e. not a corporation or fund) who are Australian permanent
  residents or citizens, thereby being eligible for the 50% discount on capital gains tax liability when selling their NRAS
  properties;
• All NRAS investors would be subject to individual income tax rates for 2013-14, as result of the assumption above, for the
  entire time period considered in this study;
• NRAS invest would hold only one property (i.e. a NRAS dwelling) in their investment portfolio, in the state where they
  principally reside; and earn an annual income equivalent to the median income within the state of their residence.
• The assumption was that NRAS investors purchase NRAS dwellings in the state of their principal residence was
  incorporated in order to apply the median income of the state to the calculation of capital gains tax. Although some NRAS
  dwellings may be purchased by interstate investors, this assumption it was expected to have minimal impact on the
  relevance of the quantified figures because the median income figures across all states, with the exception of the ACT
  figure, do not vary significantly and are close to the national average figure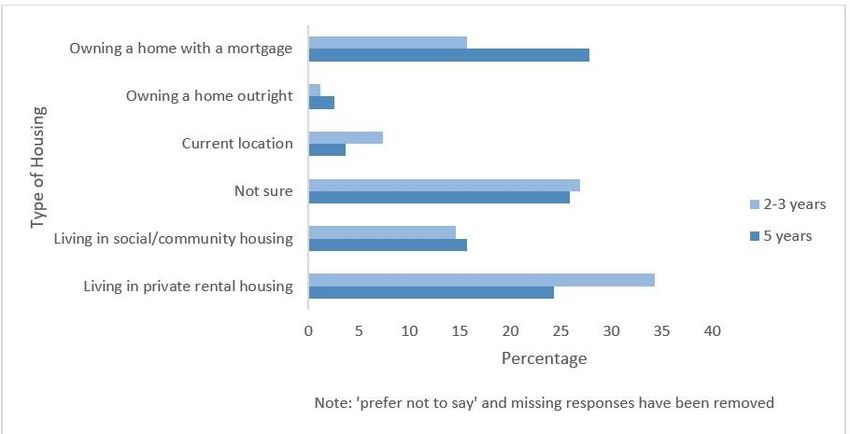
PARTNERSHIPS PATHWAYS POLICY PLACE

                                     Cost Benefit Analysis of New Housing Supply
                                               Executive Summary of Findings

Based on the delivered NRAS entitlements, the initiative would generate a total of $6.9 billion in revenue for federal, state and local government
agencies;

The majority of revenue, with a combined figure of $3.4 billion, would be generated in Queensland and Victoria;

Federal Government would collect the majority of the revenue generated (61%)

State government and local government parties would collect 30% and 9%, respectively;

Across Australia, each NRAS dwelling, on average would generate $185,000 in revenue whereas each NRAS bedroom would generate $94,000;

In relation to the revenue generated by NRAS: A total of $642 million would be generated for local government. The majority of this revenue (80%)
would be collected from annual council rates and charges, which are collected on an on-going basis;
Approximately $2.0 billion in revenue was expected to be created for state government parties throughout Australia.

The majority of this revenue (55%) would be collected from stamp duties and other fees associated with NRAS properties

Over $4.2 billion in revenue would be generated for the Federal Government.

The majority of this revenue (60%) will be created from income taxes associated with jobs created by NRAS-driven activities;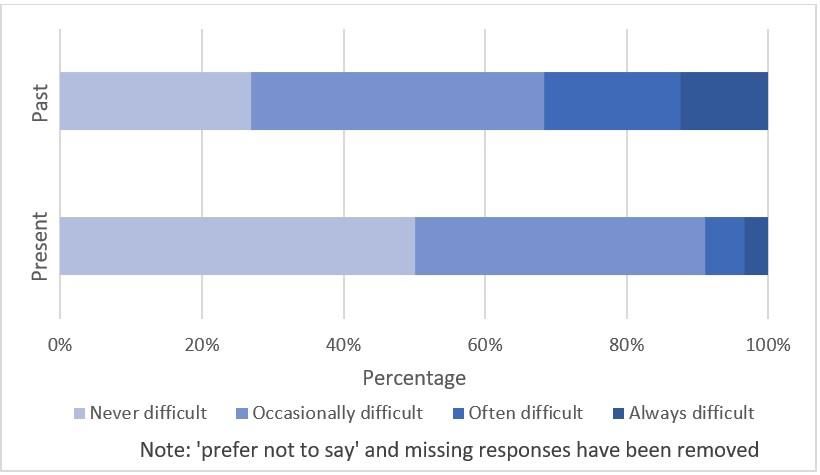
PARTNERSHIPS PATHWAYS POLICY PLACE
                                    Cost Benefit Analysis of New Housing Supply
                                             Executive Summary of Findings

A total of 243,000 full-time equivalent jobs would be created by NRAS initiative and comprise:

90,000 direct jobs in the construction industry, which include 70,000 construction related jobs and 20,000 consulting jobs;

154,000 indirect jobs in other industries, created through multiplier effects as a result of income generated by the construction jobs
above;

The majority of the jobs would be created in Victoria and Queensland where a total of 126,000 jobs would be generated. In relation to the
average number of jobs created per each NRAS incentive and bedroom:

Nationally, 7 jobs would be created per each incentive whereas 3 jobs would be created per each bedroom; Victoria, Tasmania and
Northern Territory have the highest number of jobs created per incentive and bedroom, with 11 jobs per dwelling and 7 jobs per
bedroom;

In relation to income generated by NRAS-driven employment: A total of $14 billion would be generated nationally for the Australian
workforce; and each NRAS incentive and bedroom generates $378,000 and $192,000, respectively.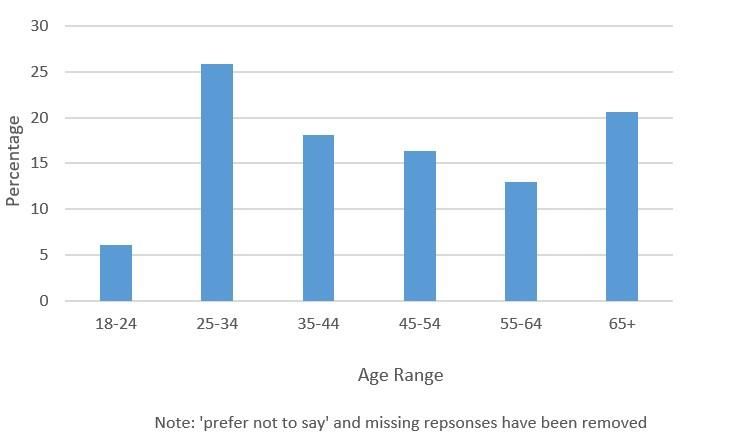
PARTNERSHIPS PATHWAYS POLICY PLACE

                                  Cost Benefit Analysis of New Housing Supply
                                        Executive Summary of Findings

As shown in the key benefits summarised in the previous slides, the NRAS scheme not only resulted in
additional supply of affordable rental dwellings, but also generated significant economic and taxation benefits
for the Australian economy.
Table 1 below displays the average impact figures per each NRAS incentive and bedroom.

                                               Impact per Incentive      Impact per Bedroom
             Government Revenue                     $185,000                  $94,000

             Job                                        7                        3

             Income                                 $378,000                 $192,000
PARTNERSHIPS PATHWAYS POLICY PLACE
NRAS
For full details of following information please refer to
www.SLIC.edu.au
Past SLIC Research Projects
National Rental Affordability Scheme (NRAS) Economic and Study Phase 2: Investor Profile Dated April 2014
Prepared by Professor George Earl and Bond University
Housing Pathways of NRAS Tenants survey dated November 2018 & 2019 prepared by the University of
Queensland in conjunction with NAHC,SLIC and Professor George Earl
Not on Website
NRAS Investor Survey 2017 Prepared by Carol Croce NAHP with Input from Professor George Earl dated
October 2017
NAHC Customer Satisfaction Survey Report dated January 2018, Prepared by Griffith University and
Professor George Earl (referred to as Report 1 in this section summarisation)PARTNERSHIPS PATHWAYS POLICY PLACE
National Affordable Rental Affordability Scheme (NRAS)
Background
NRAS delivered 37,000 new affordable rental homes. It achieved the following policy outcomes:
• Private Investment: NRAS has attracted around $12Billion into affordable rental housing
• Location & Type: Dwellings were built where the Government wanted and to a size and format the
Government approved
• Eligibility: Dwellings are occupied by NRAS Eligible households as determined by Government
• Partnerships: NRAS created community-business partnershipsPARTNERSHIPS PATHWAYS POLICY PLACE
National Rental Affordability Scheme
Background
The gradual loss of NRAS stock will reduce Australia’s social and affordable stock by 7.8% at a time when need is
rising. Expiration date Non-cumulative Cumulative dwellings
dwellings
April 2019 319 319
April 2020 1,410 1,729
April 2021 2,082 3,811
April 2022 4,431 8,242
April 2023 5,920 14,162
April 2024 7,326 21,488
April 2025 8,993 30,481
April 2026 6,255 36,736
The NRAS data support the fact that the program was well targeted to the intended occupiers and has provided
an alternative to social housing as well as a complementary strategy alongside social housing. The Table below
illustrates tenant data, other data also supports the income and locational targeting.
Tenant type # of tenants % of total tenants
(63,957)
Adults 44,587 69.7
Children 19,370 30.29
Sole parents 7,403 11.57
Independent minors 685 1.07
Couples 7,792 12.18
ATSI residents 3,230 5.05
Residents with a disability 5,455 8.53
Residents on Rent Assistance 18,708 29.25PARTNERSHIPS PATHWAYS POLICY PLACE
National Rental Affordability Scheme
Background - Queensland
Queensland Data abstracted from the December 2019 NRAS Quarterly Performance Report.
• Active allocations 10,042 28.55% of that total national allocations
• Active allocation decline by calendar year
Year Number Percentage
2020 323 3.21%
2021 1,079 10.74%
2022 2,694 26.83%
2023 2,498 24.88%
2024 2,845 28.33%
2025 603 6.00%
2026 0 0%
• Location of allocations
Location Number Percentage
Major Cities 7,618 75.86%
Inner Regional 1,439 14.33%
Outer Regional 983 9.78%
Remote 2PARTNERSHIPS PATHWAYS POLICY PLACE
National Rental Affordability Scheme
Background - Queensland
Queensland Data abstracted from the December 2019 NRAS Quarterly Performance Report.
• Active allocation Managers
Entity Number Percentage
Endorsed Charities 4,719 47%
Profit/Other 5,323 53%
• Size of dwelling
Location Number Percentage
Studio 146 1.45%
1 Bed 1,598 15.91%
2 Bed 2,495 24.84%
3 Bed 4,285 42.67%
4 Bed 1,517 15.10%
5+ Bed 1PARTNERSHIPS PATHWAYS POLICY PLACE
National Rental Affordability Scheme
Investor Profile Entity, Satisfaction and Future Investment Aspirations
Investor Profile Type of Dwelling by 1st Investment
2014 2017 Variance 2014 2017 Variance
Business 2.90% 1.87% Similar Apartment 15% 15.46% Similar
Trust 6.60% 5.73% Similar Studio 1% 0.86% Similar
Townhouse 14% 20.49% Growth
Individual 85.70% 91.03% Similar
Detached 41% 50.06% Growth
Community Housing 4.80% 1.37% Decline
Semi-Detached - 10.18% 2014 not collected
Number of Properties
Number of Bedrooms by 1st Investment
2014 2017 Variance
2014 2017 Variance
1 65% 74.49% Growth
1 - 5.52% 2014 not collected
2-5 40% 21.89% Decline 2 - 16.56% 2014 not collected
6-10 2% 1.57% Similar 3 - 46.60% 2014 not collected
11-50 - 0.60% 2014 not collected 4 - 31.07% 2014 not collected
50+ - 1.45% 2014 not collected 4+ - 0.26% 2014 not collectedPARTNERSHIPS PATHWAYS POLICY PLACE
National Rental Affordability Scheme
Investor Profile Entity, Satisfaction and Future Investment Aspirations
Investment Funding Entity Investment Plan Post NRAS
2014 2017 Variance 2014 2017 Variance
Major 4 Bank 61% 60.10% Similar Cont. Renting Full Price - 61.36% 2014 not collected
Other Bank 30% 33.29% Similar Cont. Renting Discount Price - 5.87% 2014 not collected
Trust or SMSF 4% 3.79% Similar Sell Property - 46.74% 2014 not collected
Mostly Own Funds 1% 2.82% Growth Rent Most sell remainder - 1.17% 2014 not collected
Rent Half sell remainder - 1.44% 2014 not collected
1st Investment Price
2014 2017 Variance
Do you Intend to Exit before End of NRAS
Under $200K 1% - 2017 not collected
2014 2017 Variance
$200K-$300K 12% - 2017 not collected
Yes - 3.99% 2014 not collected
$300K-$400K 51% - 2017 not collected
No - 72.07% 2014 not collected
$400-$500K 30% - 2017 not collected
Maybe - 23.94% 2014 not collected
$500K- $600K 4% - 2017 not collected
More than $600K 1% - 2017 not collectedPARTNERSHIPS PATHWAYS POLICY PLACE
National Rental Affordability Scheme
Investor Profile Entity, Satisfaction and Future Investment Aspirations
Investment Satisfaction Reason for your Investment Satisfaction Choice
2014 2017 Variance 2014 2017 Variance
Very Satisfied 35% 19.23% Decline Quality of Tenants 50% 37.98% Growth
Satisfied 41% 35.31% Decline Reliability of Income 10% 42.34% Growth
Neutral 16% 22.61% Growth Investment Yield Expectations - 43.34% 2014 not collected
Dissatisfied 5% 14.99% Growth Quality of Tenancy Management - 26.03% 2014 not collected
Very Dissatisfied 3% 7.86% Growth Quality of Property Management 40% 29.51% Decline
Level of Hands on by Investor 51% 7.10% Decline
At the Conclusion of NRAS would Invest in a Similar Scheme Access to Tax Offset and NRAS 85% 52.43% Decline
2014 2017 Variance Timing of Receipt of Offset/NRAS - 34.12% 2014 not collected
Yes - 57.70% 2014 not collected
No - 13.94% 2014 not collected
Maybe - 28.36% 2014 not collectedPARTNERSHIPS PATHWAYS POLICY PLACE
National Rental Affordability Scheme
Tenant/Management Characteristics and Satisfaction
Age of Principal Tenant Type of Dwelling
Report 2 Report 1
18- 34 32%
Other 17%
35-44 18%
2 Bedrooms 16%
45-64 29%
3 Bedrooms 41%
65+ 21%
4+ Bedrooms 26%
Type of accommodation before NRAS
Report 1 Length of Tenure (Years)
Private Rental 64% Report 1
Living with friends/relative 25% Less than 1 Year 16%
Owned Property 4% 1 to 5 Years 76%
Homeless 2%
6 to 10 Years 8%
Boarding House 1%
Couch Surfing 1%
Other 4.5%PARTNERSHIPS PATHWAYS POLICY PLACE
National Rental Affordability Scheme
Tenant/Management Characteristics and Satisfaction
After Paying Rent do you have enough money for living Adequacy of Public Transport
expenses
Report 1
Report 1 Report 2
Very Dissatisfied 22%
Yes 76% 58%
Dissatisfied 15%
No 12% 42%
Neutral 26%
No Response 12% -
Satisfied or Very Satisfied 37%
Tenant access to Employment, Education & Health
Services Safety/ Security of Property
Report 2 Report 1
Very Dissatisfied 2% Very Dissatisfied 3.1%
Dissatisfied 5% Dissatisfied 5.5%
Neutral 42% Neutral 17.6%
Satisfied or Very Satisfied 51% Satisfied or Very Satisfied 74%PARTNERSHIPS PATHWAYS POLICY PLACE
National Rental Affordability Scheme
Tenant/Management Characteristics and Satisfaction
Satisfaction of Accommodation Quality As a Tenant are you Happy with the Level of Communication
with your Property Manager
Report 1 Report 2
Report 1
Very Dissatisfied 1.1% -
Very Dissatisfied 6.3%
Dissatisfied 2.8% -
Dissatisfied 6.3%
Neutral 13.5% -
Neutral 13.4%
Satisfied/Very Satisfied 82.7% 67.5%
Satisfied or Very Satisfied 74%
As a Tenant are you Treated with Respect
Report 1
Very Dissatisfied 2.2%
Dissatisfied 6.3%
Neutral 11.8%
Satisfied or Very Satisfied 79.7%PARTNERSHIPS PATHWAYS POLICY PLACE
National Rental Affordability Scheme
Tenant/Management Characteristics and Satisfaction
Repairs and Maintenance Response Expectations of Financial Position Post NRAS
Report 1 Report 2
Very Dissatisfied 8.2% Report 2
Dissatisfied 11.8% 9.3%
Neutral 21.7% 10.4% Improve 41%
Satisfied/Very Satisfied 58.4% 81% Stay the Same 27%
Decline 32%
Tenure Expectations Post NRAS
Report 2
Home Ownership 30%
No Change 4%
Unsure 27%
Social/community Housing 16%
Private Rental 24%PARTNERSHIPS PATHWAYS POLICY PLACE
NRAS
For full details of following information please refer to
www.SLIC.edu.au
Past SLIC Research Projects
Note the following slides represent the finding of the following surveys and may not replicate the full NRAS database
Housing Pathways of NRAS Tenants survey dated November 2018 & 2019 prepared by the University of
Queensland in conjunction with NAHC,SLIC and Professor George EarlPARTNERSHIPS PATHWAYS POLICY PLACE
National Rental Affordability Scheme
Tenant Aspirations- Demographics
Demographic characteristics of the tenants:
• ``Over three quarters are female (75.5%).
• Males made up 24.3%
• 3% of respondents are of Aboriginal or Torres Strait Islander descent. •
• 22.7% of respondents were born outside of Australia. •
• Overall, 73.6% of respondents live with children.
• Of these, 56.4% live in one-child households and
• 39.1% in two-child households. •
• 56.4% of respondents reported living in a one-adult household.
• Of these, 71.2% live with children.
• 39.2% of respondents live in a two-adult household. •
• Close to half (46.5%) of respondents were in either in the 25 to 34-year age group
• 20.65% were 65 years and overPARTNERSHIPS PATHWAYS POLICY PLACE
National Rental Affordability Scheme
Tenant Aspirations - Incomes
• Just over one-half of all respondents have annual household incomes below $40,001.
• Of the one-adult households, 67% have an annual income of below $40,001 (compared to 37.5% of two-
adult households and 50% of three-adult households).
• A very small proportion of respondents receive incomes of $10,000 or less (1.8%),
• or incomes over $60,000 per annum (4.6%).
• For respondents earning over $60,000, 80% are in 2 or more adult households,
• and 70% of single adult households in this income range report living with children.
• Approximately 70% of respondents receive rent assistance, meaning they receive some form of
government income assistance.PARTNERSHIPS PATHWAYS POLICY PLACE
National Rental Affordability Scheme
Tenant Aspirations – Dwelling Characteristics
• almost one-half of respondents (47.6%) live in a single detached house.
• The next most common types of dwelling include flats or apartments (19.8%).PARTNERSHIPS PATHWAYS POLICY PLACE
National Rental Affordability Scheme
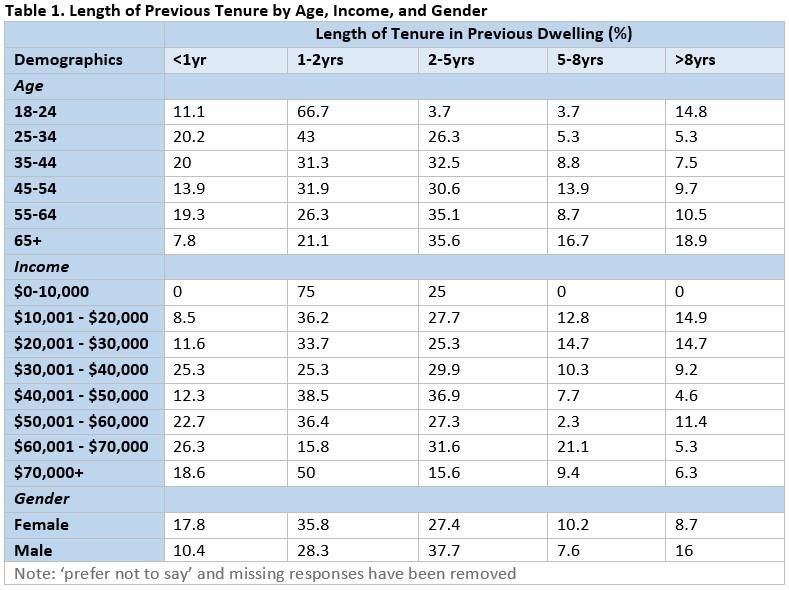
Tenant Aspirations – Housing History
• Previous tenure was predominantly in private rental
(90.7%).
• Most had been in their previous dwelling less than five
years, with 34% having lived in their previous dwelling
for between 1 and 2 years.
• Younger tenants were notably higher in this category
(66.7% of respondents aged 18-24).
• Tenants aged 65 years and over were more likely to
have stayed in their previous dwelling for a longer
period (18.9%) for ‘more than 8 years’).
• Male respondents stayed longer in their previous
dwelling than female respondents.PARTNERSHIPS PATHWAYS POLICY PLACE
National Rental Affordability Scheme
Tenant Aspirations – Rental Stress
• 29.8% of tenants stated it was occasionally difficult to 45
40
afford rent in their previous dwelling. Additionally, 35
• 12% of respondents indicated it was always difficult to 30
25
afford rent. 20
• 42.3% of respondents were spending between one- 15
10
third and one-half of their weekly income on 5
0
rent/mortgage in their previous dwelling. Less than a quarter Between a quarter and a Between a third and a More than a half
third half
Proportion of Income Spent on Rent
Note: 'prefer not to say' and missing responses have been removed
Proportion of Income Spent on Rent/ MmortgagePARTNERSHIPS PATHWAYS POLICY PLACE
National Rental Affordability Scheme
Tenant Aspirations – Rental Stress
• Those with annual incomes below $20,000 were
most likely to have spent more than one-half
their income on rent/mortgage.
• Males spent a lower proportion of their income
on rent/mortgage than females.
• A possible explanation may be that that males
more commonly earn incomes over $50,000
(28%, compared to 23% of females).
• It is important to note that in other income
categories males and female respondents
generally receive similar annual incomesPARTNERSHIPS PATHWAYS POLICY PLACE
National Rental Affordability Scheme
Tenant Aspirations – Location of Dwelling
• most found it at least moderately easy to get from
their pervious dwelling to employment, education
or training, and health services.
• Around 15% of respondents found access to each
category not very easy or not at all easy.PARTNERSHIPS PATHWAYS POLICY PLACE
National Rental Affordability Scheme
Tenant Aspirations – NRAS Occupation Push-Pull Indicators
Reasons for moving: the most common responses were
• ‘Rent/mortgage too expensive’ (28%) and
• ‘major life event’ (27%).
• The least common response given by respondents for moving were due to ‘tenancy terminated’ (2.7%) and
• ‘health issues’ (1.6%).
NRAS Housing Experience
“Do you find your current dwelling affordable for you?”
• The majority of respondents (89%) responded ‘yes’.
• When asked whether the subsidised NRAS rent aided in affordability, 91% responded ‘yes’.
Has the level of difficulty in affording rent has improved since they moved into their NRAS dwellings.
• the most common response changed from ‘occasionally difficult’ when asked about past dwelling (41.3%,
• ‘never difficult’ (50.1%) .PARTNERSHIPS PATHWAYS POLICY PLACE
National Rental Affordability Scheme
Tenant Aspirations – NRAS Affordability
• Between a quarter and a third’ (37.6%) of their income on rent.
• The majority of respondents (70%) reported spending one-half or
less of their income on rent.
• The most common income proportion spent on rent is consistent
among age groups apart from those aged 65 years or older, who
most commonly spend ‘between a third and a half’ (40.5%).PARTNERSHIPS PATHWAYS POLICY PLACE
National Rental Affordability Scheme
Tenant Aspirations- Dwelling Satisfaction
Satisfaction with the physical quality of their current
dwelling, the majority of respondents
• 93% reported being satisfied
• 67% very satisfied;
• 26.5% satisfied. Only
• 2.3% reported being either dissatisfied or very
dissatisfied.PARTNERSHIPS PATHWAYS POLICY PLACE
National Rental Affordability Scheme
Tenant Aspirations – Going Forward
Future housing plans.
• 52% saw themselves living in private rental in 2-3
years’ time,
• 15.7% saw themselves ‘owning a home with a
mortgage in 2-3 years
• 27.9% saw themselves ‘owning a home with a
mortgage 5 years from now.PARTNERSHIPS PATHWAYS POLICY PLACE
National Rental Affordability Scheme
Tenant Aspirations –Going Forward
• 44.5%, aged 18-24, 44.5% see themselves renting privately In 2 to 3 years.
• 57.7% of this age group see themselves, in 5 years, owning a home with a mortgage . Interestingly,
• Just over one-quarter are unsure where they see themselves in 2 to 3 years and in 5 years.
• Of people ‘not sure’ of their future housing aspirations, 54% receive government pensions as an income source and 40%
receive wages/salaries.
• 38.4% of the age group 65 years or older saw themselves in social housing the next 5 years
• 31.3% of the 35-44 age group see themselves in private rental in the next 5 years
• 36% of households with two-adults see themselves owning a home with a mortgage in 5 years
• 79.4% found NRAS ‘very’ or ‘somewhat’ helpful in achieving their housing goals,PARTNERSHIPS PATHWAYS POLICY PLACE
National Rental Affordability Scheme
Tenant Aspirations –Future Tenure by Income
2-3 Years
5 YearsPARTNERSHIPS PATHWAYS POLICY PLACE
National Rental Affordability Scheme
Tenant Aspirations Moving
Tenants next move:
• 38% ‘not sure’,
• 23.7% saw themselves moving in the next 2 to 5 years,
• 9% saw themselves staying in NRAS for ‘at least another 8 years’.
What would prompt tenants to move out of their current dwelling:
16.2% was sale of property,
13% was lease ended and
13.9% was a ‘desire to live in another location’.PARTNERSHIPS PATHWAYS POLICY PLACE
National Rental Affordability Scheme
Tenant Aspirations Moving
What would prevent a tenant moving from their dwelling:
• 24.4% was rents too high elsewhere,
• 13% indicating that their ‘current dwelling is satisfactory’, indicating a range of reasons related to finance and affordability:
• 11.3% cited ‘difficulty saving deposit for house purchase’
• 10.4% reported a ‘poor location where affordable’ as a deterrent to moving
• 10.2% were ‘not able to get finance for house purchase’.
• 4.8% of respondents felt ‘nothing’ would prevent them from moving.
How has NRAS helped you achieve your housing goals?”
• 33% affordability,
• 18.9% a mixture of affordability and housing quality, provided through NRAS, helped them achieve their housing goal.
• 3.5% of respondents felt NRAS was not affordable, provided poor quality of housing, or a combination of both.PARTNERSHIPS PATHWAYS POLICY PLACE
National Rental Affordability Scheme
Tenant Aspirations – Home Ownership
• 53% of tenants hope to purchase their own home in the future, • homeownership was considered to be less stressful than renting.
• 27% indicated they aspired towards homeownership • rent “dead money,” indicating that rental payments only benefit
• Indications of the desire for home ownership include; another person’s investment.
• stability, • tenants felt alienated and uncomfortable in their rental property
• security, due to a lack of freedom over their personal space,
• peace of mind, • Tenants outlined desires to plant gardens, own pets and decorate to
• financial security, their tastes
• preparation for retirement, and • Other participants expressed frustration over the invasiveness of
• providing a long-term home and inheritance for current or future children. frequent inspections.
• Some described homeownership in more intangible terms, for example;
• societal expectation, • 24% of indicated they do not hope to purchase a home;
• a marker of success with one commenting, that to them, homeownership • They saw homeownership as a burden or an unattainable
signified “freedom, finally achieving the Australian dream.” dream due to their financial circumstances,
• Homeownership was often framed as preferable to the disadvantages of • employment status, age, and/or life circumstances.
renting. • they wished to continue living under NRAS in either their
current or other properties.PARTNERSHIPS PATHWAYS POLICY PLACE
National Rental Affordability Scheme
Tenant Aspirations – Factors Inhibiting Home Ownership
• Age was the most significant factor associated with the Age Group Yes No
hope to purchase a home 18-24 Years 96% 4%
25-34 Years 91% 3%
• aspirations for homeownership were prevalent among 35-44 Years 77% 6%
younger age groups, with the majority of participants 45-54 Years 48% 16%
aged 18-44 hoping to purchase a home. 55-64 Years 15% 46%
65-74 Years 9% 60%
• In comparison, the proportion of those without 75+ Years 6% 77%
homeownership aspirations increased within older age
groups, with the majority of participants aged over 55 Ownership Aspirations
not hoping to purchase a home. Male 56% Yes
Female 52% Yes
• Numerous participants saw themselves as too old to
purchase a home. Previous H/O 39% No hope
Never been a H/O 65% Yes to HopePARTNERSHIPS PATHWAYS POLICY PLACE
National Rental Affordability Scheme
Tenant Aspirations – Factors Constraining factors to Home Ownership
• 58% said difficulty saving for a deposit
• 55% said an inability to secure a mortgage
• Insecure/casual employment compounded their financial problems.
• An inability to work due to serious illness or disability
• Financial reliance on the aged pension or the disability pension,
• 57% indicated a lack of information for planning their housing futures.PARTNERSHIPS PATHWAYS POLICY PLACE
Social Housing Portfolio
Queensland
by
State Electorate
The following details have been abstracted from the Queensland Housing Tenancies Data base spreadsheet provided to SLIC in
October 2018PARTNERSHIPS PATHWAYS POLICY PLACE
Social Housing Portfolio Queensland by State Electorate
High Level Key Factors
• Total Number of Dwellings 53,177
• Average Bedroom Size 2.3
• Average Number of Occupants 1.95
• Average Length of Tenancy 11.9 Years
• Average Market Rent $275 per week
• Occupancy (Average)
• Disability 50.55%
• Over 55 38.81%
• Single persons 16.66%
• Single parent 27.74%
• Couple with Children 6.93%PARTNERSHIPS PATHWAYS POLICY PLACE
Understanding the Housing Tenure Changes in Brisbane, Melbourne & Gold
Coast Cities in Australia - Key Findings
• In the three cities, on average,
• more than 70.00% of dwellings are either “owned outright” or “owned with a mortgage”, approximately
• 25.00% of the city population rent from a real estate agent,
• while only less than 5.00% lives in a state or community housing.
• From 2006 to 2016, dwelling count for each housing tenure type increased to keep up with increase of
population.
• During the same period there was a reduction in state and community housing
• The rental market (from real estate agent) is constantly growing,
• Owning a house (either owned outright or owned with a mortgage) is becoming less preferable
• Community housing” tenure is growing, but at a very slow rate.PARTNERSHIPS PATHWAYS POLICY PLACE
Understanding the Housing Tenure Changes in Brisbane, Melbourne & Gold
Coast Cities in Australia - Key Findings
• A large number of people in the bottom 40.00% are under housing stress despite their housing tenure.
• Almost everyone the quintile one who rent via real estate agent pay more than 30 percent of their
income for the rental cost.
• More than 76.00% of community housing tenants who are in quintile 1 are also paid more than 30
percent of their income for rental cost.
• The study has revealed additional opportunities for community housing providers to provide more
affordable dwellings. Based on 2016 census data (affordable housing demand),
• Melbourne need 92,357,
• Brisbane need 54,970 and
• Gold Coast and North Coast New South Wales need 21,557
• Across Greater Melbourne, Greater Brisbane, Gold Coast and North Coast New South Wales, the
majority of affordable community housing tenants are those who are earning low income, mainly from
lone person and single parent household (especially the single mothers).
• Understanding the dynamic of this specific household characteristics will help government to reduce the
housing stress and supply suitable products for these cohorts.PARTNERSHIPS PATHWAYS POLICY PLACE
Understanding the Housing Tenure Changes in Brisbane, Melbourne & Gold Coast Cities in Australia
2006- 2016 Tenure Change
• 70.00% of dwellings are either “owned outright” or “owned
0% 10% 20% 30% 40% 50% 60% 70% 80% 90% 100%
with a mortgage”,
• approximately 25.00% of the city population rent from a Greater Melbourne 482,953 570,250 338,244
real estate agent, Greater Brisbane 210,705 282,967 181,998
• less than 5.00% lives in a state or community housing.
Gold Coast and North Coast New South Wales 81,430 87,096 59,962
• Brisbane has the highest percentage:
• 3.68% rent from a state housing, and Owned outright Owned mortgage Rent: Real estate agent
• 0.58% live in a community housing. Rent: State housing Rent: Community housingPARTNERSHIPS PATHWAYS POLICY PLACE
Understanding the Housing Tenure Changes in Brisbane, Melbourne & Gold Coast Cities in Australia
2006- 2016 Tenure Change
• In general, across from 2006 to 2016, dwelling count for Change in the dwelling count for each housing tenure type
each housing tenure type increased, Rent:
Owned Owned Rent: Real Rent: State
Community
outright mortgage estate agent housing
housing
• From 2011, there has been a large withdrawal of state 2006 - 2011
housing. Melbourne 22,880 64,073 54,067 904 1,160
Brisbane 13,852 43,081 38,073 2,948 984
• In 1943, the Commonwealth Housing Commission was Gold Coast and
North
- 3,468 7,512 8,540 - 385 55
established to create 80,000 dwellings per year to house Coast New South
Wales
workers during the industrial development period. 2011 - 2016
Melbourne 12,312 42,034 80,093 - 1,065 967
• Over the past decade, the state and territory Brisbane 9,011 12,452 36,046 - 1,248 233
Gold Coast and
governments have sold off more than 20,000 public North
5,861 4,799 9,044 3 - 73
Coast New South
housing units, Wales
2006 - 2016
Melbourne 35,192 106,107 134,160 - 161 2,127
Brisbane 22,863 55,533 74,119 1,700 1,217
Gold Coast and
North
2,393 12,311 17,584 - 382 - 18
Coast New South
WalesPARTNERSHIPS PATHWAYS POLICY PLACE
Understanding the Housing Tenure Changes in Brisbane, Melbourne & Gold Coast Cities in Australia
Market Response to Demand
• In June 2018, the Australian Institute of Health and Welfare reported that there were 140,600 applicants on the
waiting list to secure a public housing, with 45,800 were homeless (Henriques Gomes, 2019).
• The term “housing affordability” refers to the relationship between housing cost (i.e., mortgage / rent payment) and
household income (Thomas, 2016).
• A household is described as being in “housing stress” when it is paying more than 30.00% of its income on housing
costs.
• Based on 2006, 2011 and 2016 census data, this study calculated the percentage of household that is in housing stress
for each income quintile, for each city, namely Greater Melbourne (Table 2), Greater Brisbane (Table 3), Gold Coast
and North Coast New South Wales (Table 4).
• Due to the limitation of the dataset, this study uses the median for each household income bracket and
mortgage/rent payment bracket to calculate the percentage of household that is under housing stress for each income
quintile.PARTNERSHIPS PATHWAYS POLICY PLACE
Understanding the Housing Tenure Changes in Brisbane, Melbourne & Gold Coast Cities in Australia
Market Response to Demand
Greater Melbourne
Table 2: Housing stress in Greater Melbourne according to each income quintile
Rent: Community
Owned mortgage Rent: Real estate agent Rent: State housing
Income housing
quintile
2006 2011 2016 2006 2011 2016 2006 2011 2016 2006 2011 2016
1 73% 78% 77% 97% 97% 97% 67% 53% 68% 57% 69% 76%
Gold Coast and North Coast New South Wales
2 66% 74% 66% 54% 83% 74% 17% 26% 24% 18% 36% 37% Table 4: Housing stress in Gold Coast and North Coast New South Wales according to each income
3 41% 49% 30% 11% 16% 13% 2% 2% 2% 4% 6% 5% quintile
4 14% 22% 11% 1% 0% 1% 1% 0% 1% 0% 0% 0% Rent: Community
Owned mortgage Rent: Real estate agent Rent: State housing
Income housing
5 8% 6% 0% 0% 0% 0% 0% 0% 0% 0% 0% 0% quintile
2006 2011 2016 2006 2011 2016 2006 2011 2016 2006 2011 2016
Greater Brisbane 1 66% 77% 72% 97% 98% 98% 59% 42% 61% 55% 73% 78%
Table 3: Housing stress in Greater Brisbane according to each income quintile
2 64% 74% 65% 71% 93% 87% 7% 19% 22% 40% 48% 50%
Rent: Community
Owned mortgage Rent: Real estate agent Rent: State housing 3 35% 57% 32% 15% 29% 22% 0% 5% 0% 6% 14% 7%
Income housing
quintile
2006 2011 2016 2006 2011 2016 2006 2011 2016 2006 2011 2016 4 17% 30% 11% 0% 0% 1% 0% 0% 0% 0% 0% 0%
1 65% 76% 79% 97% 97% 97% 56% 36% 57% 70% 77% 84% 5 4% 8% 0% 0% 0% 0% 0% N/A N/A 0% N/A N/A
2 58% 71% 66% 51% 89% 79% 5% 14% 20% 24% 48% 46%
3 26% 50% 28% 6% 19% 13% 0% 1% 0% 2% 12% 6%
4 12% 23% 9% 0% 0% 0% 0% 0% 0% 0% 0% 0%
5 3% 6% 0% 0% 0% 0% 0% 0% 0% 0% 0% 0%PARTNERSHIPS PATHWAYS POLICY PLACE
Understanding the Housing Tenure Changes in Brisbane, Melbourne & Gold Coast Cities in Australia
Demand
The following indicators only considers household with an income in the bottom 40.00% of the Australian household income
distribution, refer to as “lower income” households (The Australian Housing and Urban Research Institute, 2019b). In this report, the
dwelling count only considers those in income quintile 1 and 2.
Greater Melbourne
Income Rent: Real estate agent Rent: Community housing Brisbane
quintile 2006 2011 2016 2006 2011 2016
1 20,009 15,299 23,673 1,382 1,405 1,972 Income Rent: Real estate agent Rent: Community housing
2 24,336 52,070 65,892 183 737 820 quintile 2006 2011 2016 2006 2011 2016
3 6,188 13,129 15,302 15 30 32 1 10,938 7,055 11,642 924 848 1,123
4 595 0 462 0 0 0 2 16,330 32,519 41,499 175 743 706
5 0 0 0 0 0 0 3 1,881 9,708 8,973 6 59 29
Total 51,128 80,498 105,329 1,580 2,172 2,824 4 0 0 105 0 0 0
A need of 92,357 5 0 0 0 0 0 0
affordable dwellings in 2016 Total 29,149 49,282 62,219 1,105 1,650 1,858
Gold Coast and North Coast New South Wales A need of 54,970
Income Rent: Real estate agent Rent: Community housing affordable dwellings in 20162
quintile 2006 2011 2016 2006 2011 2016
1 5,535 3,500 4,438 192 202 229
2 9,634 14,726 16,728 114 183 162
3 1,816 4,941 4,938 10 20 7
4 0 0 62 0 0 0
5 0 0 0 0 0 0
Total 16,985 23,167 26,166 316 405 398
A need of 21,557
affordable dwellings in 20162PARTNERSHIPS PATHWAYS POLICY PLACE
Understanding the Housing Tenure Changes in Brisbane, Melbourne & Gold Coast Cities in Australia
2006- 2016 Future Supply to Meet Demand
• The following slides investigate the household characteristics of tenants in rental market, from both private market (from real estate agent) and
community housing.
• This investigations is to:
• Examine the difference between private rental market and community housing
• Inform the future housing design in order to meet the current demand.
• The slides use the ABS census 2016
• Counting Persons,
• Place of Enumeration to study the personal characteristics of the household reference person, in reference to housing tenure choices.
• Only consider the
• reference person in (1) a primary family, and
• (2) a non-family household.
• By doing so, counting persons dataset gives a similar representation to the counting dwellings dataset.PARTNERSHIPS PATHWAYS POLICY PLACE
Understanding the Housing Tenure Changes in Brisbane, Melbourne & Gold Coast Cities in Australia
2006- 2016 Future Supply to Meet Demand - Melbourne
0% 10% 20% 30% 40% 50% 60% 70% 80% 90% 100%
496 588 Rent: Real estate agent 45,172 31,145
One family household: Couple family with
586 no children
42,798 Rent: Community housing 449 142
76,314 One family household: Couple family with
children
One family household: One parent family Rent: Real estate agent 56,681 27,873
78,584 Lone person household Rent: Community housing 374 213
1,032
Group household
Rent: Real estate agent 6,954 33,436
84,553
Inner ring: Rent: Real estate agent
3,824 40,391 Outer ring: Rent: Community housing Rent: Community housing 83 948
Rent: Real estate agent 41,722 36,865
Rent: Community housing 1,593 2,233
Distribution of household composition for each housing tenure in Greater
Melbourne Rent: Real estate agent 22,579 20,221
Rent: Community
Household composition Rent: Real estate agent
housing Rent: Community housing 280 219
One family household: Couple family with no children 22.81% 8.87%
One family household: Couple family with children 25.27% 8.84% Distribution of gender across differentMale
household
Female composition for each housing
One family household: One parent family 12.07% 15.56% tenure
Lone person household 23.49% 57.67%
Group household 12.79% 7.48%
Percentage distribution of household composition in Greater MelbournePARTNERSHIPS PATHWAYS POLICY PLACE
Understanding the Housing Tenure Changes in Brisbane, Melbourne & Gold Coast Cities in Australia
2006- 2016 Future Supply to Meet Demand - Brisbane
281 0% 10% 20% 30% 40% 50% 60% 70% 80% 90% 100%
515
One family household: Couple family with
20,630 no children Rent: Real estate agent 21,545 16,824
38,367 One family household: Couple family with
450 children
One family household: One parent family Rent: Community housing 402 113
35,049
Lone person household
Rent: Real estate agent 29,152 20,185
Group household
49,332 570 Rent: Community housing 312 134
2,131 Inner ring: Rent: Real estate agent
30,193 Outer ring: Rent: Community housing
Rent: Real estate agent 4,973 25,221
Rent: Community housing 81 484
Distribution of household composition for each housing tenure in Greater
Rent: Real estate agent 19,299 15,752
Brisbane
Rent: Community Rent: Community housing 841 1,291
Household composition Rent: Real estate agent
housing
One family household: Couple family with no children 21.25% 12.79% Rent: Real estate agent 10,987 9,647
One family household: Couple family with children 27.33% 11.18%
One family household: One parent family 16.72% 14.16% Rent: Community housing 142 143
Lone person household 19.41% 52.93%
Group household 11.43% 6.98%
Male Female
Distribution of gender across different household composition for each housing
Percentage distribution of household composition in Greater Brisbane tenurePARTNERSHIPS PATHWAYS POLICY PLACE
Understanding the Housing Tenure Changes in Brisbane, Melbourne & Gold Coast Cities in Australia
2006- 2016 Future Supply to Meet Demand – Gold Coast
0% 10% 20% 30% 40% 50% 60% 70% 80% 90% 100%
99
156
One family household: Couple family with
5,878 no children Rent: Real estate agent 6,871 5,300
12,177 One family household: Couple family with
children
Rent: Community housing 110 49
110 One family household: One parent family
11,901
Lone person household Rent: Real estate agent 9,246 7,254
Group household Rent: Community housing 72 39
16,506
501 157
11,033 Inner ring: Rent: Real estate agent
Outer ring: Rent: Community housing Rent: Real estate agent 1,740 9,299
Rent: Community housing 30 138
Distribution of household composition for each housing tenure Rent: Real estate agent 6,367 5,523
Rent: Community
Household composition Rent: Real estate agent
housing Rent: Community housing 205 294
One family household: Couple family with no children 20.54% 14.99%
One family household: Couple family with children 27.84% 10.57% Rent: Real estate agent 3,051 2,825
One family household: One parent family 18.61% 15.08%
Lone person household 20.07% 48.13% Rent: Community housing 54 44
Group household 9.91% 9.51%
Percentage distribution of household composition Male Female
Distribution of gender across different household composition for each housing
tenurePARTNERSHIPS PATHWAYS POLICY PLACE
Risk Return of
Affordable Housing
For full details of following information please refer to
www.SLIC.edu.au
Past SLIC Research Projects
Prabath Morawakage; PhD Student- Griffith University (NAHC & GU Sponsored)
Research Symposium January 2020PARTNERSHIPS PATHWAYS POLICY PLACE
RQ 01. What risks and returns are associated with
the affordable housing asset class?
Objectives
• To estimate the risk of affordable home ownership assets in Australia
• To evaluate the return drivers of affordable home ownership assets in
Australia
• To compare the risk and return of affordable home ownership assets
against the other asset classes Australia and the world
55PARTNERSHIPS PATHWAYS POLICY PLACE
Data Sources
• CoreLogic RP data: House Prices, Land Area and Zoning
• ABS: Lending rates, Sampling data
• SQM Research: Rent yield and Liquidity data
• Queensland Police: Crime rates
56PARTNERSHIPS PATHWAYS POLICY PLACE
Risk Analysis
57PARTNERSHIPS PATHWAYS POLICY PLACE
International Review of Social Housing
Country England Scotland Austria Australia
Population 56,000,000 5,400,000 8,800,000 25,200,000
Housing Market Size 23,000,000 2,600,000 4,700,000 9,200,000
Size of the Social Housing 2,300,000 600,000 1,000,000 420,000
% of the Social Housing 10.00% 23.00% 23.00% 4.60%
Cost of Financing LIBOR plus 25- 150 bp 5% -6% for A+ EurIBOR rate + 0-30 bp AIBOR + 30-50 bp
Market Exposure to banks 3.77% 1.45% 0.57% 0.03%
Credit Quality Aa2 to A1 A+ AAA A2 to AA2
58PARTNERSHIPS PATHWAYS POLICY PLACE
Risk Comparison between Affordable Housing Asset
and Different Investments
Lower Risk
Moderate
Higher Risk
0.20% Size of the
0.35% Figure
59PARTNERSHIPS PATHWAYS POLICY PLACE
Variable Mean Return Downside devition VaR EVaR CVaR
AU ESG 0.066% 7.527% -18.520% -15.806% -20.555% ESG
ESTO ESG -1.185% 17.968% -31.195% -34.497% -44.960%
focussed
GSIN ESG 1.552% 6.094% -13.387% -9.028% -13.786%
EU ESG 0.506% 6.408% -13.670% -12.157% -15.876% Investments
ESG_SNP500 2.841% 5.263% -9.248% -7.002% -10.861%
APCI ESG 1.450% 4.622% -11.761% -9.087% -12.652%
Social Infra REIT -5.182% 5.529% -16.990% -18.008% -20.832% Australia real Estate
REIT SNP ASX 200 1.499% 2.884% -5.317% -6.600% -6.823% Investments
Asiapci 600 RE 1.576% 3.935% -9.745% -9.542% -11.054%
MSCI US REIT 1.919% 4.835% -9.762% -9.393% -11.855%
MSCI EU RE 1.019% 6.049% -10.605% -11.479% -14.417%
EU 600 RE 1.358% 5.397% -9.198% -10.030% -12.497%
Regional and Global
Dow EQ REIT 3.013% 4.859% -7.177% -7.900% -10.027% Real Estate
MSCI Glob RE 1.407% 5.144% -7.299% -9.016% -10.772% Investments
r1_q3 4054 0.598% 1.689% -4.035% -4.823% -4.505%
r2_q3 4077 0.430% 2.901% -6.107% -6.177% -7.466%
r3_q3 4078 0.118% 1.768% -5.168% -5.116% -5.398% Houses
r4_q3 4109 0.544% 2.920% -7.741% -8.593% -8.241% Below Q3
r5_q3 4116 0.631% 3.454% -8.004% -8.322% -9.222% price level
r6_q3 4207 0.132% 3.984% -7.657% -8.175% -9.828%
r7_q3 4208 0.163% 5.791% -13.386% -13.244% -24.625%
r8_q3 4209 1.022% 6.561% -17.463% -18.351% -19.071% 3/11
r9_q3 4211 0.333% 2.374% -5.990% -5.315% -7.557%
r10_q3 4226 0.328% 3.800% -6.642% -9.068% -9.507% 60
r11_q3 4301 0.498% 7.729% -13.832% -16.215% -19.223%PARTNERSHIPS PATHWAYS POLICY PLACE
Return Analysis
61PARTNERSHIPS PATHWAYS POLICY PLACE
Risk & Returns from Affordability to Expensive
Postcodes
Q Area Post Code Median Price r_q3 Downside VaR CVaR
Redbank Plains 4301 271,138 0.498% 7.729% -13.832% -19.223%
Beenleigh 4207 300,433 0.132% 3.984% -7.657% -9.828%
Q1
Inala 4077 324,485 0.430% 2.901% -6.107% -7.466%
Average 298,685 0.353% 4.871% -9.198% -12.172%
Forest Lake - Doolandella 4078 352,534 0.132% 1.768% -5.168% -5.398%
Coomera 4209 356,726 1.022% 6.561% -17.463% -19.071%
Q2
Nerang - Mount Nathan 4211 409,019 0.333% 2.374% -5.990% -7.557%
Average 372,759 0.496% 3.568% -9.540% -10.675%
Ormeau-yatala 4208 418,965 0.163% 5.791% -13.386% -24.625%
Q3 Ferny Grove 4054 462,748 0.598% 1.689% -4.035% -4.505%
Average 440,857 0.380% 3.740% -8.710% -14.565%
Robina 4226 505,964 0.328% 3.800% -6.642% -9.507%
Sunny Bank, Mc Gregor.. 4109 525,635 0.544% 2.920% -7.741% -8.241%
Q4
Calamvale - Stretton 4116 542,006 0.631% 3.454% -8.004% -9.222%
Average 524,535 0.501% 3.391% -7.463% -8.990%
62PARTNERSHIPS PATHWAYS POLICY PLACE
Short run
Q Area Post Code
Land Liquidity Rent Yield Crime L2 Interest
Redbank Plains 4301 0.0003** -0.1012 13.3471 11.0106* 10.3613
Q1 Beenleigh 4207 0.0001 0.0540 -13.9112** -3.1137 0.8983
Inala 4077 0.0003 -0.0665 2.5376 -1.6891 -3.1350
Forest Lake - Doolandella 4078 0.0002 0.0325 -1.415777 3.8714 0.3144
Q2 Coomera
Nerang - Mount Nathan
Ormeau-yatala
4209
4211
4208
-0.0002
0.0000
0.0007**
0.0695
-0.0547
0.0159
-19.94356
2.3806
2.8821
-0.8365
2.5531
-9.6696
13.9255
-4.5728*
-1.8646
ARDL
Q3
Ferny Grove
Robina
4054
4226
0.0003
-0.0001
0.0321
-0.0059
-0.874743
-2.660368
-2.2020
0.2772
0.1264
0.6797
Results
Q4 Sunny Bank, Mc Gregor.. 4109 0.0003 0.0189 -3.981618 2.0832 -2.9058
Calamvale - Stretton 4116 0.0002 0.0817 4.9189 7.8611 4.2655
Long run
Q Area Post Code
Land Liquidity Rent Yield Crime L2 Interest
Redbank Plains 4301 0.0002*** 0.04191** 3.1618*** -3.4105*** -0.8487***
Q1 Been leigh 4207 0.0002*** 0.04191** 3.1618*** -3.4105*** -0.8487***
Inala 4077 0.0002*** 0.04191** 3.1618*** -3.4105*** -0.8487***
Forest Lake - Doolandella 4078 0.0002*** 0.04191** 3.1618*** -3.4105*** -0.8487***
Q2 Coomera 4209 0.0002*** 0.04191** 3.1618*** -3.4105*** -0.8487***
Nerang - Mount Nathan 4211 0.0002*** 0.04191** 3.1618*** -3.4105*** -0.8487***
Ormeau-yatala 4208 0.0002*** 0.04191** 3.1618*** -3.4105*** -0.8487***
Q3
Ferny Grove 4054 0.0002*** 0.04191** 3.1618*** -3.4105*** -0.8487***
Robina 4226 0.0002*** 0.04191** 3.1618*** -3.4105*** -0.8487***
Q4 Sunny Bank, Mc Gregor.. 4109 0.0002*** 0.04191** 3.1618*** -3.4105*** -0.8487***
Calamvale - Stretton 4116 0.0002*** 0.04191** 3.1618*** -3.4105*** -0.8487*** 63PARTNERSHIPS PATHWAYS POLICY PLACE
AU RAU ESTO GSIN EU ESG_~500 APCI
r1_q3 0.0490
0.7671
0.0828
0.6522
-0.0967
0.5583
0.0700
0.6721
0.0754
0.6485
0.0349
0.8377
0.0410
0.8125
Correlation among
r2_q3 -0.2683 -0.5111* -0.2940 -0.2618 -0.2264 -0.3341* -0.3606*
ESG and Affordable
0.0987 0.0028 0.0693 0.1074 0.1658 0.0433 0.0307
housing returns
r3_q3 -0.1560 -0.0504 -0.1909 -0.0397 -0.0183 -0.0317 -0.0058
0.3429 0.7843 0.2444 0.8102 0.9118 0.8523 0.9731
r4_q3 -0.1242 -0.0592 -0.3003 0.0265 0.0291 0.1258 0.0046
0.4514 0.7474 0.0632 0.8729 0.8604 0.4581 0.9787
r5_q3 0.3613** -0.0614 -0.0027 0.2537 0.3554** 0.1010 0.1554
0.0238 0.7384 0.9872 0.1192 0.0264 0.5518 0.3655
r6_q3 -0.1724
0.2940
-0.1470
0.4221
-0.0775
0.6392
-0.1033
0.5313
-0.0971
0.5567
-0.0756
0.6566
-0.0512
0.7669
Opportunities for
r7_q3 0.1029 0.3021 0.2586 0.1363 0.2167 0.0920 0.1616 Portfolio
0.5331 0.0928 0.1119 0.4081 0.1851 0.5882 0.3465
Diversification
r8_q3 -0.2794 0.1043 -0.0638 -0.2932 -0.3485** -0.1503 -0.0608
0.0850 0.5700 0.6995 0.0700 0.0297 0.3747 0.7245
r9_q3 -0.1471 -0.2646 -0.1198 -0.1825 -0.1407 -0.2389 -0.2020
0.3715 0.1433 0.4676 0.2662 0.3930 0.1544 0.2375
r10_q3 -0.1724 -0.1470 -0.0775 -0.1033 -0.0971 -0.0756 -0.0512
0.2940 0.4221 0.6392 0.5313 0.5567 0.6566 0.7669
r11_q3 0.0420 0.4548** -0.0070 -0.0480 -0.0468 -0.0548 0.0910 64
0.7997 0.0089 0.9664 0.7717 0.7772 0.7473 0.5978PARTNERSHIPS PATHWAYS POLICY PLACE
r1_q3 r2_q3 r3_q3 r4_q3 r5_q3 r6_q3 r7_q3 r8_q3 r9_q3 r10_q3 r11_q3
r1_q3 1.000
r2_q3 0.091 1.000
Return Correlations
0.583
r3_q3 0.246 0.080 1.000
among postcodes
0.131 0.629
r4_q3 0.061 0.118 0.117 1.000
0.711 0.475 0.478
r5_q3 0.136 0.119 -0.168 -0.289 1.000 Opportunities for Portfolio
0.411 0.470 0.307 0.074
Diversification
r6_q3 0.170 0.3347* 0.3953* 0.099 -0.003 1.000
0.301 0.037 0.013 0.549 0.987
r7_q3 0.107 -0.160 0.072 -0.276 0.142 0.020 1.000
0.518 0.332 0.665 0.089 0.388 0.906
r8_q3 -0.200 -0.131 0.001 0.076 -0.082 -0.042 0.141 1.000
0.223 0.426 0.995 0.645 0.618 0.798 0.393
r9_q3 -0.032 0.5188* 0.168 -0.026 0.185 0.306 -0.170 0.041 1.000
0.849 0.001 0.306 0.878 0.260 0.058 0.302 0.803
r10_q3 -0.142 0.125 0.259 0.169 -0.055 0.4970* 0.121 -0.180 0.3243* 1.000
0.388 0.450 0.111 0.303 0.739 0.001 0.464 0.273 0.044
r11_q3 0.139 -0.3893* 0.071 0.060 -0.056 -0.216 0.102 0.4276* -0.3183* -0.140 1.000
65
0.398 0.014 0.667 0.719 0.734 0.186 0.538 0.007 0.048 0.394PARTNERSHIPS PATHWAYS POLICY PLACE
Conclusion
66PARTNERSHIPS PATHWAYS POLICY PLACE
Conclusion
• Return below Q3 is more attractive in terms of risks and returns
• Houses belonging to 75% below and 50% above house prices are more
suitable for investments
• Most affordable segment is not attractive
• Risk is lower in terms of downside protection and policy framework
• Moderate annualized returns after adjusting rent yield (5-6%)
• Most Affordable areas can be highly volatile (Further investigations on
different aspects such as crimes, media attention etc. should be done )
67You can also read